
The Power of 3-7-11 and the Grand Super Cycle: How We Saw the Bullish Turn in April 2025 Back on April 9, 2025, while World Indices were dropping sharply and global sentiment had turned overwhelmingly bearish, we published an article that challenged the fear-driven narrative. We explained why selling was not the right approach and […]
-

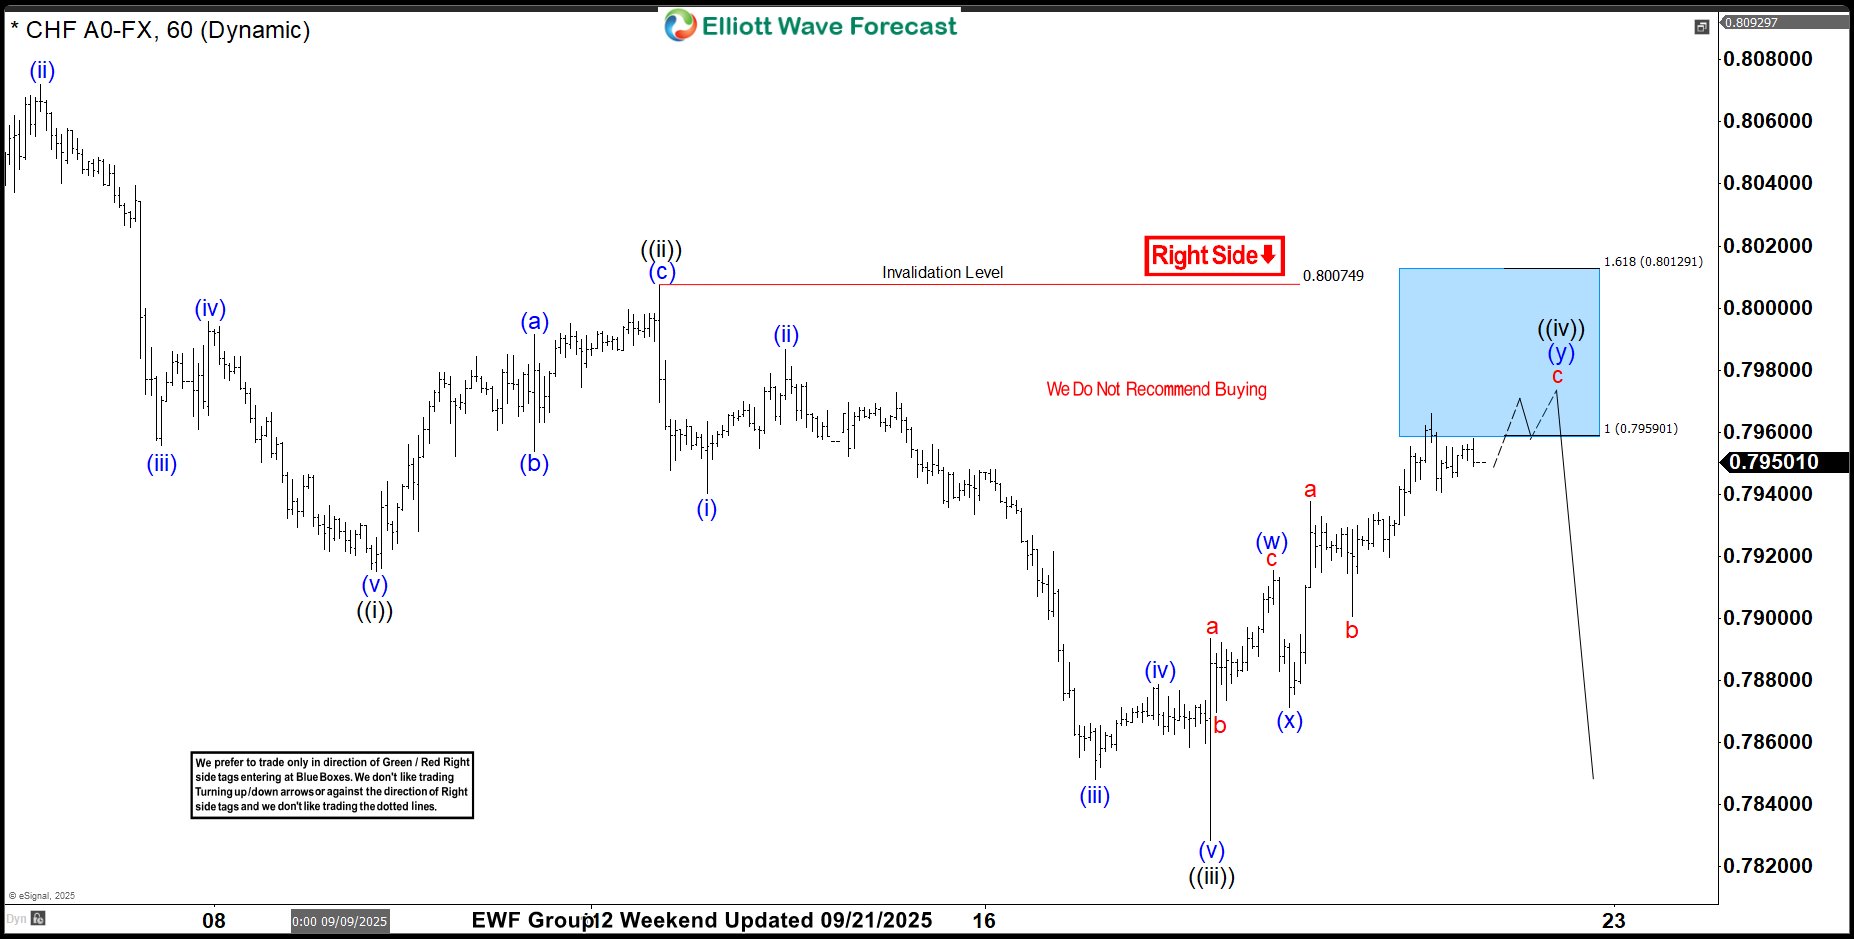
USDCHF Elliott Wave Analysis Shows Fresh Sell-Off From Bluebox
Read MoreHello traders. Welcome to a new blog post where we discuss recent trade setups from the blue box to the Elliottwave-forecast members. In this one, the spotlight will be on the USDCHF currency pair. The USDCHF currency pair remains clearly bearish. This trend is driven by dollar weakness since September 2022 and more recently January […]
-

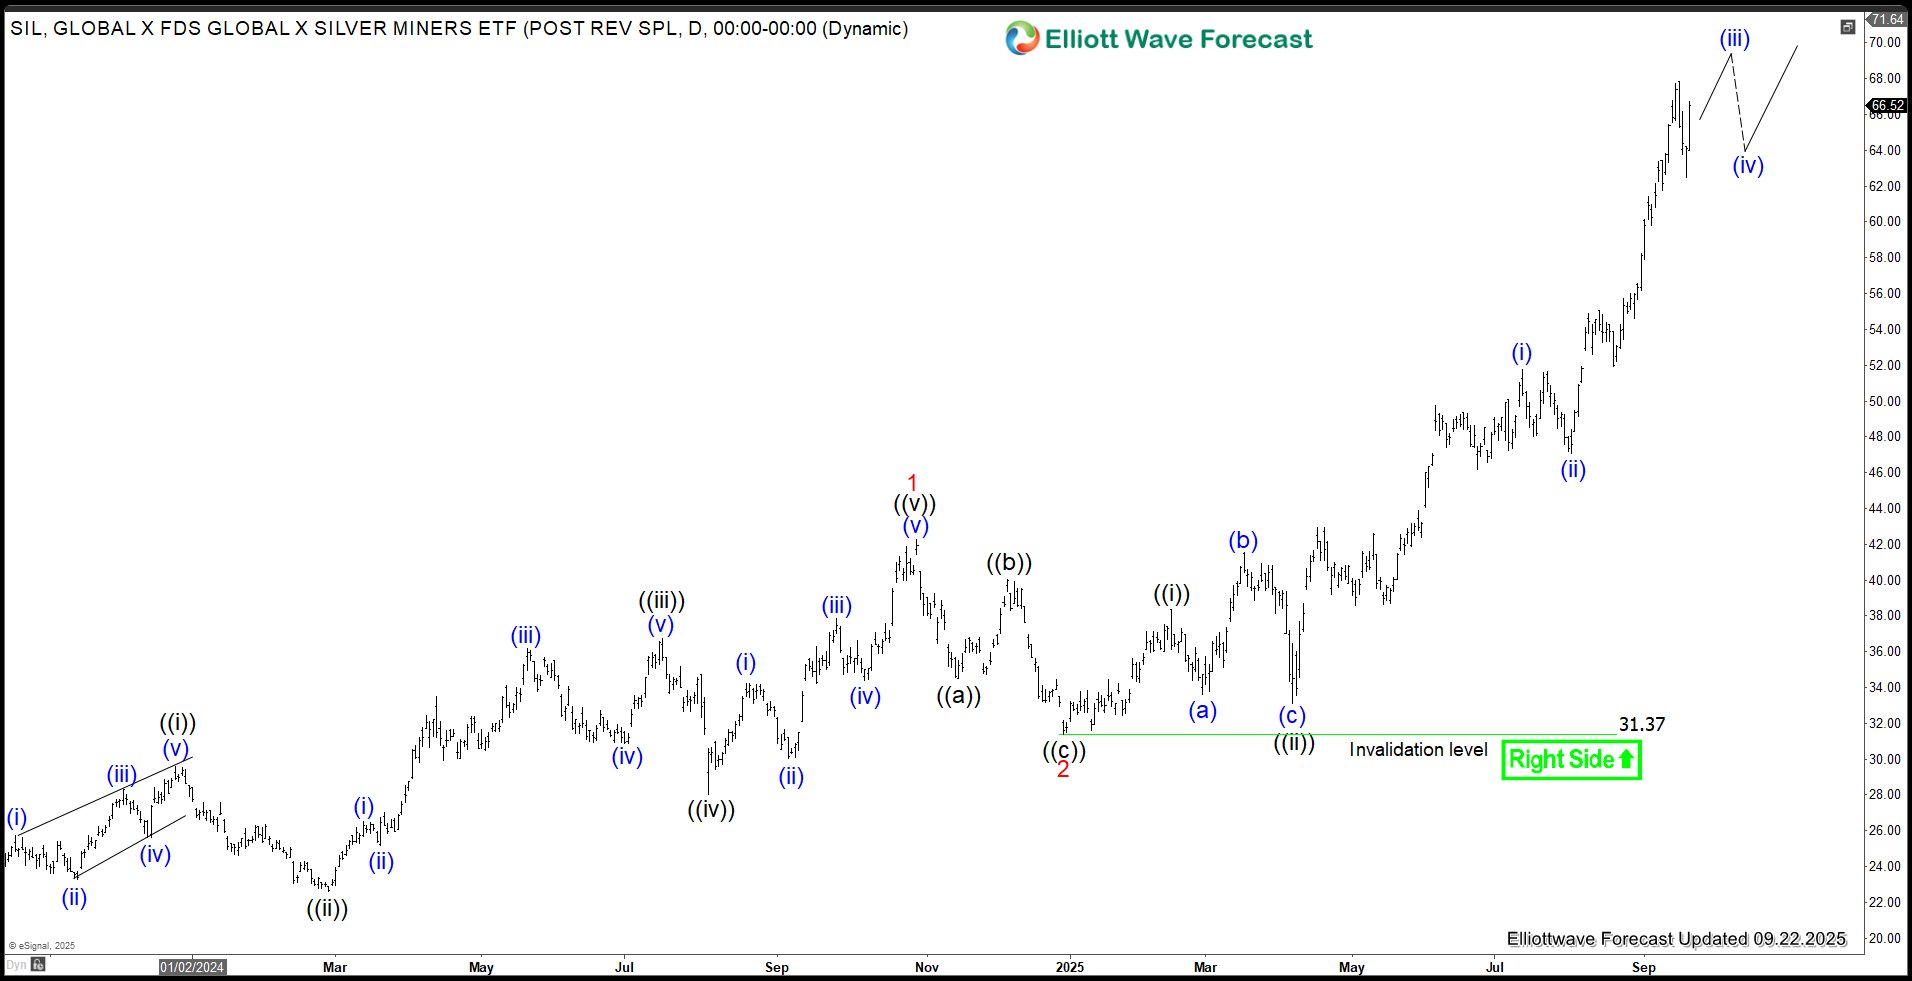
Silver Miners ETF (SIL) Rides Strong Bullish Wave
Read MoreThe Global X Silver Miners ETF (SIL), launched in April 2010, tracks the Solactive Global Silver Miners Total Return Index, offering exposure to silver mining companies like Wheaton Precious Metals and Pan American Silver. With over $1 billion in assets, SIL provides a volatile yet targeted investment option for those seeking to capitalize on silver […]
-

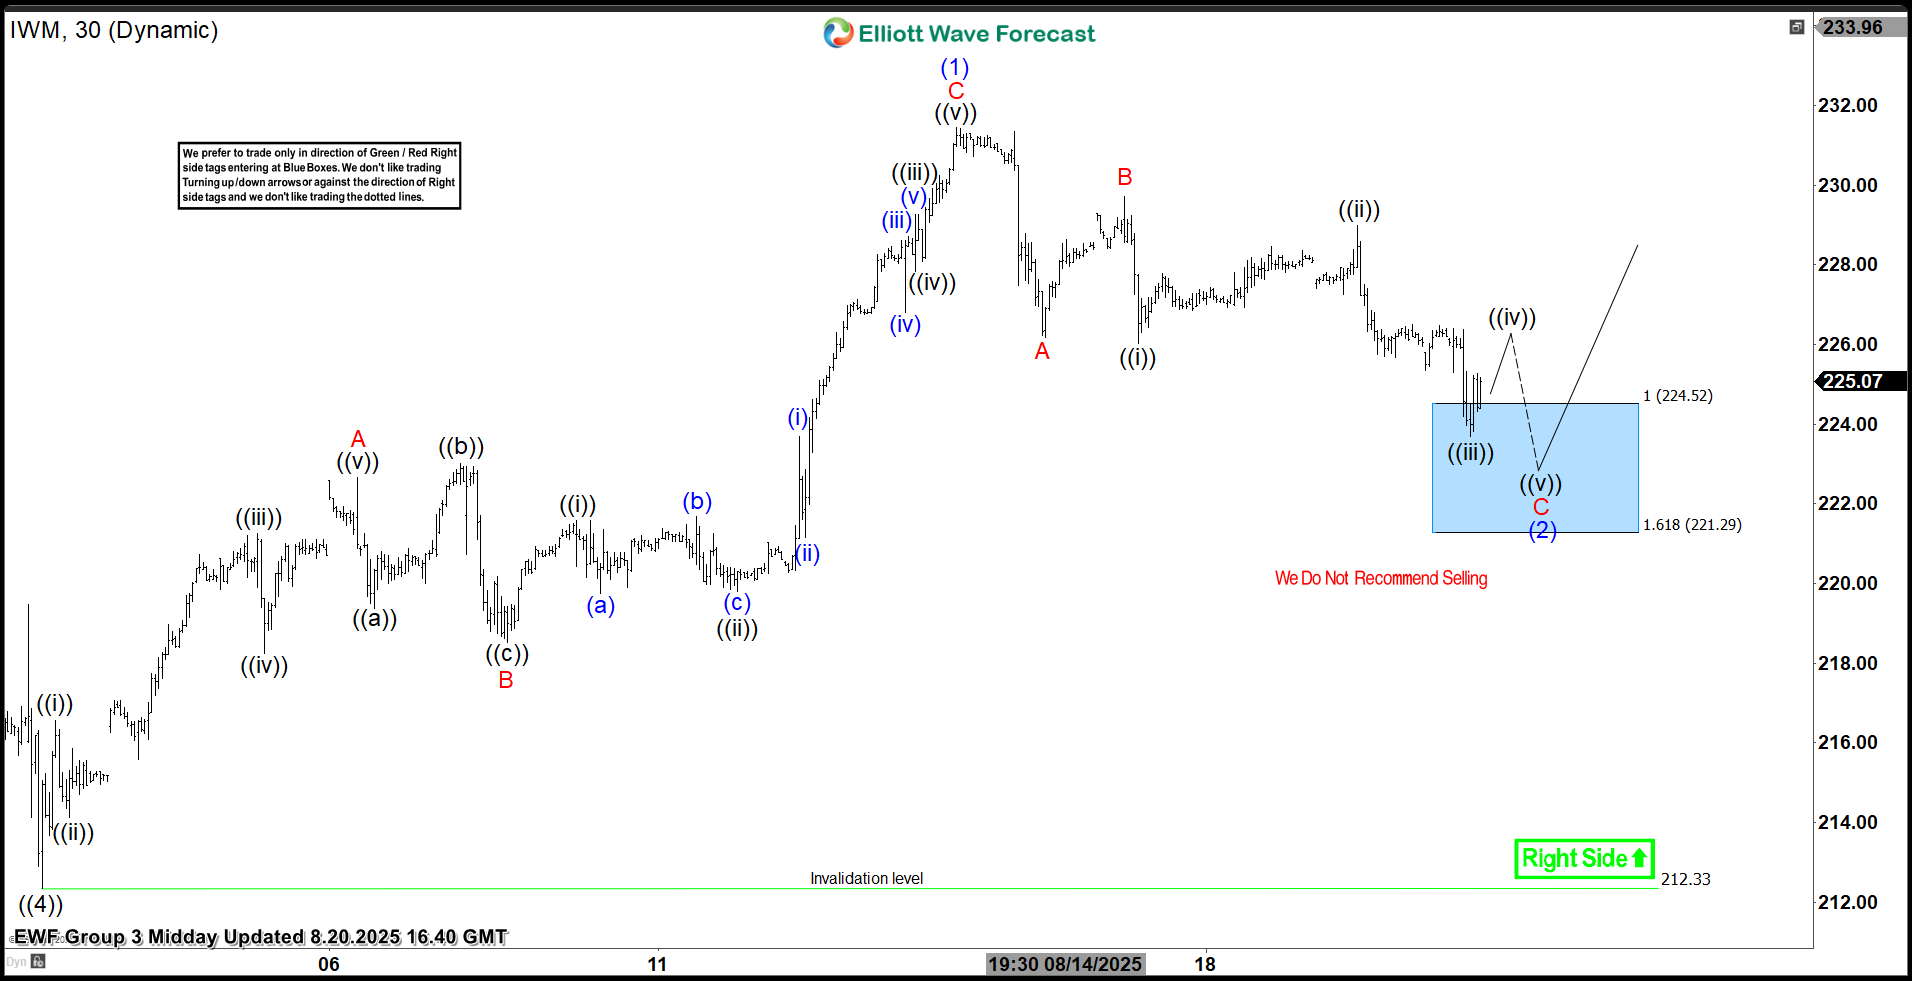
iShares Russell 2000 ETF (IWM)- Elliott Wave Buying the Dips at the Blue Box
Read MoreAs our members know we have had many profitable trading setups recently. In this technical article, we are going to talk about another Elliott Wave trading setup we got in iShares Russell 2000 ETF -IWM . The ETF has completed its correction exactly at the Equal Legs zone, also known as the Blue Box Area. […]
-

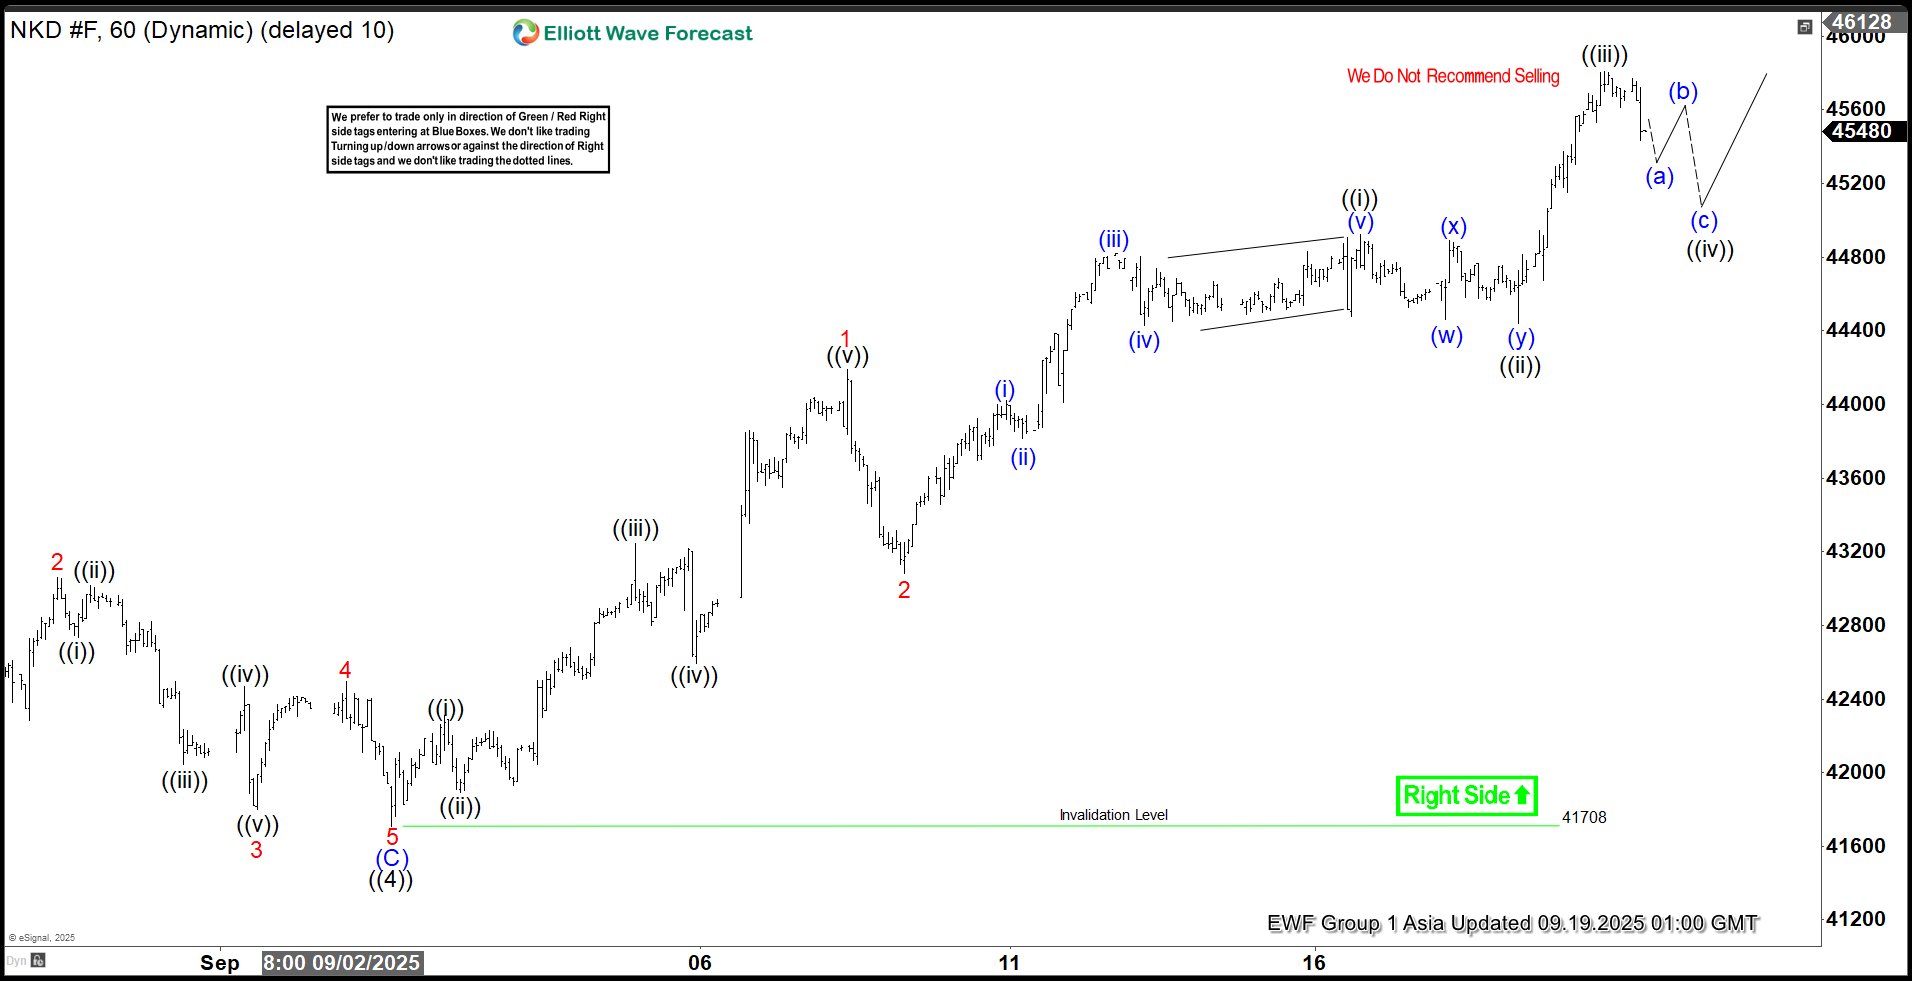
Elliott Wave Update: Nikkei (NKD) Advances in Fifth Wave
Read MoreNikkei Futures (NKD) is extending higher in impulsive structure within wave 5. This article and video look at the Elliott Wave path of the Index.