

The Power of 3-7-11 and the Grand Super Cycle: How We Saw the Bullish Turn in April 2025 Back on April 9, 2025, while World Indices were dropping sharply and global sentiment had turned overwhelmingly bearish, we published an article that challenged the fear-driven narrative. We explained why selling was not the right approach and […]
-
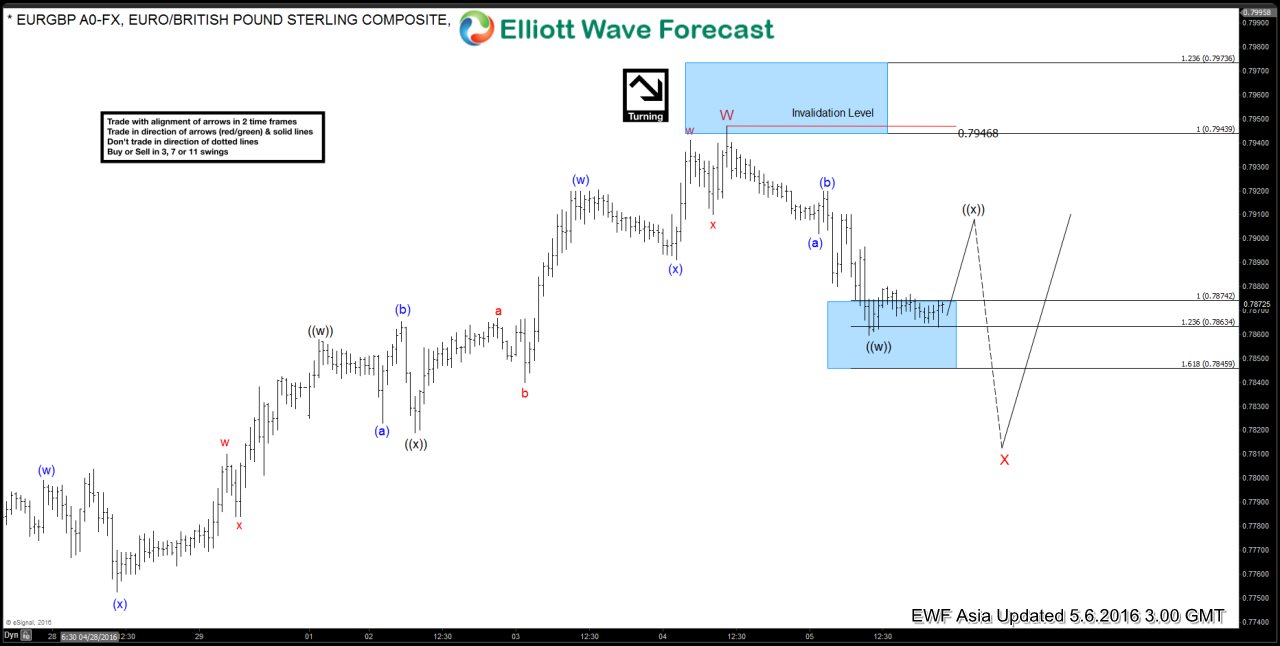
$EURGBP Live Trading Room – Trade Plan
Read MoreHere is a quick blog from our Live Trading Room host, Dan Hussey. Take a look at how to manage your risk by using inflection zones and Elliot Wave to your advantage. The Live Trading Room is held daily at 8:00 AM EST , join Dan there for more insight into these proven methods of trading. EUR/GBP Live […]
-
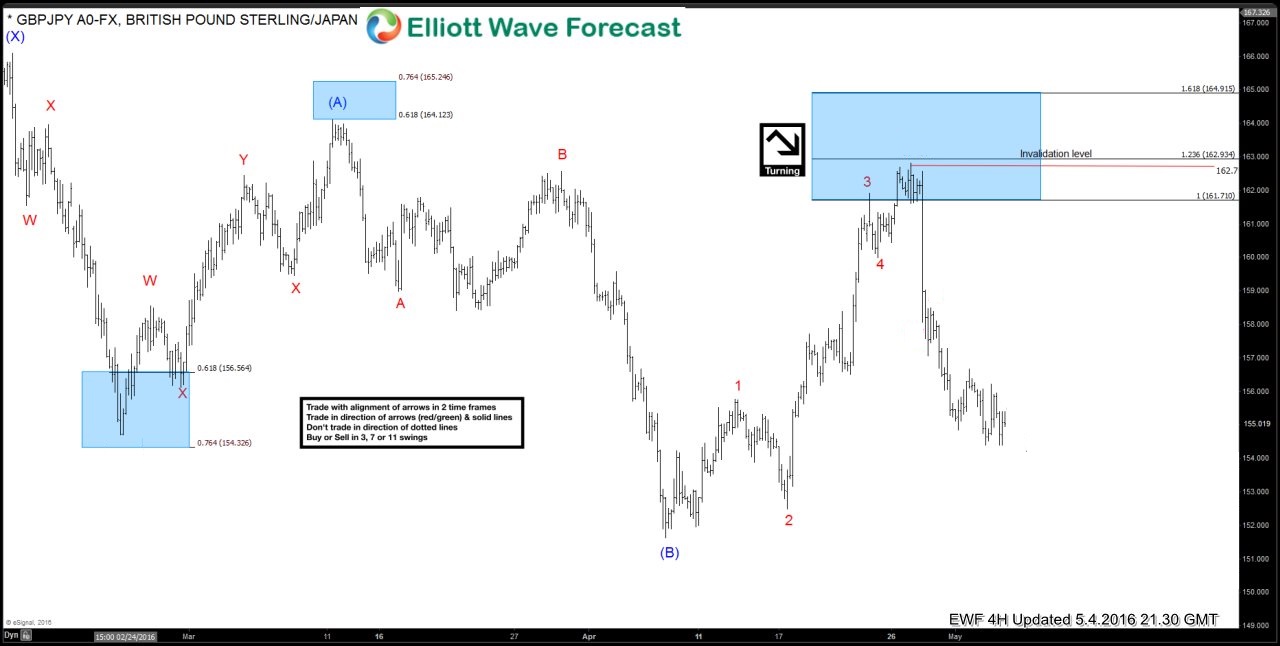
Did he fall or was he pushed? The true story of GBPJPY
Read MoreWe all think we know the story of “Humpty Dumpty”. We all have heard the tale of the Wall and his Great Fall. We know how hard the soldier tried but couldn’t get Mr. Dumpty back together again. Similarly keeping that story on mind on previous Thursday April 28th, when Bank of Japan showed up […]
-

The Disease of Me: Reason behind failure of many traders
Read MoreThe Market is the king of all kings when it comes to trading. Many traders enter the Market with the belief that they will become multi-millionaires in a very short period of time and start disrespecting the Market. As we have always said, the Market is very mysterious and most trader experience a higher degree of success during […]
-
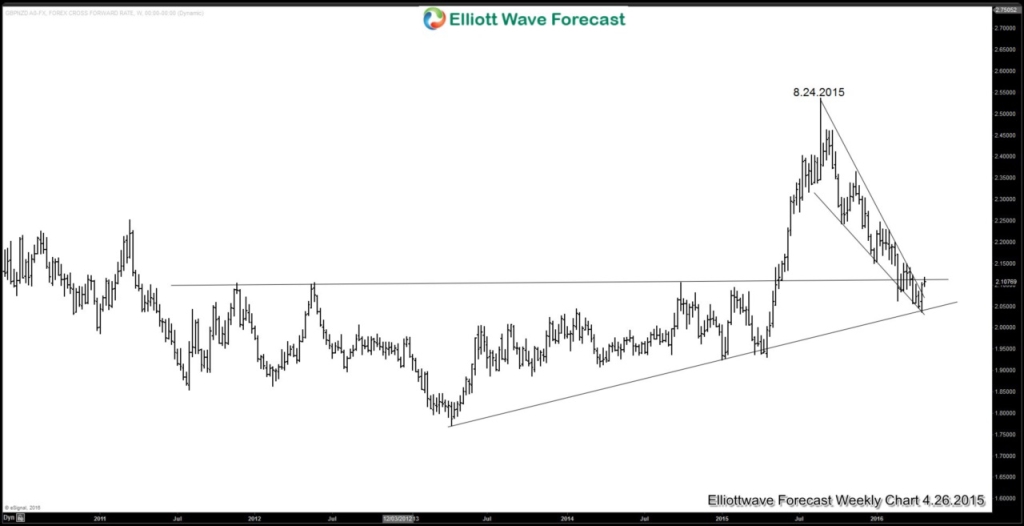
New Zealand Dollar Outlook in Q2 2016
Read MoreIn the last Monetary Policy Statement (MPS) in March, Reserve Bank of New Zealand (RBNZ) is not happy with the currency’s continued appreciation. They cited the New Zealand Dollar trade-weighted exchange rate is more than 4% higher than projected in December. In subsequent meeting in April 28, RBNZ decided to stay put with the OCR (Official Cash Rate) but RBNZ Governor Graeme […]