

The Power of 3-7-11 and the Grand Super Cycle: How We Saw the Bullish Turn in April 2025 Back on April 9, 2025, while World Indices were dropping sharply and global sentiment had turned overwhelmingly bearish, we published an article that challenged the fear-driven narrative. We explained why selling was not the right approach and […]
-
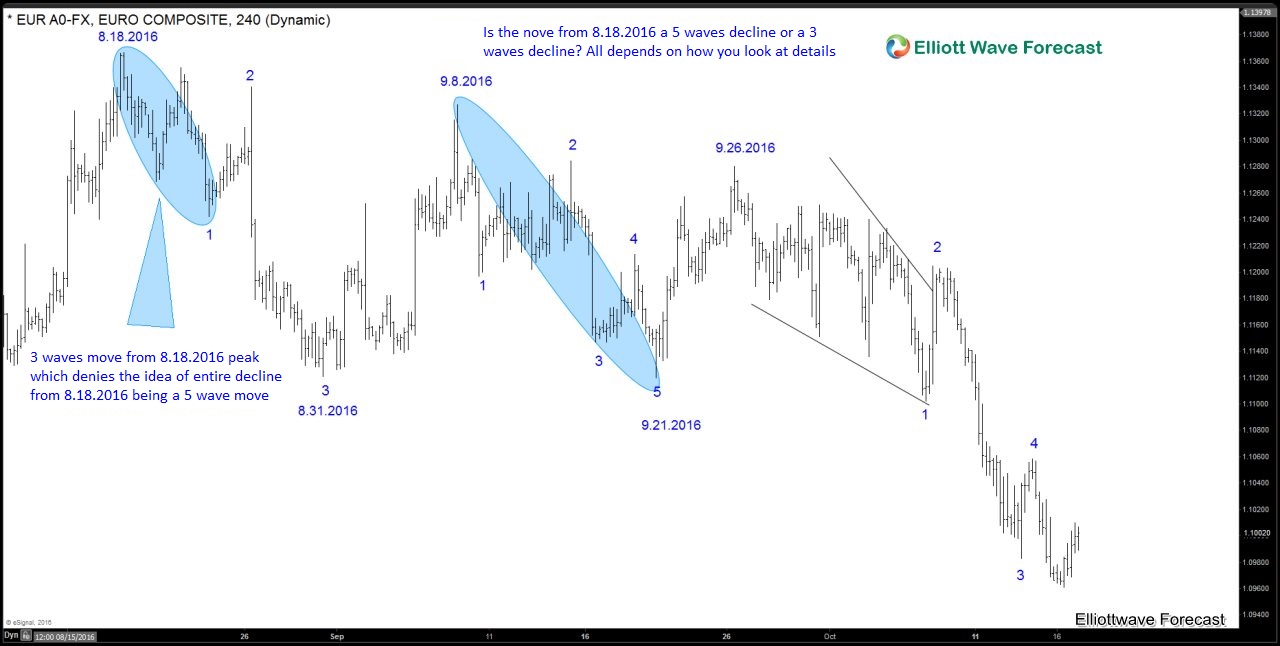
EURUSD :Is decline from 8/18 a 5 wave move?
Read MoreThe Elliott wave theory explains that in a five waves move, every subdivision has to come in five waves three of which will advance in five waves and two would be pull backs of those against the trend. In this video, we are going to take a look at the decline in EURUSD from the peak of […]
-
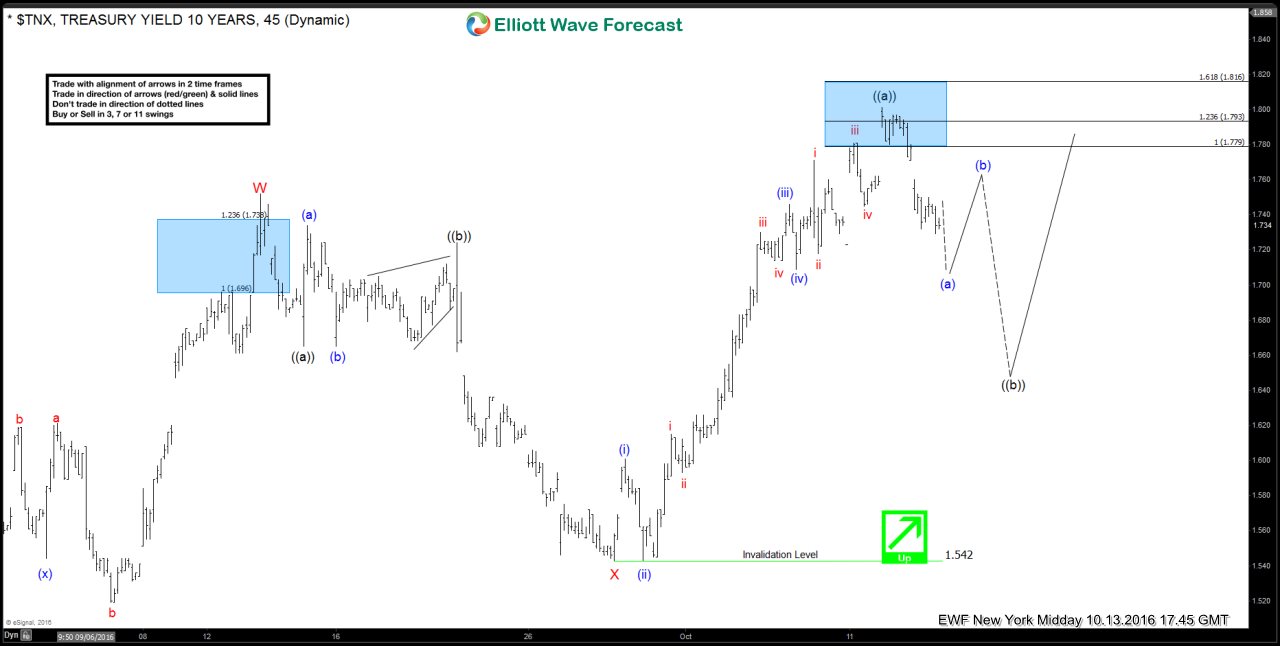
$TNX (10 Year Yields) Short-term Elliott Wave Analysis 10.14.2016
Read MoreShort term Elliott wave count suggests that pullback to 1.542 at 9/28 ended wave X. The rally from there looks to be unfolding as a 5 wave move and wave ((a)) is proposed complete at 1.801 . Wave ((b)) pull back is currently in progress to correct the cycle from 9/28 low (1.542) before the yields resume higher. We […]
-
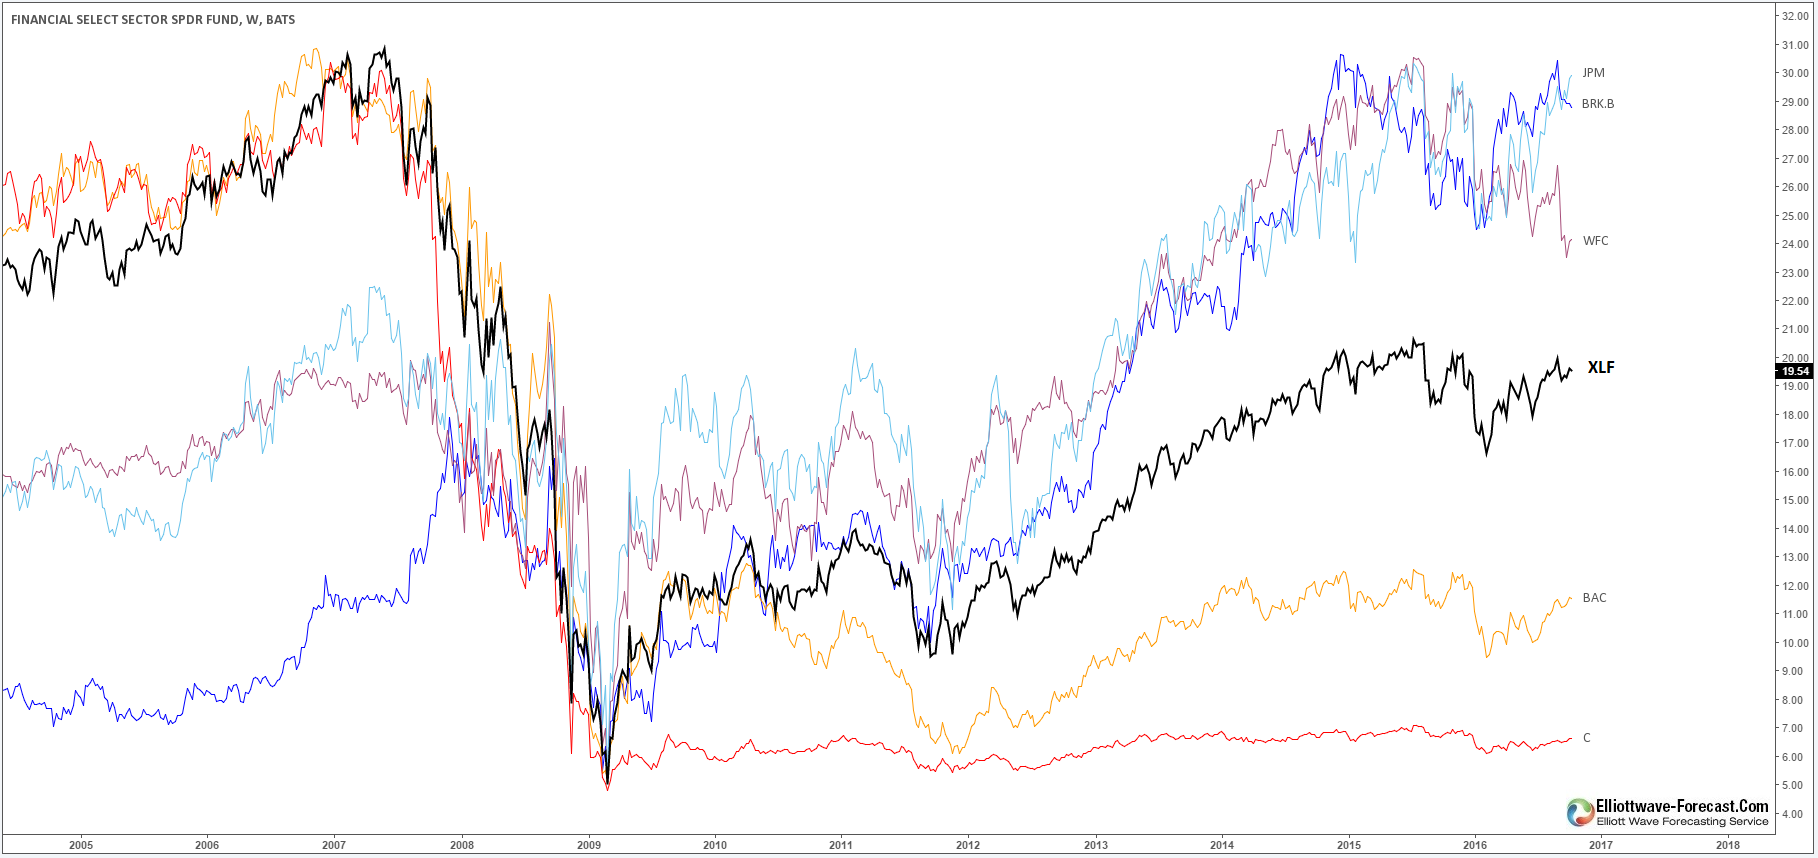
Financial Sector Overview
Read MoreEconomists often tie the overall health of the economy with the health of the financial sector which took the hardest hit in the 2008 crisis as big companies struggled and Lehman Brothers filled for bankruptcy . People lost faith in the financial system while many others saw the hit as new investing opportunity after the […]
-

NZDCAD Elliott Wave Trade Setup 10.13.2016
Read MoreNZDCAD is showing a 5 swing sequence from 8/24 (0.8246) low and more upside is favored. Near term, pair is correcting cycle from 4/27 (0.86) low in 3, 7, or 11 swing before turning higher again. We plan to buy the pullback in 3, 7, or 11 swing for another extension higher. Entry: 0.912 (updated Oct 23) Stop loss: […]