
The Power of 3-7-11 and the Grand Super Cycle: How We Saw the Bullish Turn in April 2025 Back on April 9, 2025, while World Indices were dropping sharply and global sentiment had turned overwhelmingly bearish, we published an article that challenged the fear-driven narrative. We explained why selling was not the right approach and […]
-

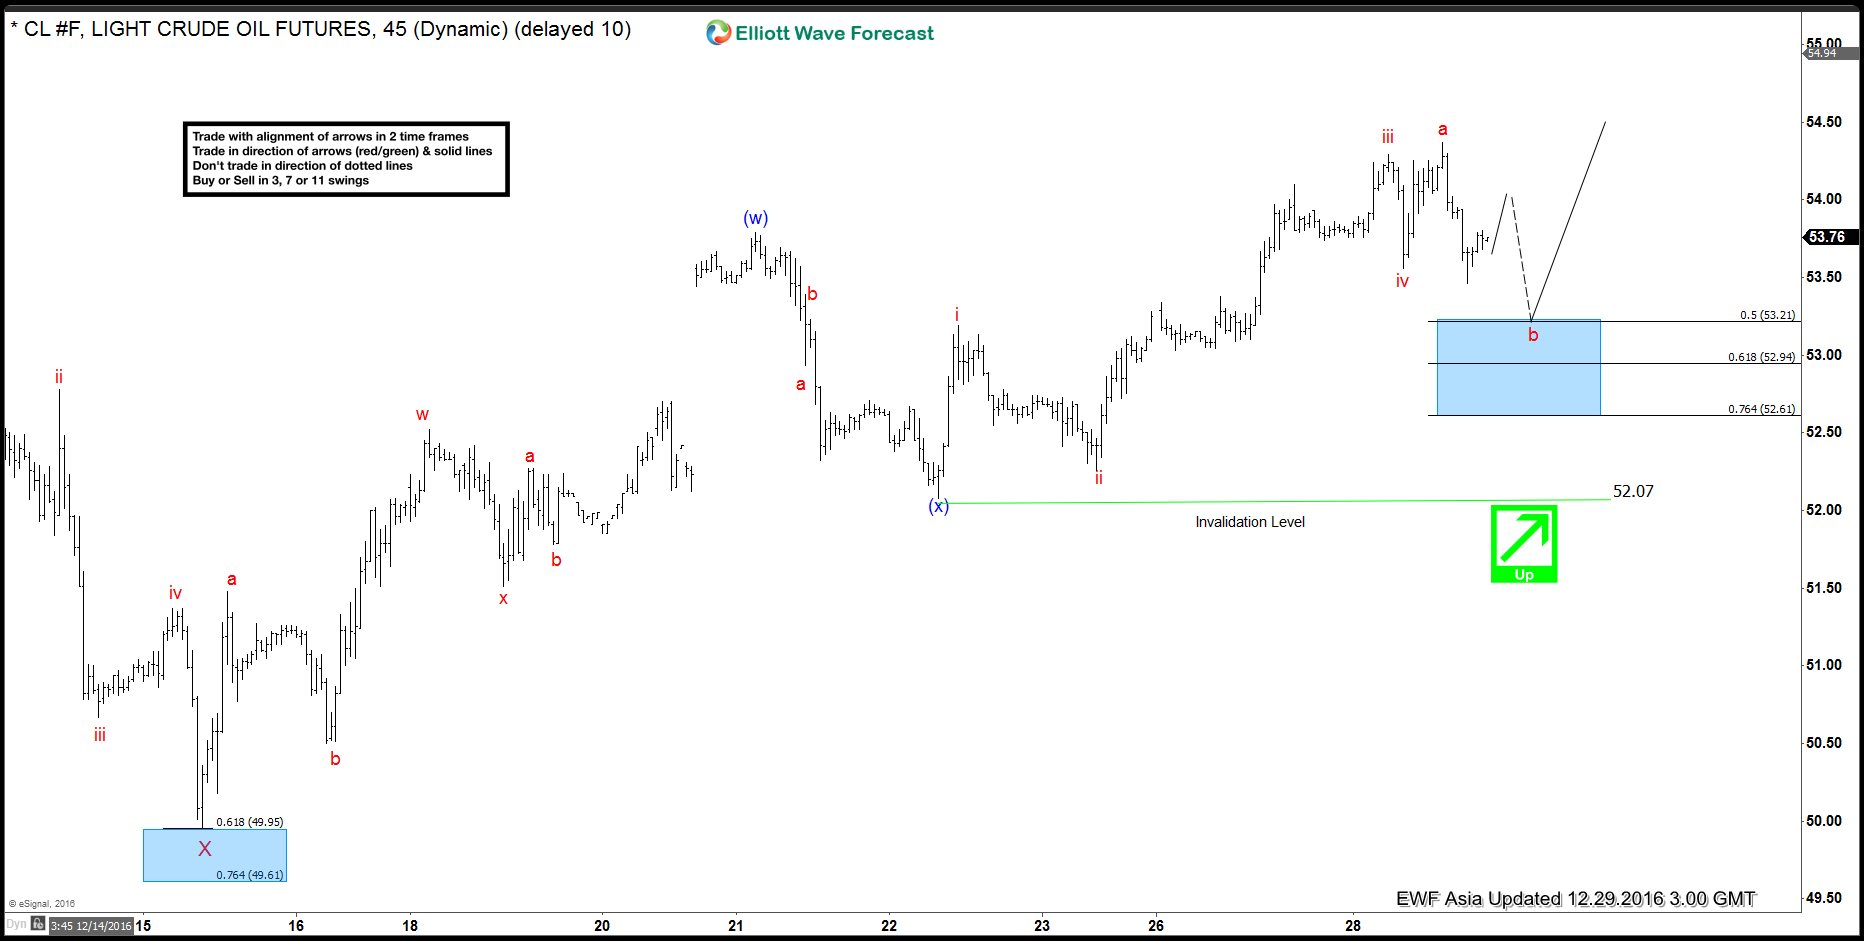
CL_F Elliott Wave Forecast 12.29.2016
Read MoreCL_F (Oil) is showing an incomplete 5 swing sequence from 2/8 low ($26.02), favoring for more upside. The latest rally up from 11/14 low ($42.2) is proposed to be unfolding as a triple three where wave W ended at $49.2, wave X ended at $44.82, wave Y ended at $54.51, and second wave X ended […]
-

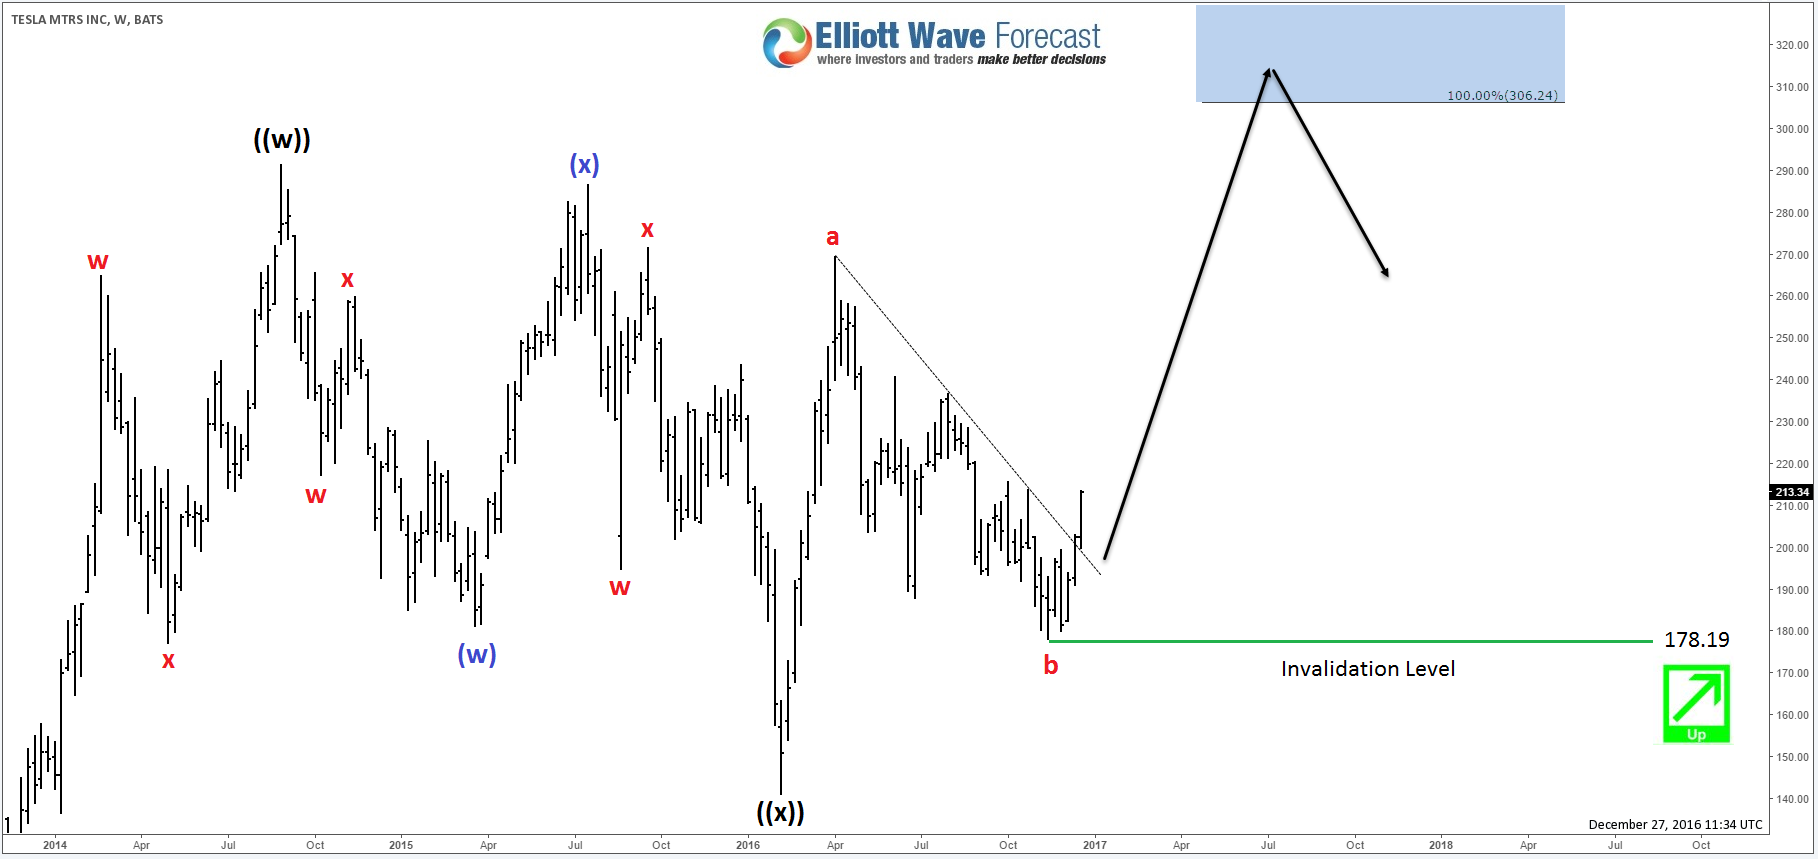
Do you want Tesla shares (TSLA) in your Portfolio ?
Read MoreTesla Motors is an American automaker and energy storage specializing in electric cars and battery charging equipment . Its chairman Elon Musk who’s also CEO of SpaceX and Co-Founder of SolarCity , has said that he visualize Tesla Motors as a technology company and independent automaker, aimed at offering electric cars at prices affordable to the average consumer. […]
-

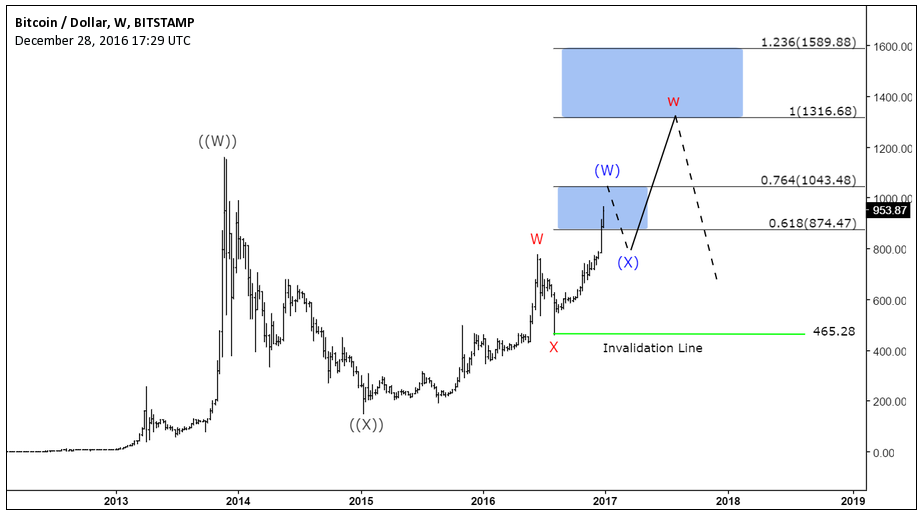
Bitcoin Performance in 2016 – Elliott Wave Analysis
Read MoreAnother year is almost over. What an interesting year it has been. Two major and rather unexpected geopolitical developments: Brexit and the election of Donald Trump, are not able to halt the march of the world indices. The American Indices in particular manage to rally to all-time high. With only a few trading days left in […]
-

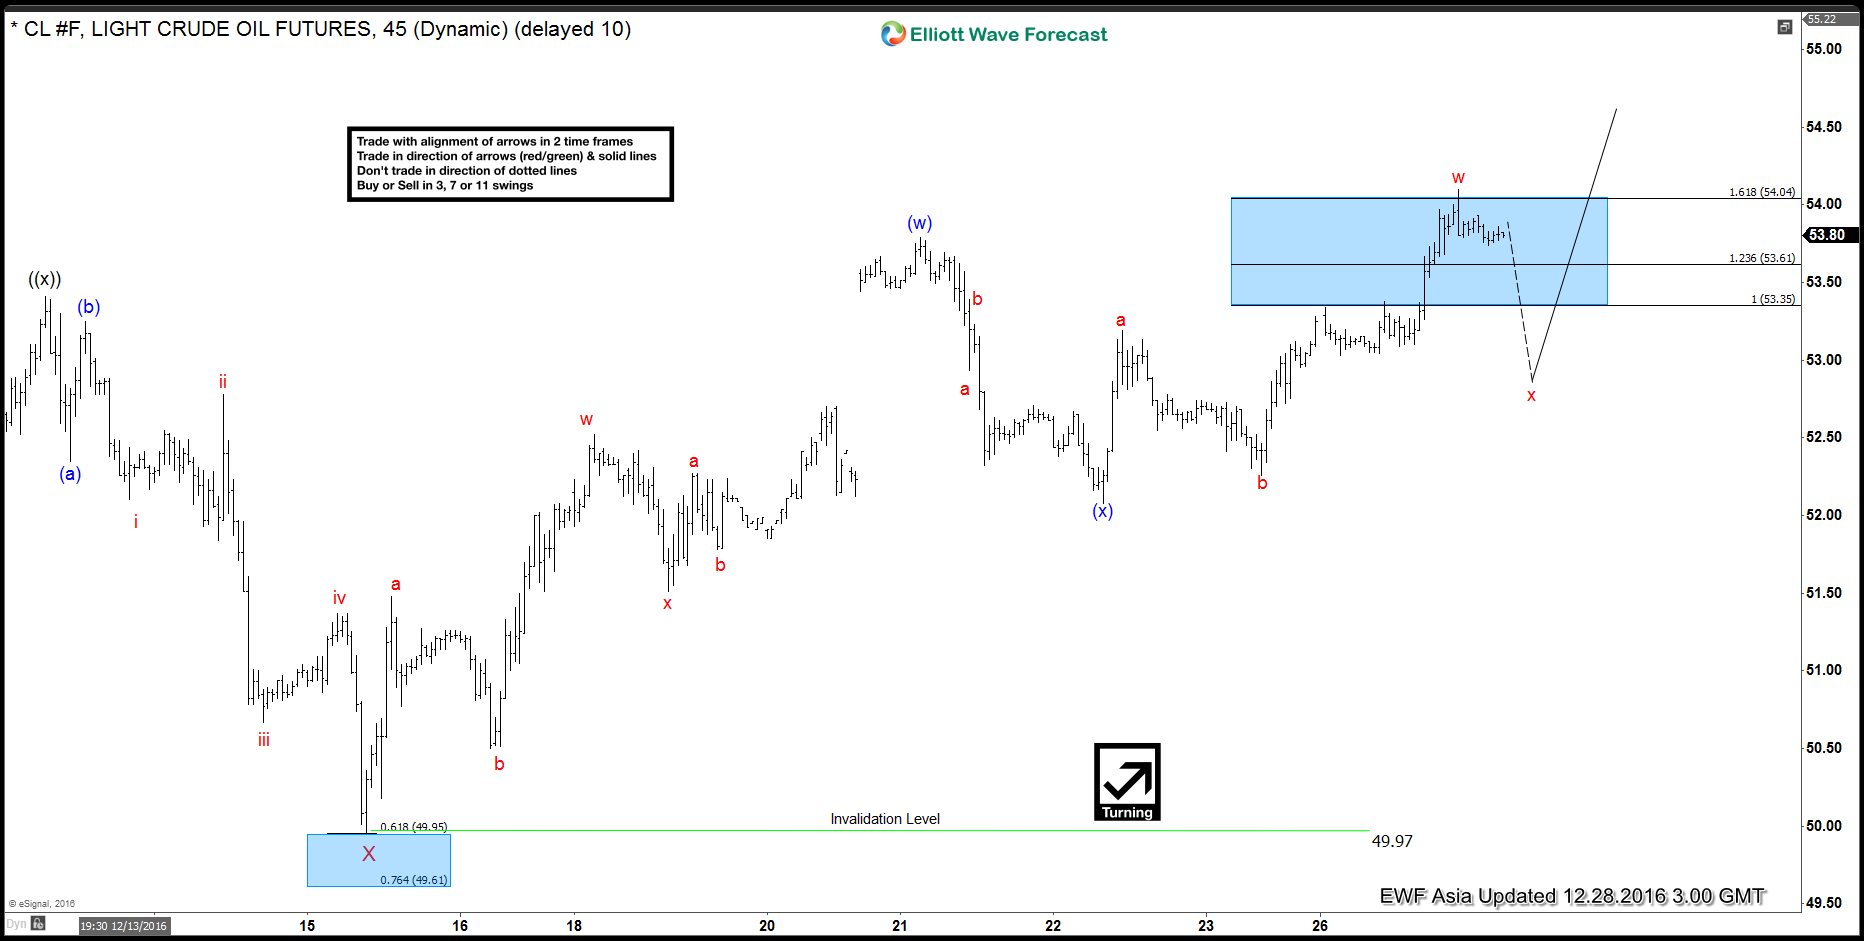
CL_F Elliott Wave Forecast 12.28.2016
Read MoreCL_F (Oil) is showing an incomplete 5 swing sequence from 2/8 low ($26.02), favoring for more upside. The latest rally up from 11/14 low ($42.2) is proposed to be unfolding as a triple three where wave W ended at $49.2, wave X ended at $44.82, wave Y ended at $54.51, and second wave X ended […]