
The Power of 3-7-11 and the Grand Super Cycle: How We Saw the Bullish Turn in April 2025 Back on April 9, 2025, while World Indices were dropping sharply and global sentiment had turned overwhelmingly bearish, we published an article that challenged the fear-driven narrative. We explained why selling was not the right approach and […]
-

Bitcoin ( BTCUSD ) Warning Stage
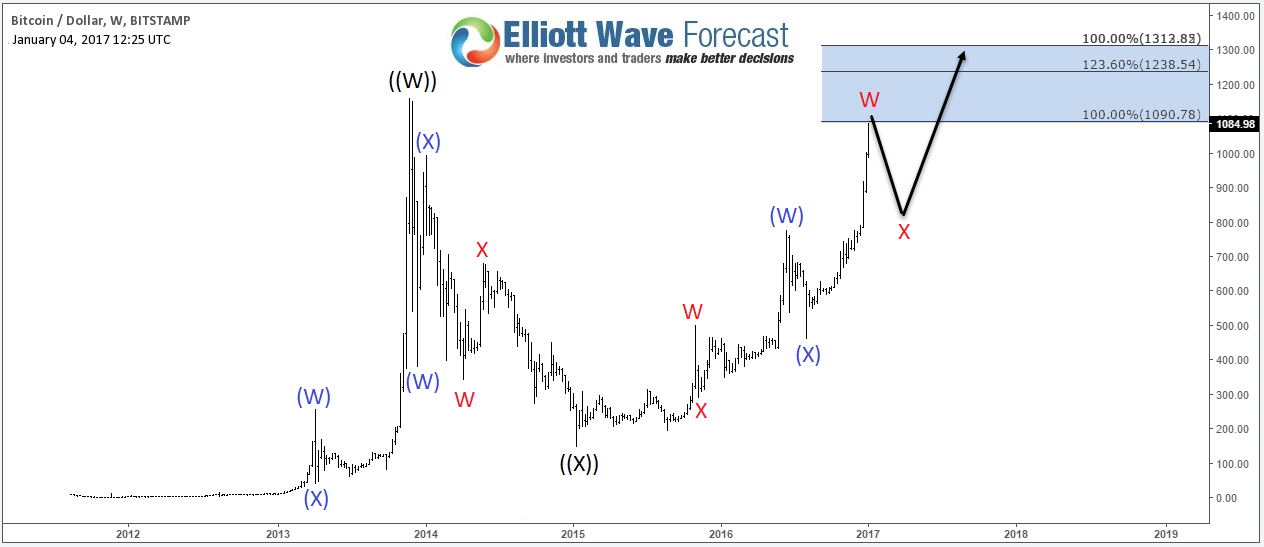
Read MoreBitcoin Review Last year , Bitcoin was still considered as a fading project and many expected its price to keep dropping and break below $100. However in the recent months, the crypto-currency kept rising significantly and finally managed to make new all time high and break above $1200 last week ! That’s only $50 short of the equivalence to 1 […]
-

EURUSD: Euro area elections may limit strength
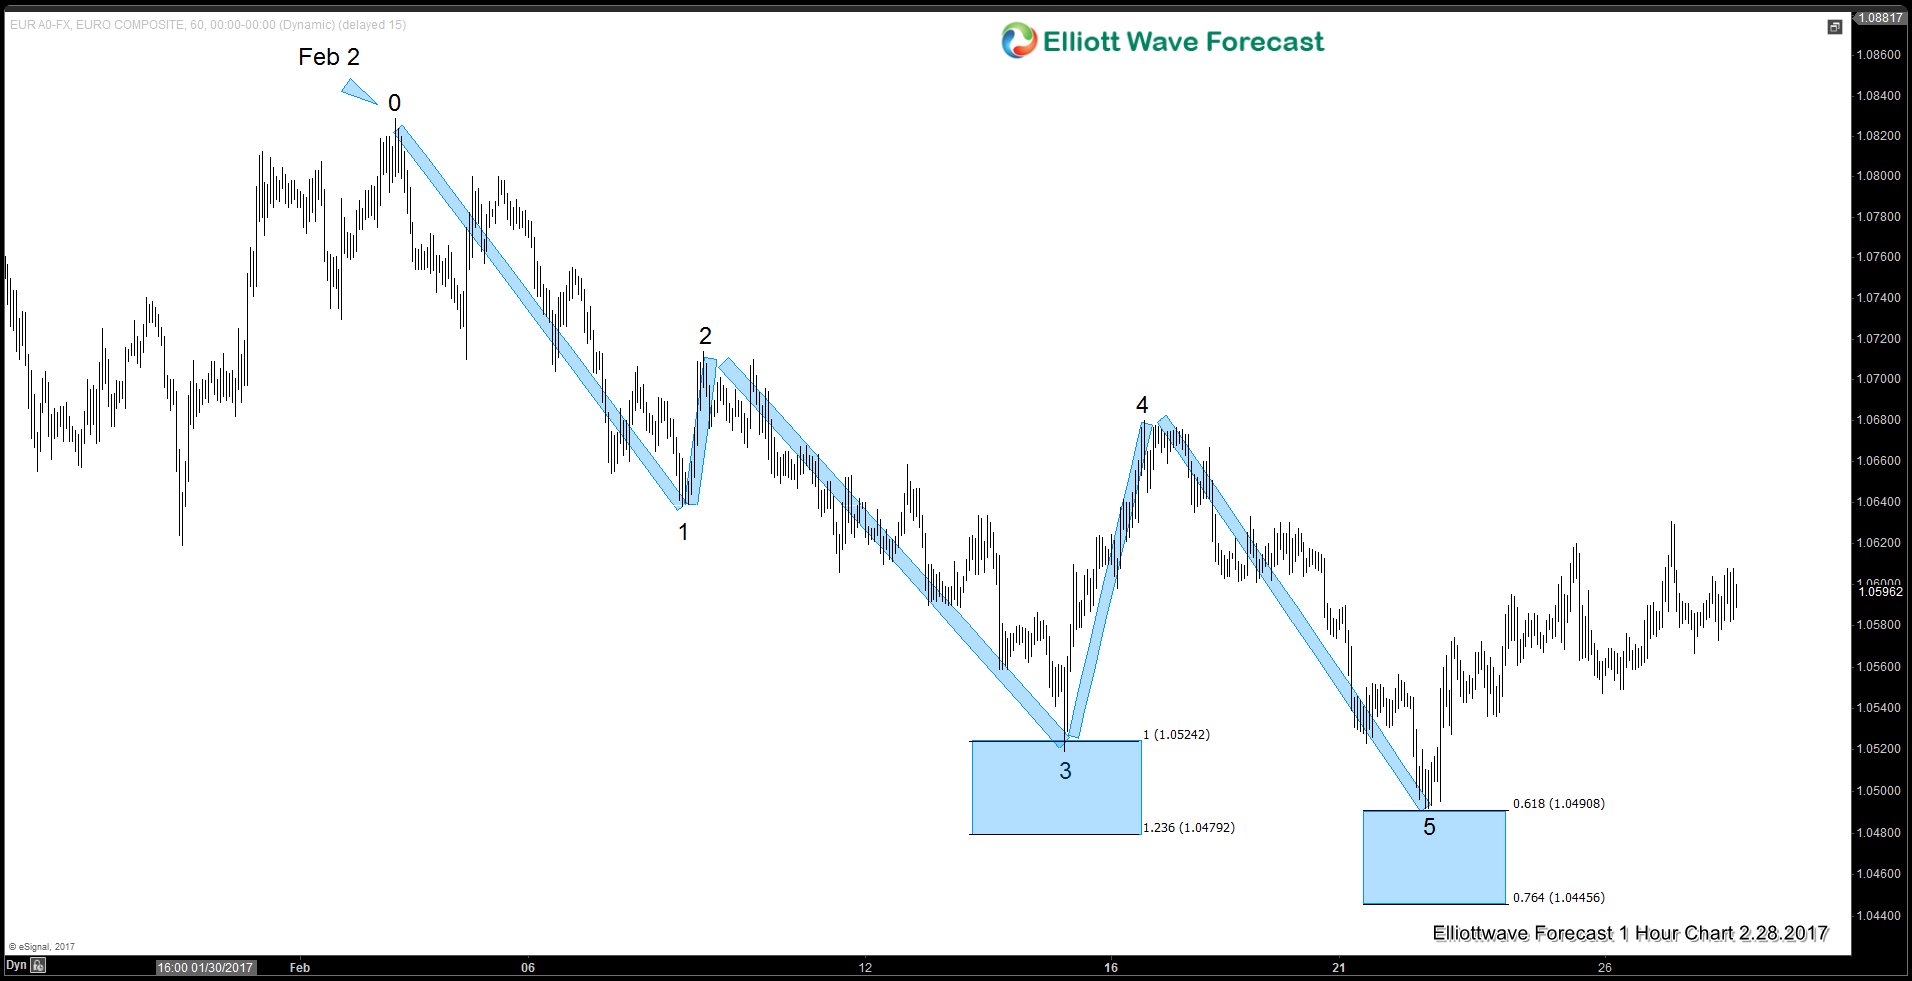
Read MoreThe Euro dollar (EURUSD) has been trading sideways since March 2015 before breaking into a new low in late December 2016. The single currency remains heavy technically and the underlying political and economic risks in the Euro-area in 2017 could provide a cap for any strength in the currency. The Euro zone has survived various crises […]
-

USDSEK Intraday Elliott Wave View
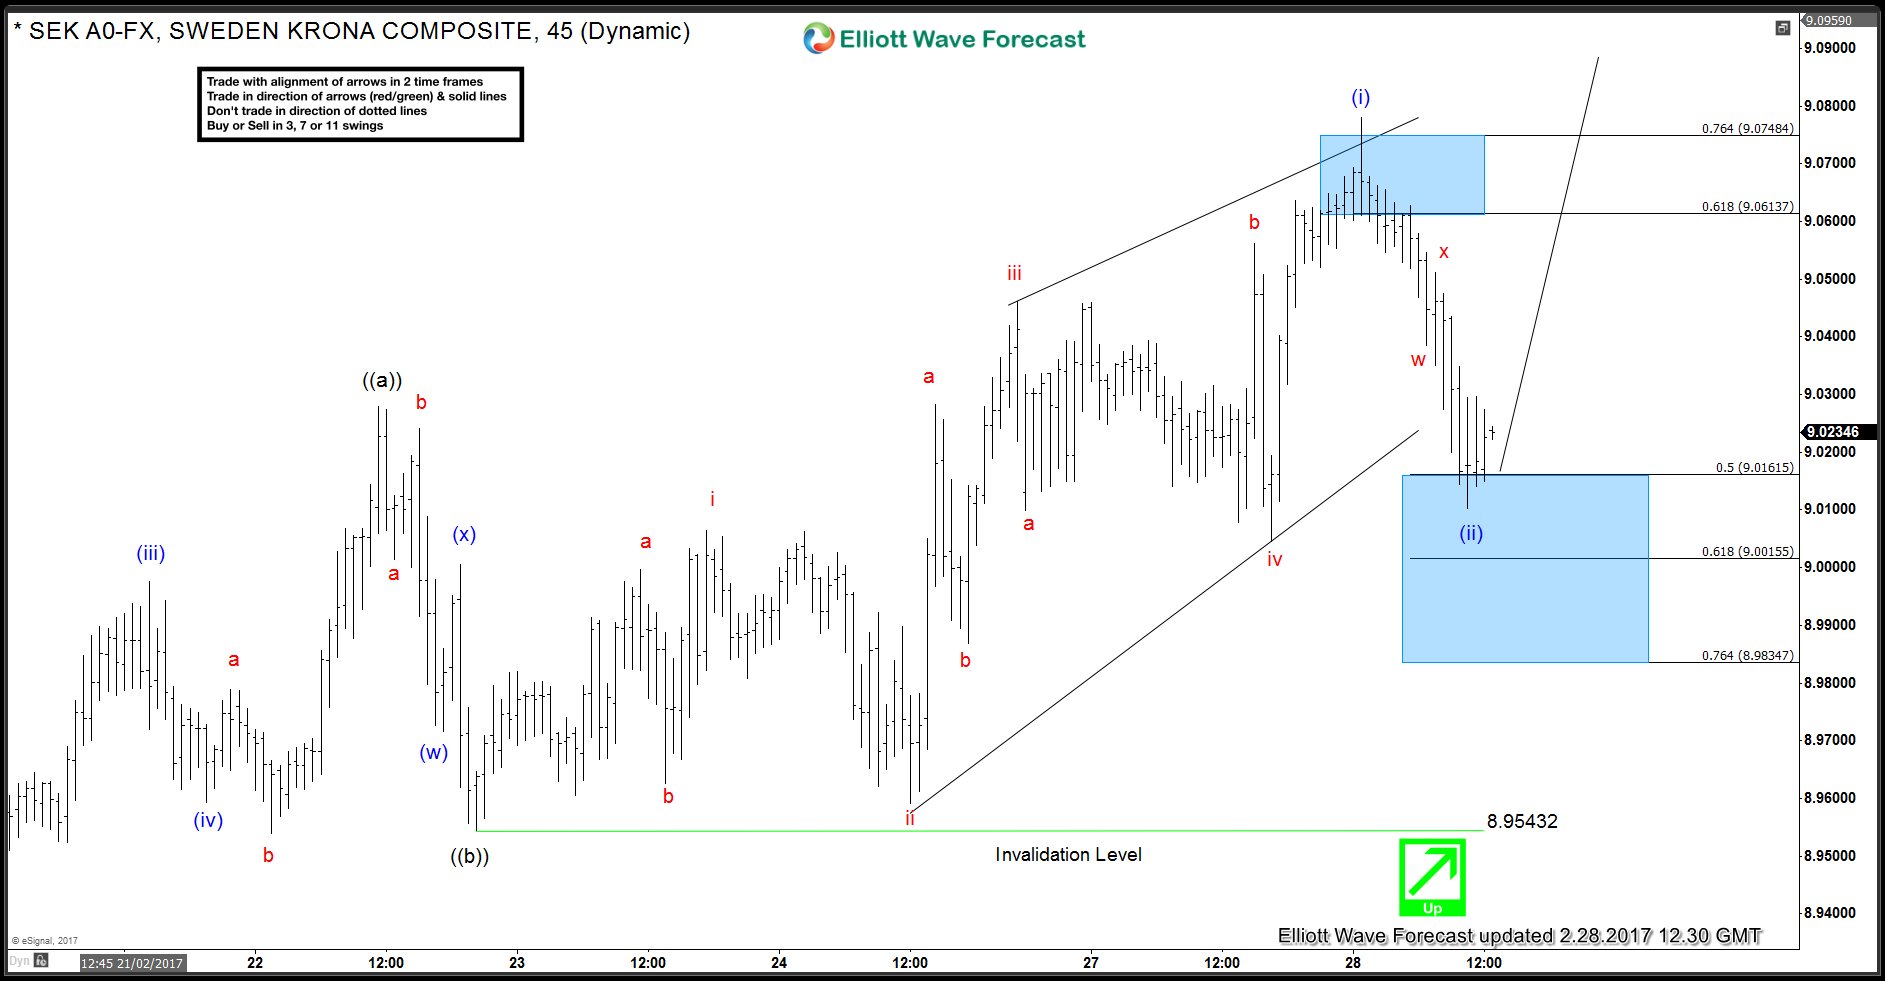
Read MoreUSDSEK move up from 2/22/2017 (8.9543) low could be viewed as 5 swings and hence we are labelling it as a leading diagonal Elliott Wave structure in wave (i). In the 2/28/2017 Asian update, we were expecting the pair to complete wave (i) and make a pull back in wave (ii) which would be a correction […]
-

SPX Elliottwave view: Ending Wave 3 soon
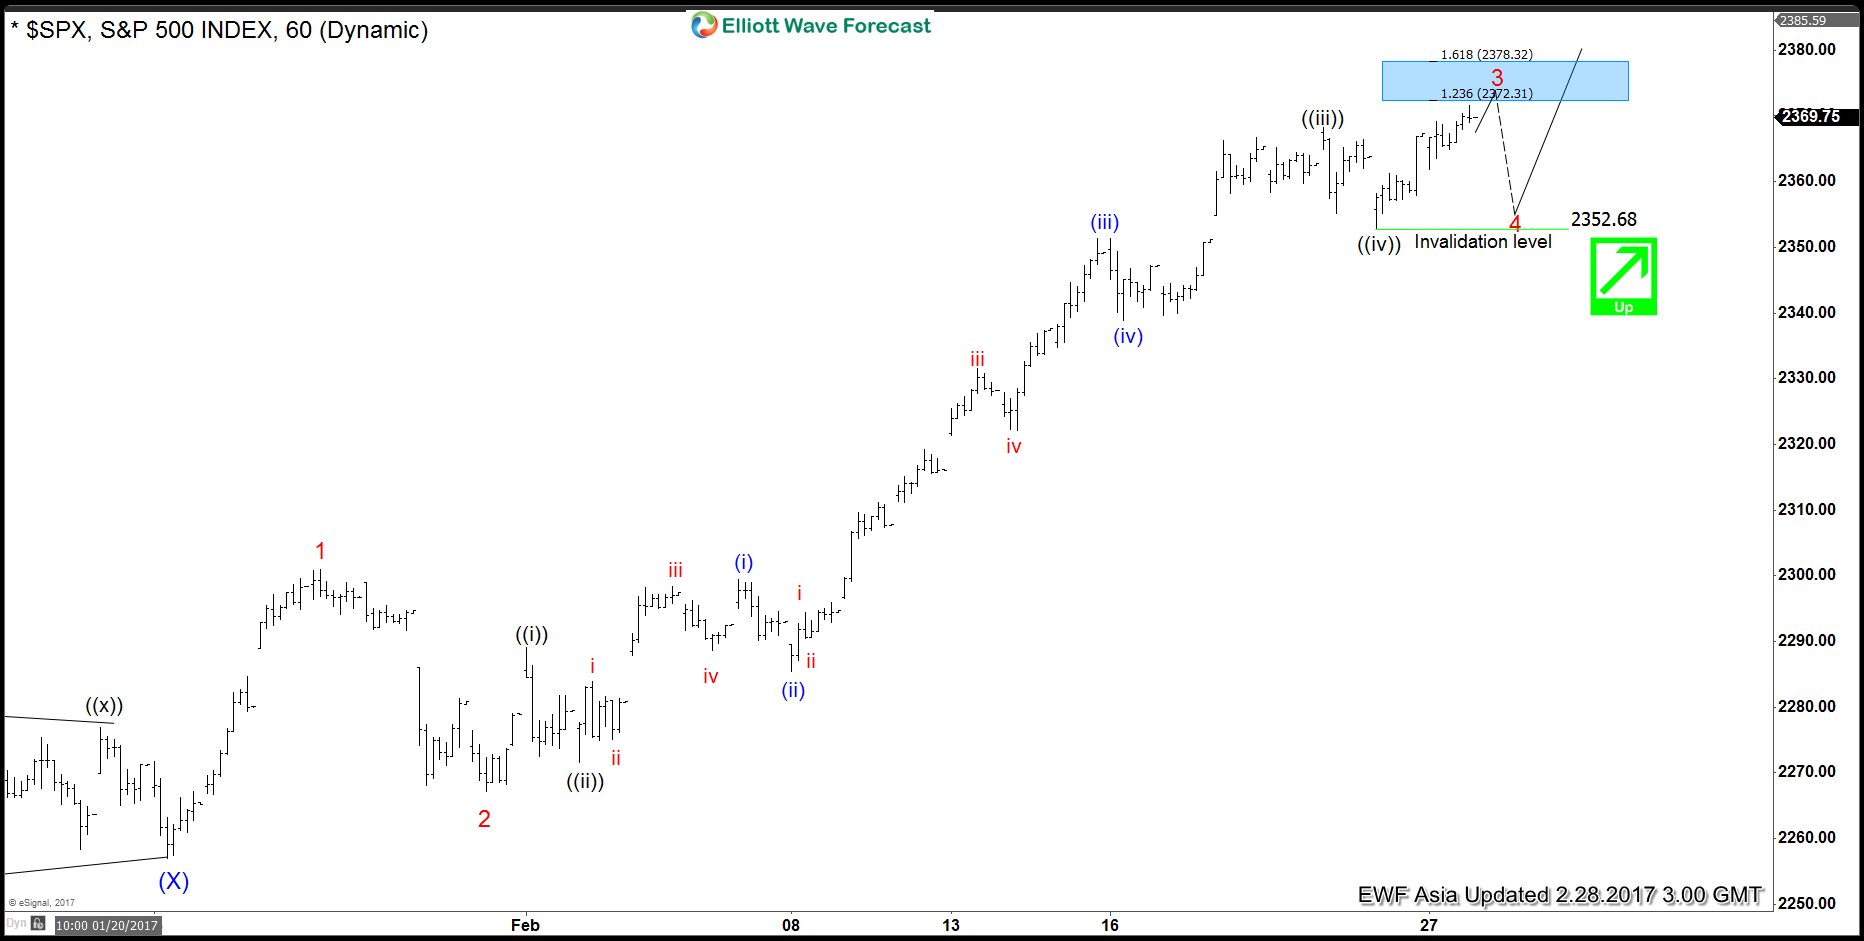
Read MoreShort term Elliott wave view in SPX suggests that the rally from 1/23 low is unfolding as a 5 waves Elliott wave impulse structure where Minor wave 1 ended at 2301, Minor wave 2 ended at 2267.2, and Minor wave 3 remains in progress but close to ending. Internal of Minor wave 3 shows an extension and […]