

The Power of 3-7-11 and the Grand Super Cycle: How We Saw the Bullish Turn in April 2025 Back on April 9, 2025, while World Indices were dropping sharply and global sentiment had turned overwhelmingly bearish, we published an article that challenged the fear-driven narrative. We explained why selling was not the right approach and […]
-
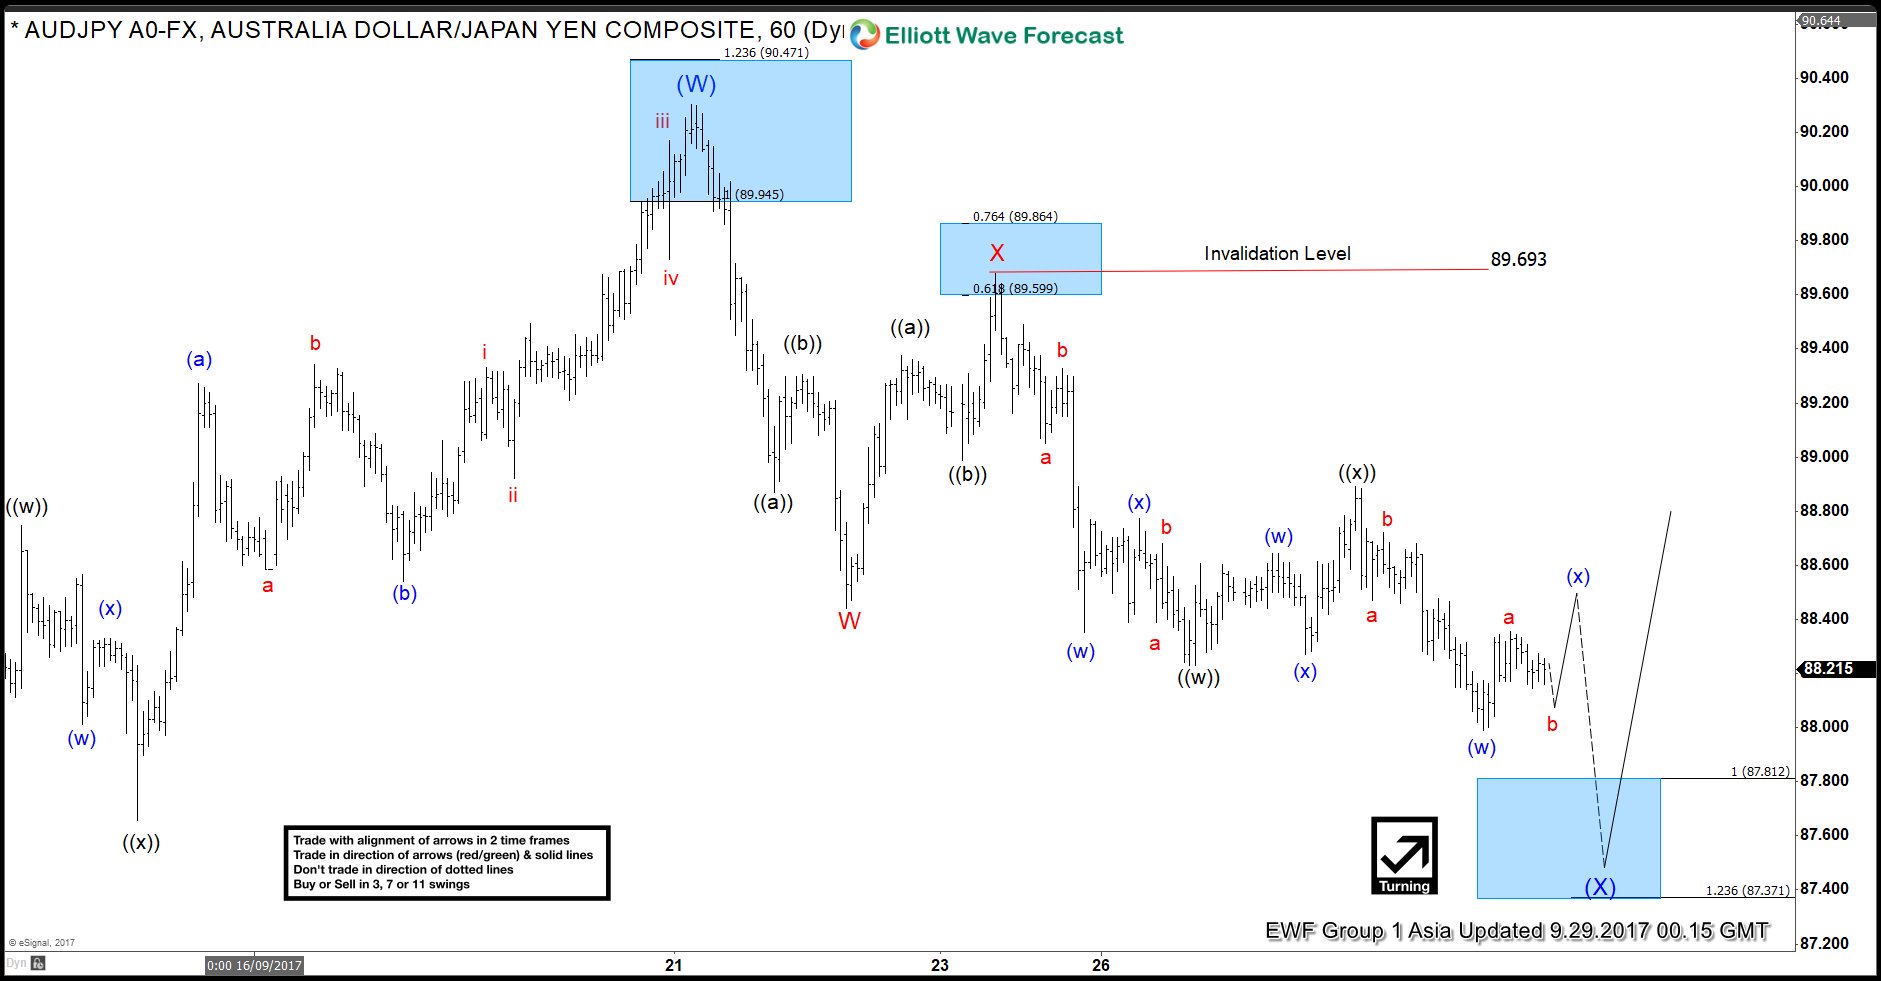
AUDJPY Elliott Wave Analysis 9.29.2017
Read MoreAUDJPY Short Term Elliott Wave view suggests that the rally to 90.31 ended Intermediate wave (W). Intermediate wave (X) pullback remains in progress as a double three Elliott Wave structure. Down from 90.31, Minor wave W ended at 88.44 and Minor wave X ended at 89.68. Minor wave Y is unfolding also as a double three Elliott Wave structure. […]
-
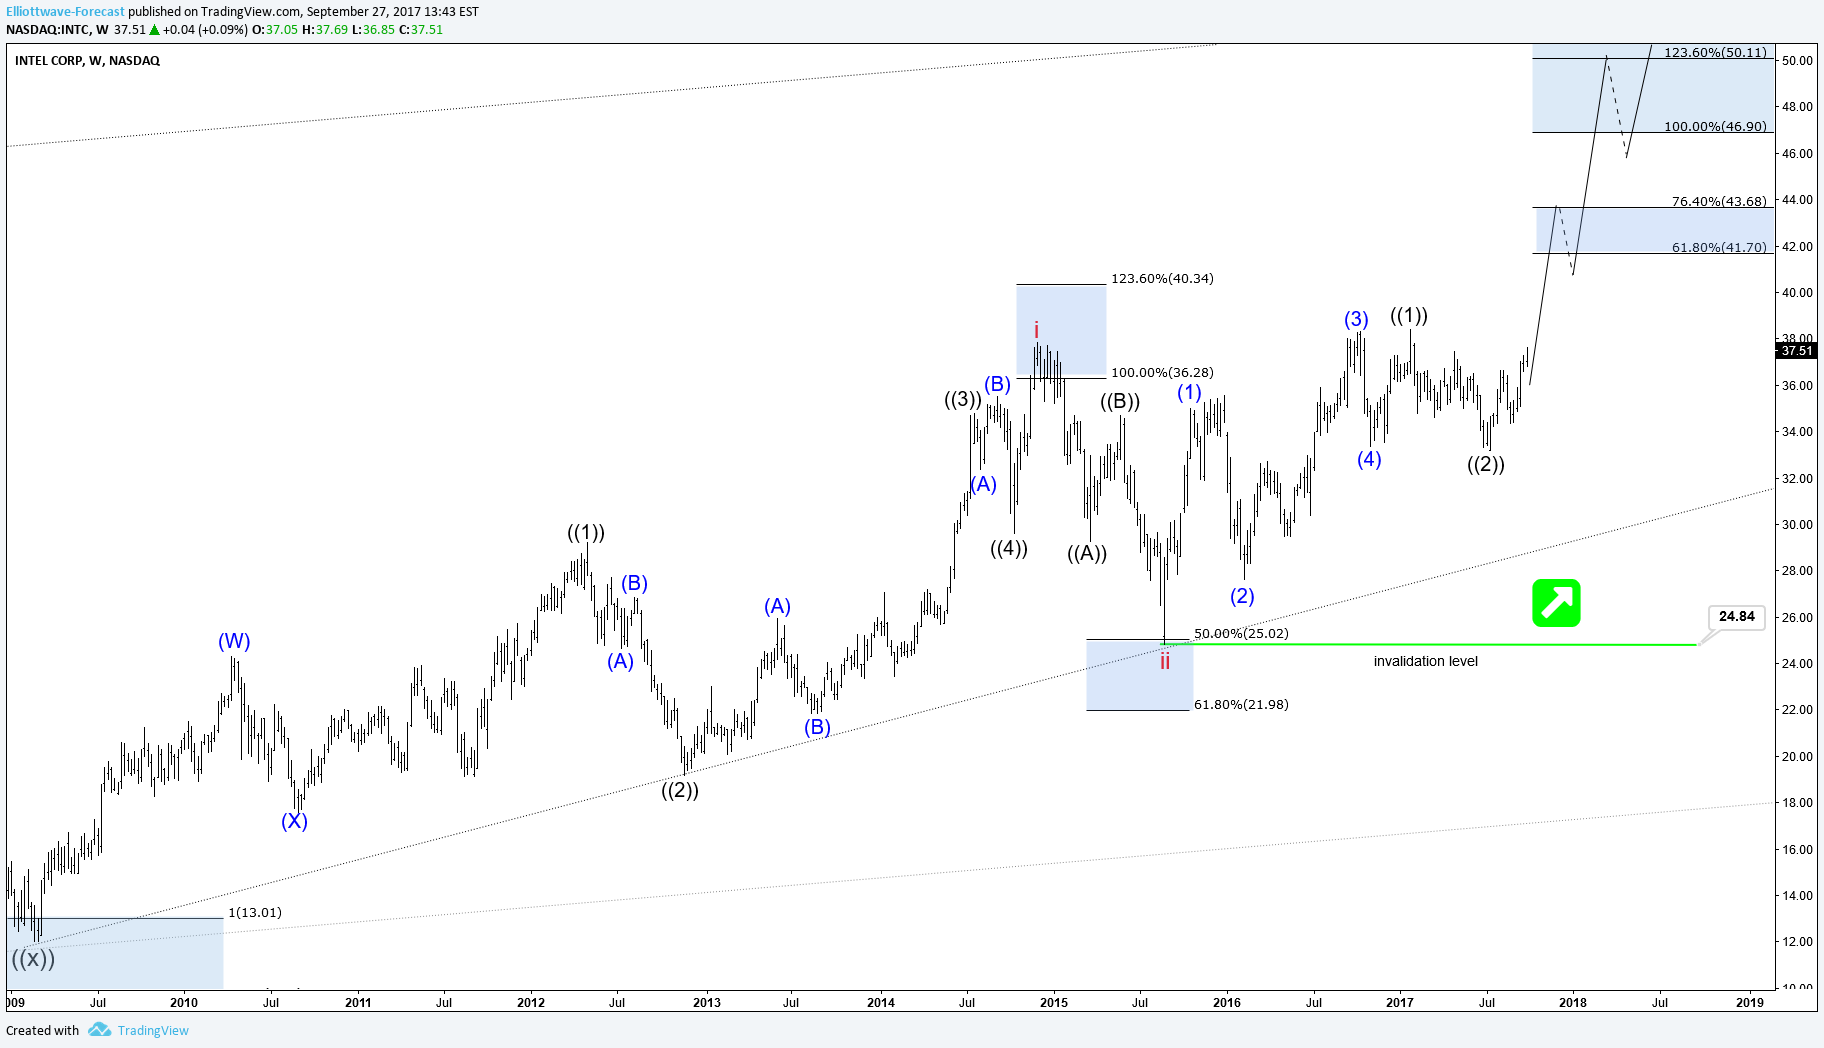
INTC INTEL Corporation Expected to Extend Higher
Read MoreThe INTC INTEL Corporation: The INTC INTEL Stock has the scope to extend higher as we can see in the monthly and weekly charts. Based on the proprietary tools ElliottWave-Forecast.com has implemented we will analyze below the INTC Stock in the Weekly time frame based 2 degrees. Swing Sequence Elliott Wave Structure Basic information about the Intel Corporation: […]
-

Elliott Wave Analysis : AUDJPY Correction Near Complete
Read MoreAUDJPY Short Term Elliott Wave view suggests that the rally to 90.31 ended Intermediate wave (W). Intermediate wave (X) pullback remains in progress as a double three Elliott Wave structure. Down from 90.31, Minor wave W ended at 88.44 and Minor wave X ended at 89.68. Minor wave Y is unfolding also as a double three Elliott Wave structure. […]
-
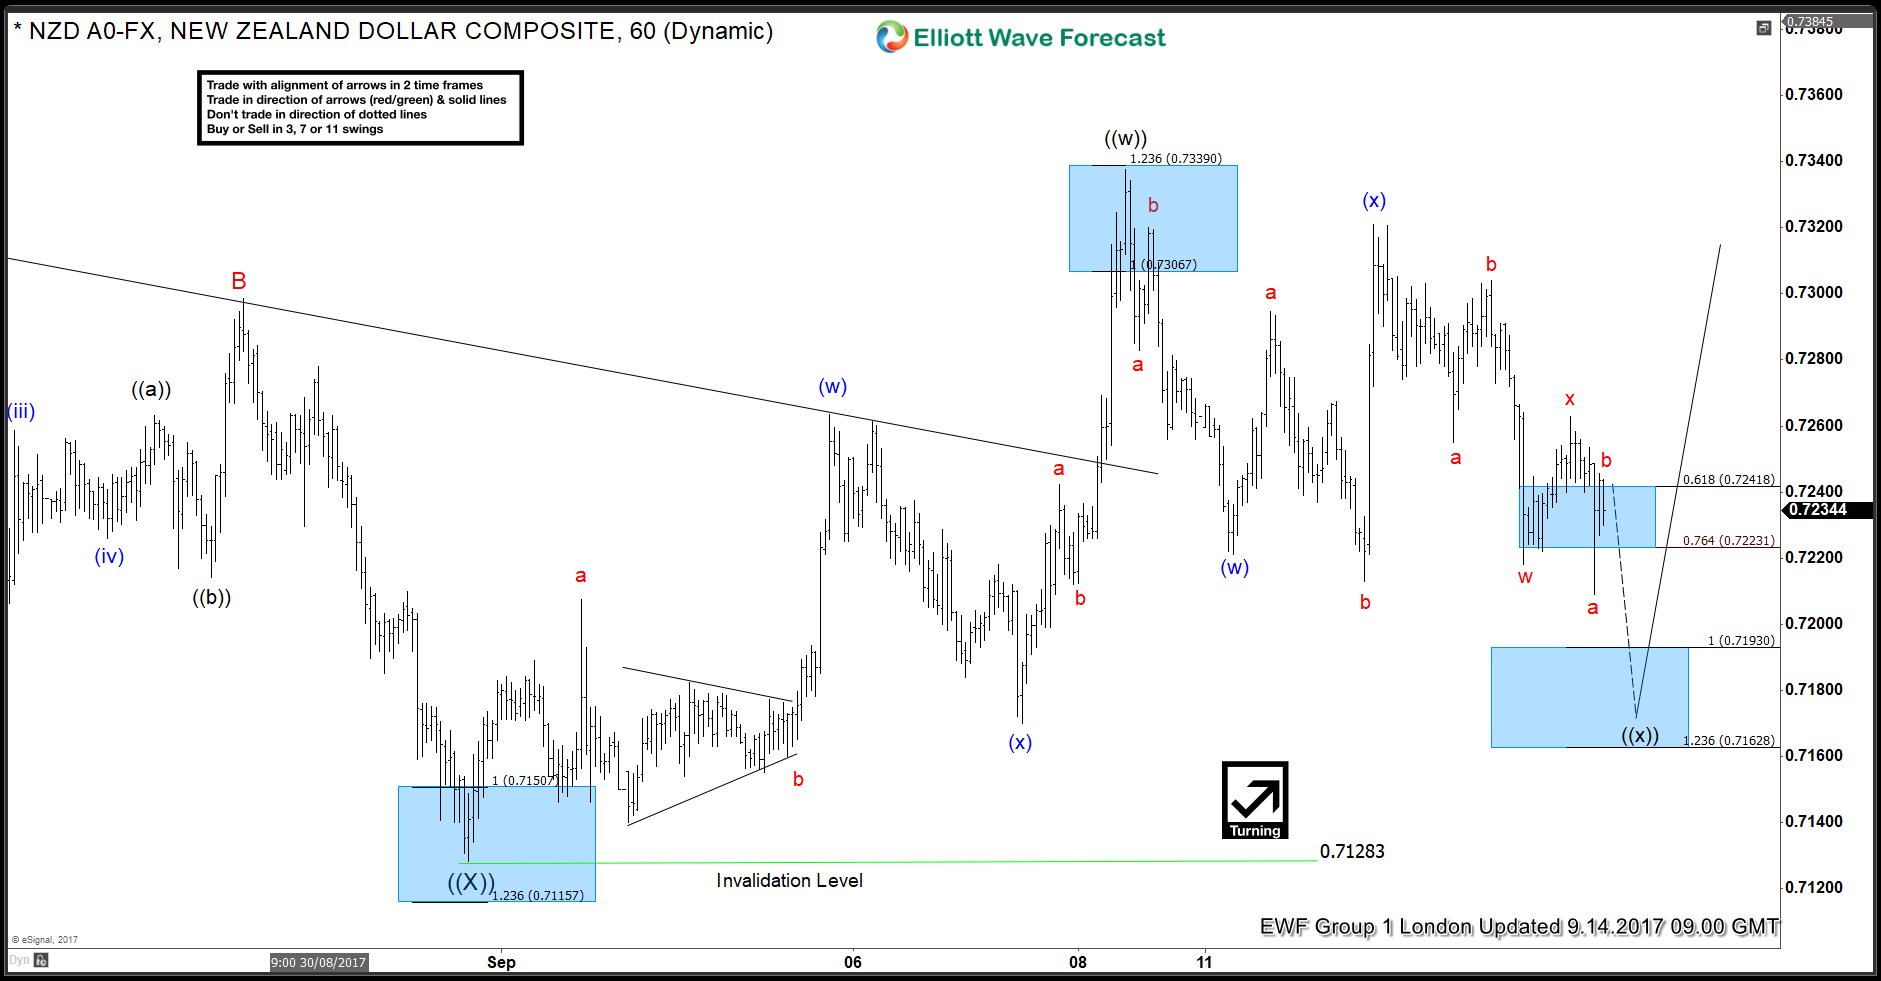
NZDUSD forecasting the path and buying short term dips
Read MoreHello fellow traders. In this technical blog we’re going to take a quick look at the past Elliott Wave charts of NZDUSD published in members area of www.elliottwave-forecast.com. In further text we’re going to count the swings, explain the Elliott Wave view and trading strategy. NZDUSD Elliott Wave 1 Hour Chart 09.14.2017 Back then we were […]