
The Power of 3-7-11 and the Grand Super Cycle: How We Saw the Bullish Turn in April 2025 Back on April 9, 2025, while World Indices were dropping sharply and global sentiment had turned overwhelmingly bearish, we published an article that challenged the fear-driven narrative. We explained why selling was not the right approach and […]
-

Will Trump Really “Totally Destroy” North Korea?
Read MoreUS President, Donald Trump, threatened to “Totally Destroy” North Korea during his speech in United Nations assembly on 19th September 2017 and further added that “Rocket Man” is on a suicide mission for himself and for his regime. “The US has great strength and patience,” Trump said. But he added: “If it is forced to defend […]
-

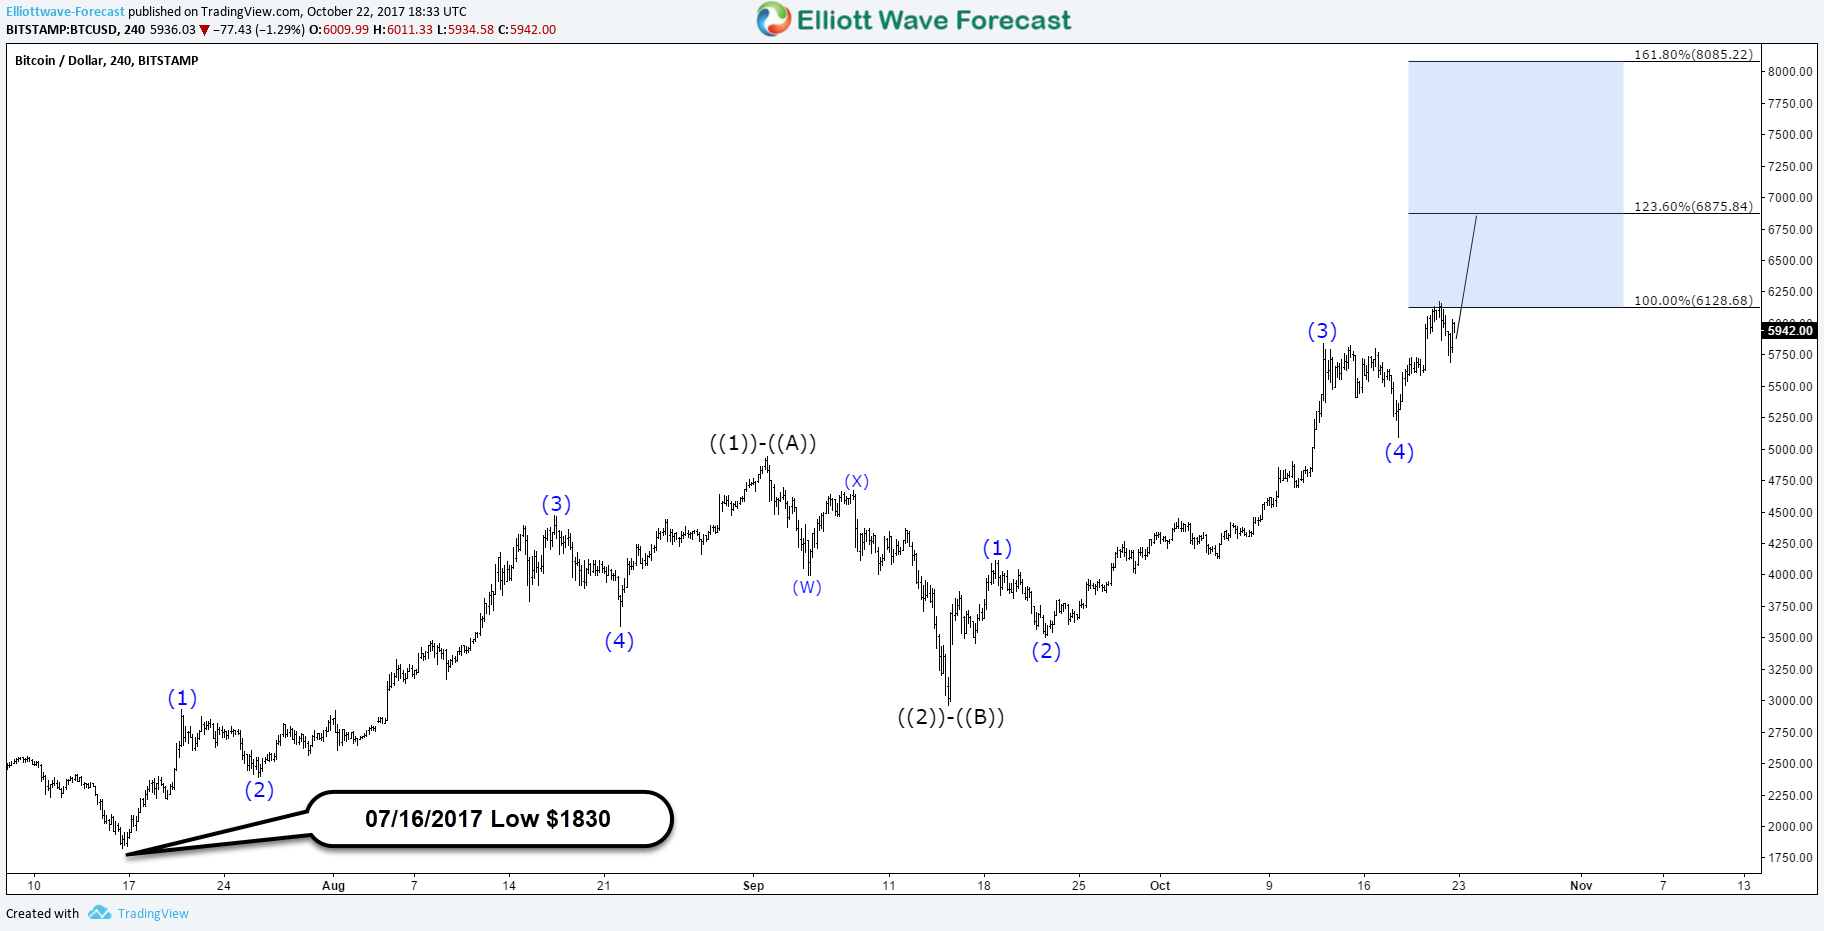
Why Bitcoin can pullback from $6100 – $6800?
Read MoreBitcoin continue it’s outstanding performance as it managed to breach the $6000 barrier this weekend, it currently up 200% from 07/16 low and with a total of 500% for this year. The rally from $1830 low is represented by 3 swings subdivided into 5 waves rally then 3 waves pullback followed by another 5 waves. This type of move […]
-

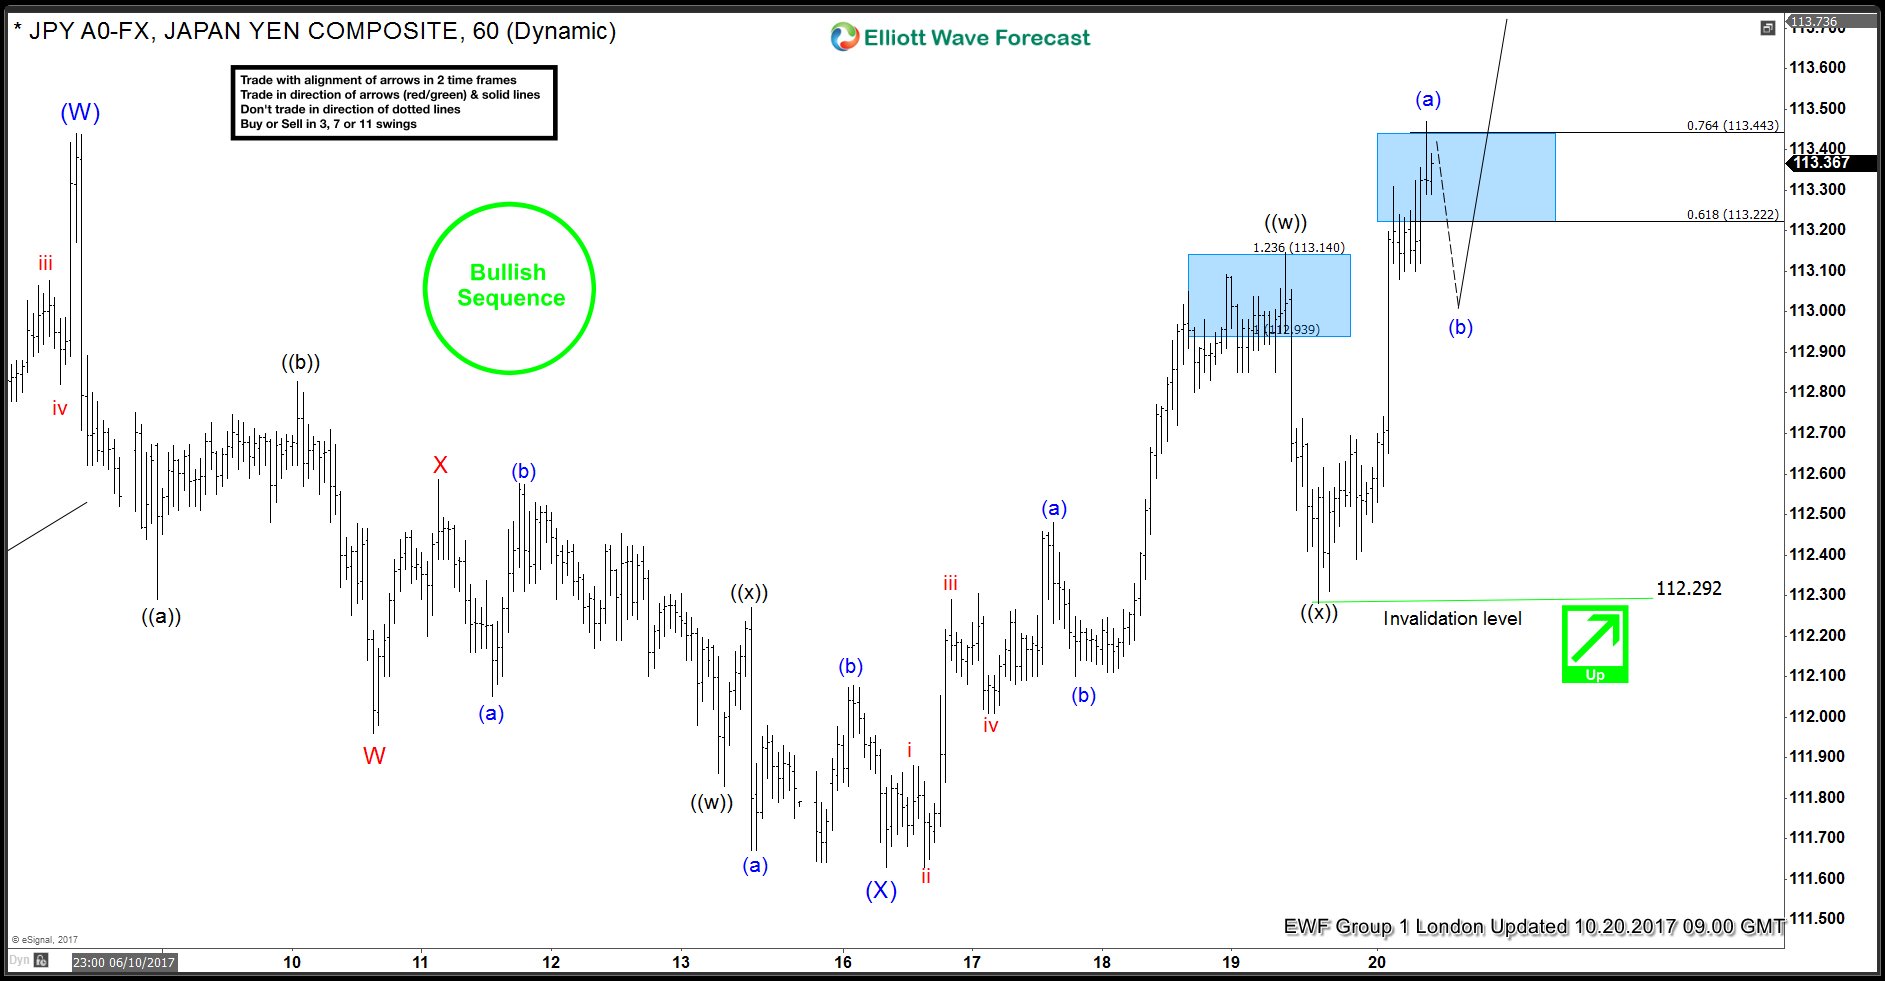
USDJPY Elliott Wave View 10.20.2017
Read MoreUSDJPY Short term Elliott Wave view suggest that the decline to 111.61 ended intermediate wave (X) on October 16 low. Up from there intermediate wave (Y) is in progress as a double three Elliott wave Structure and pair has managed to break the 10/06 peak (113.43) suggesting that next extension higher has started. The cycle from […]
-

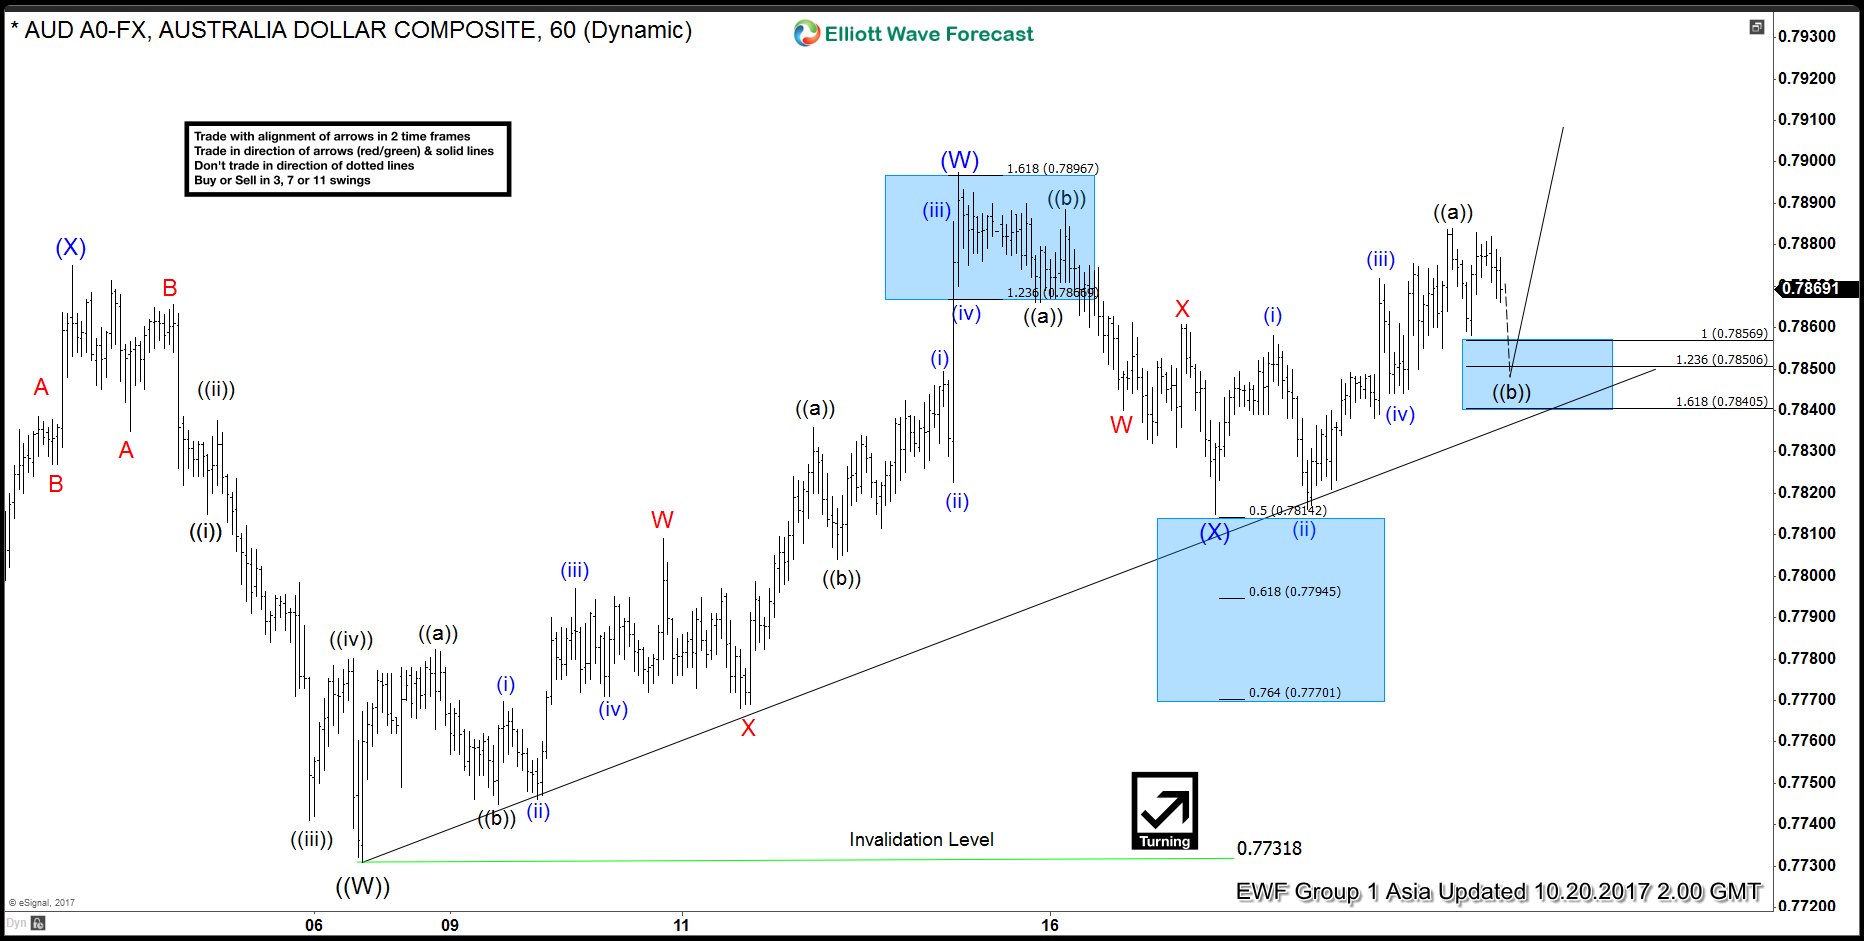
AUDUSD Short Term Elliott Wave Analysis 10.20.2017
Read MoreAUDUSD Short Term Elliott Wave view suggests that the decline to 0.7731 ended Primary wave ((W)) on October 6th low. Primary wave ((X)) is currently in progress as a double three Elliott Wave structure. Up from 0.7731, Intermediate Wave (W) of ((X)) ended at 0.7807 and decline to 0.7815 ended Intermediate wave (X) of ((X)). […]