

The Power of 3-7-11 and the Grand Super Cycle: How We Saw the Bullish Turn in April 2025 Back on April 9, 2025, while World Indices were dropping sharply and global sentiment had turned overwhelmingly bearish, we published an article that challenged the fear-driven narrative. We explained why selling was not the right approach and […]
-
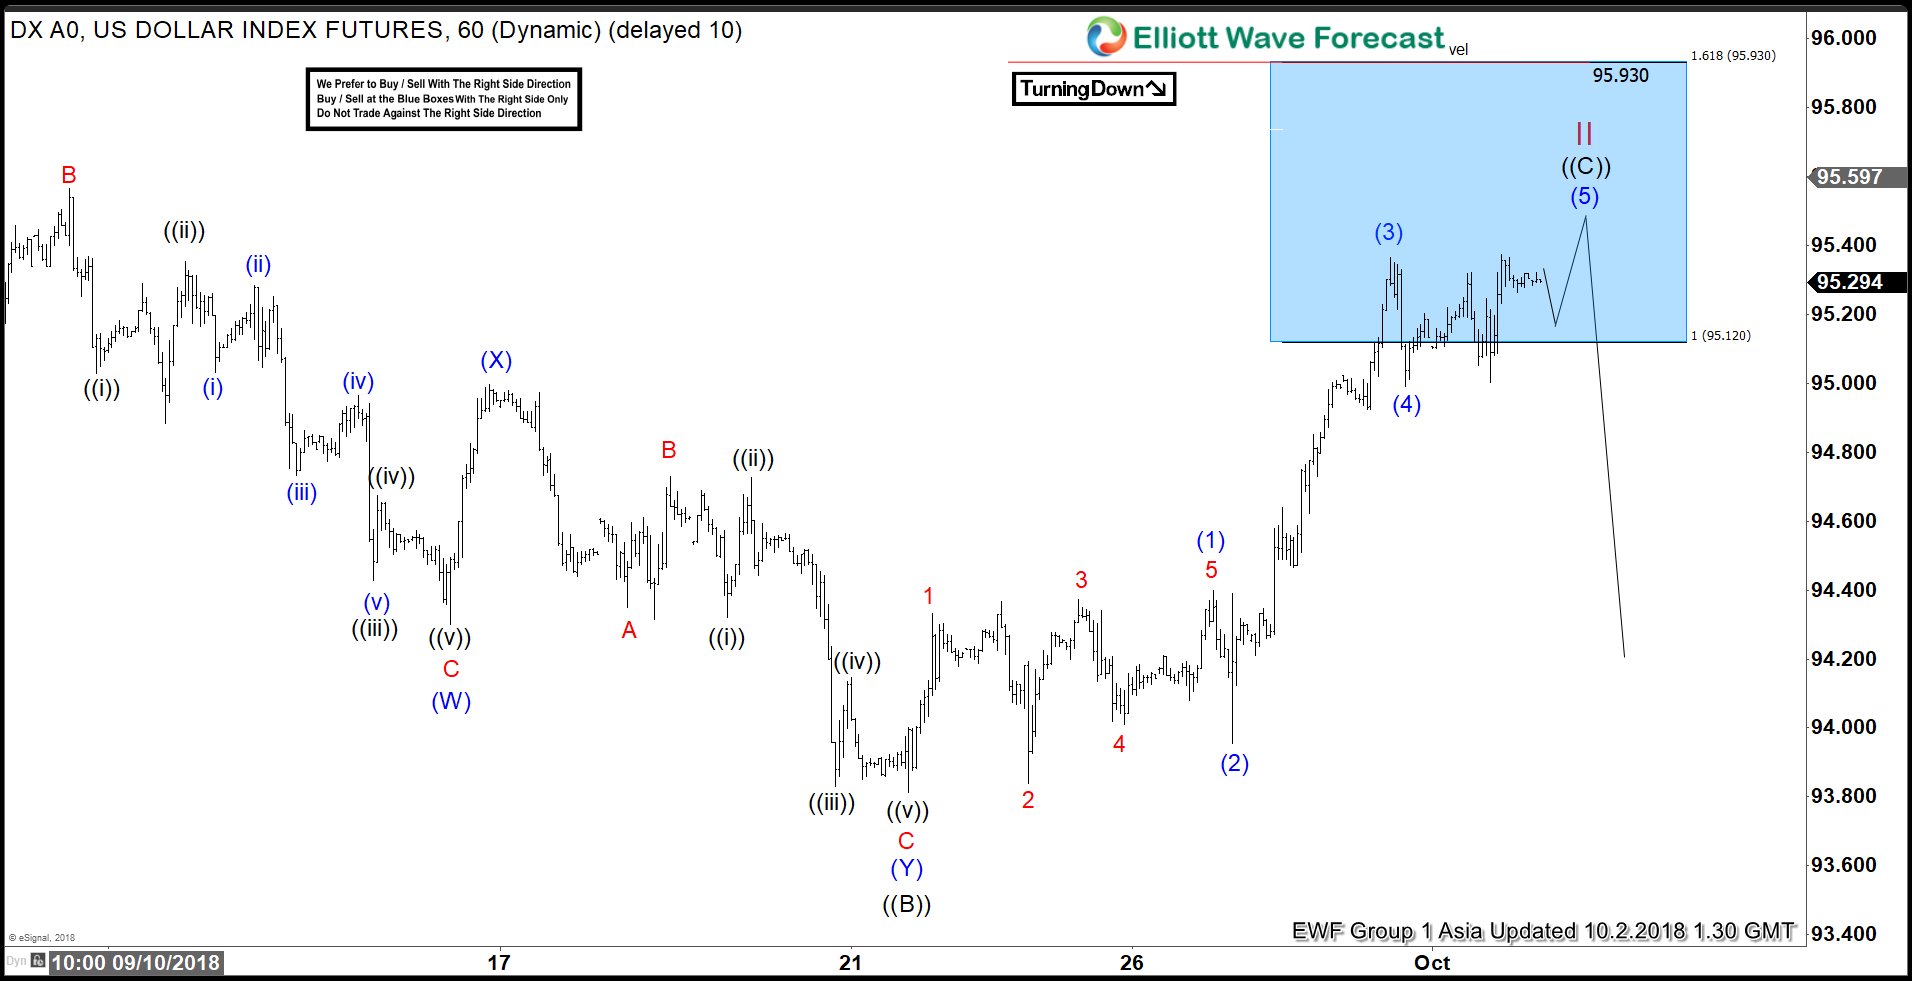
DXY Ending The Elliott Wave Flat Correction
Read MoreDXY short-term Elliott wave view suggests that the index is doing a Flat correction coming from 8/28/2018 low within cycle degree wave II. Meaning that the internal distribution of cycle from that low is showing the sub-division of 3-3-5 wave structure. Where primary wave ((A)) ended in 3 swings at 95.73 on 9/04 peak. Down […]
-
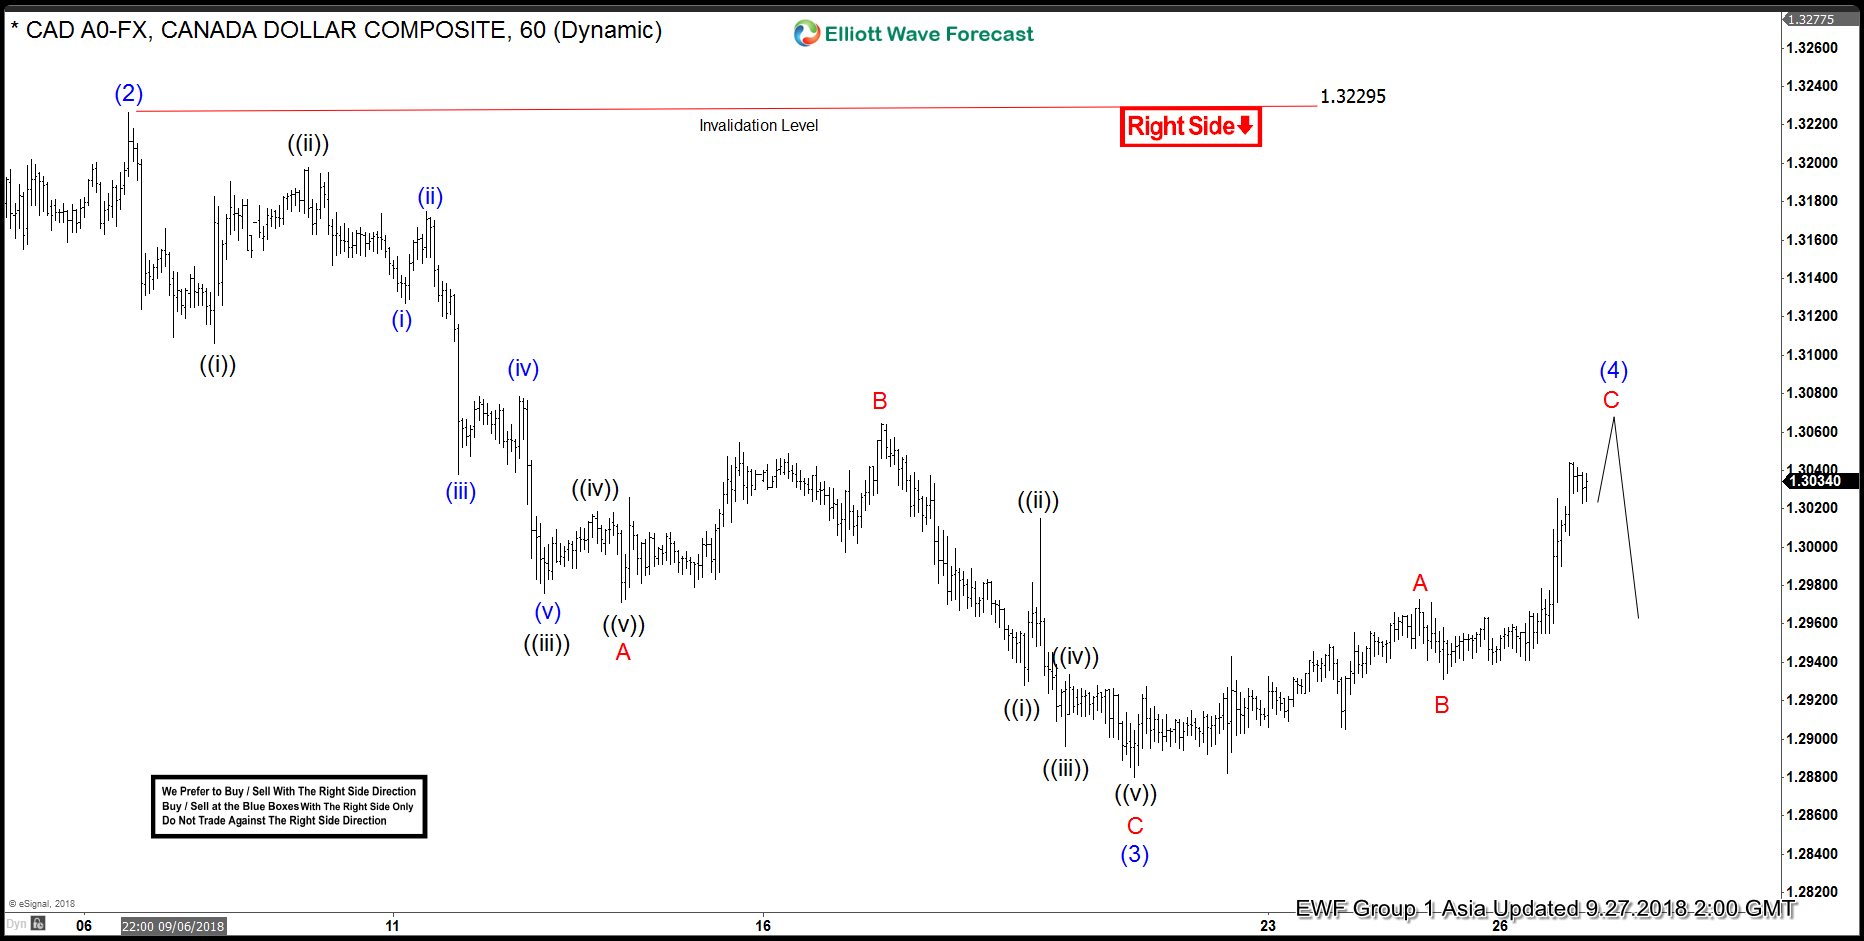
Canadian Dollar Rose after NAFTA agreement
Read MoreLast week, Canadian dollar rose to its strongest since May against US Dollar over speculation that Canada and U.S. will strike a deal on NAFTA. News then come late Sunday that Canada agreed to join the trade deal with the U.S. and Mexico. All three countries plan to sign on the pact which will save NAFTA […]
-
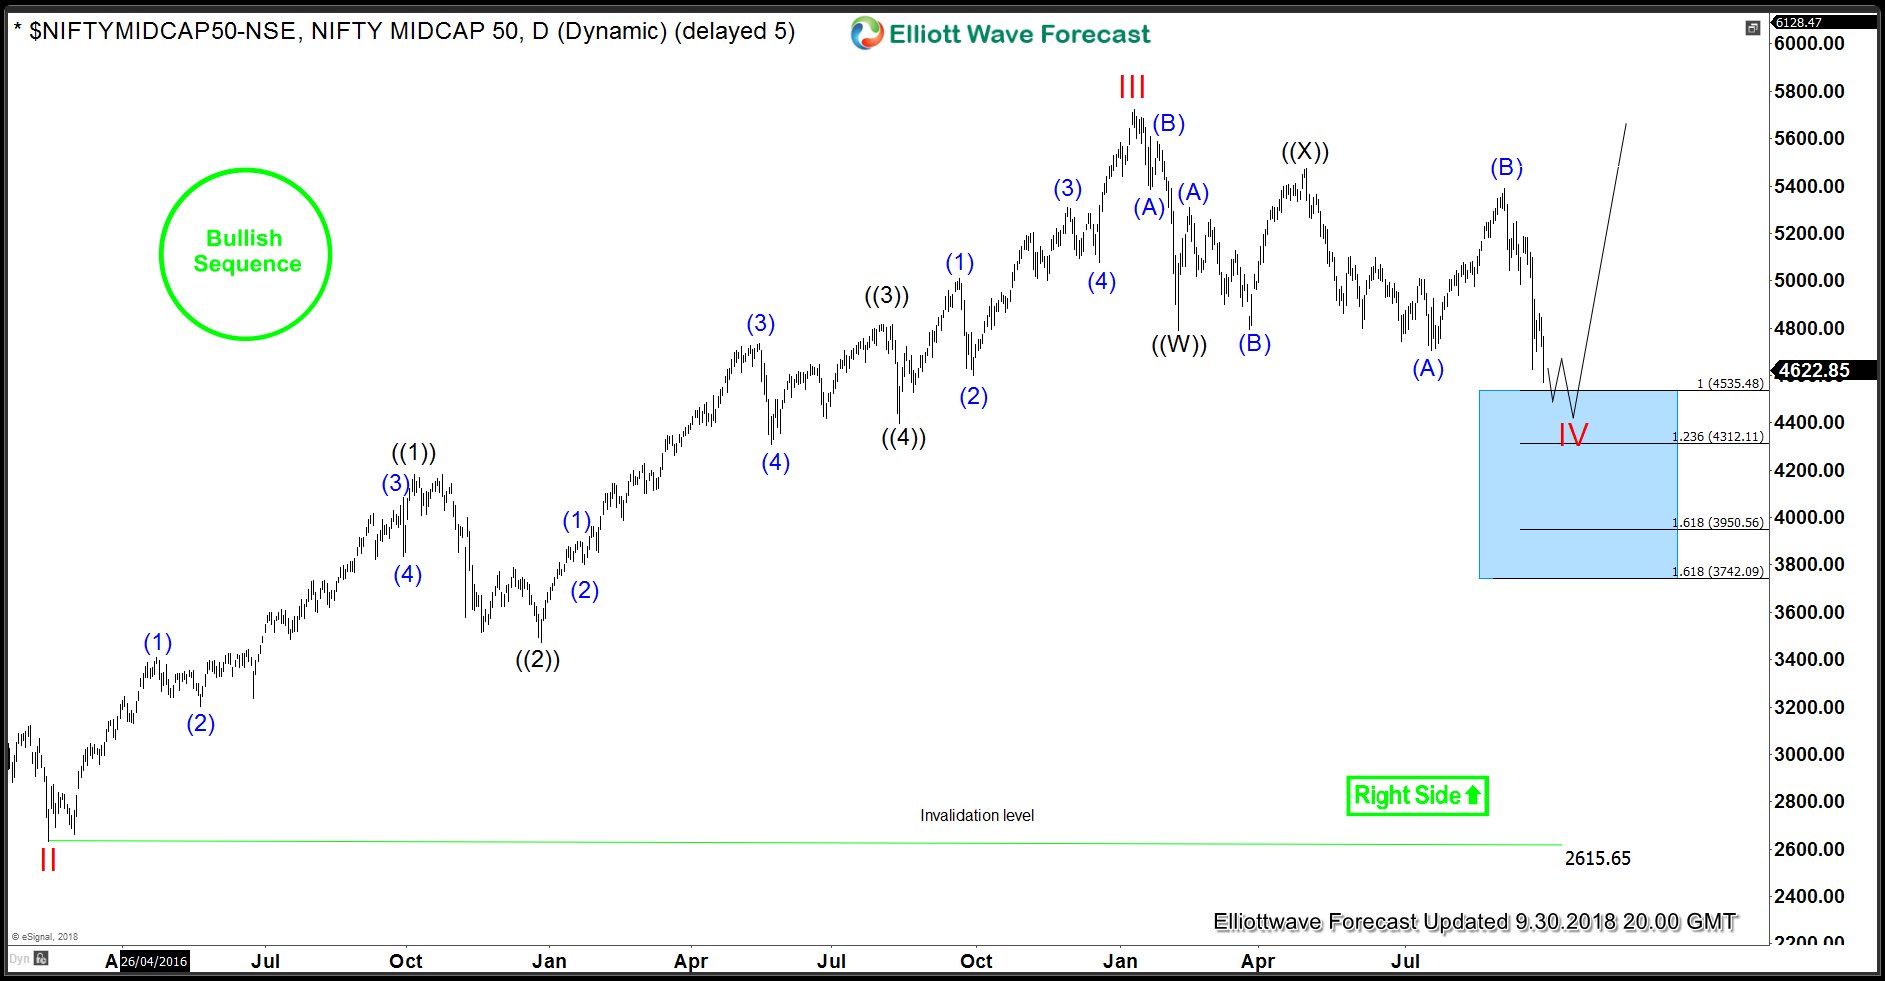
Nifty Midcap Index Turned Bearish or Still a Buy?
Read MoreNifty Midcap Index has dropped from a high of 5387 to close at 4622.85 on Friday losing 14% in the month of September 2018. In this article, we will take a look at the Elliott Wave view to determine whether Index has found a peak and now turned bearish or at least started a larger […]
-
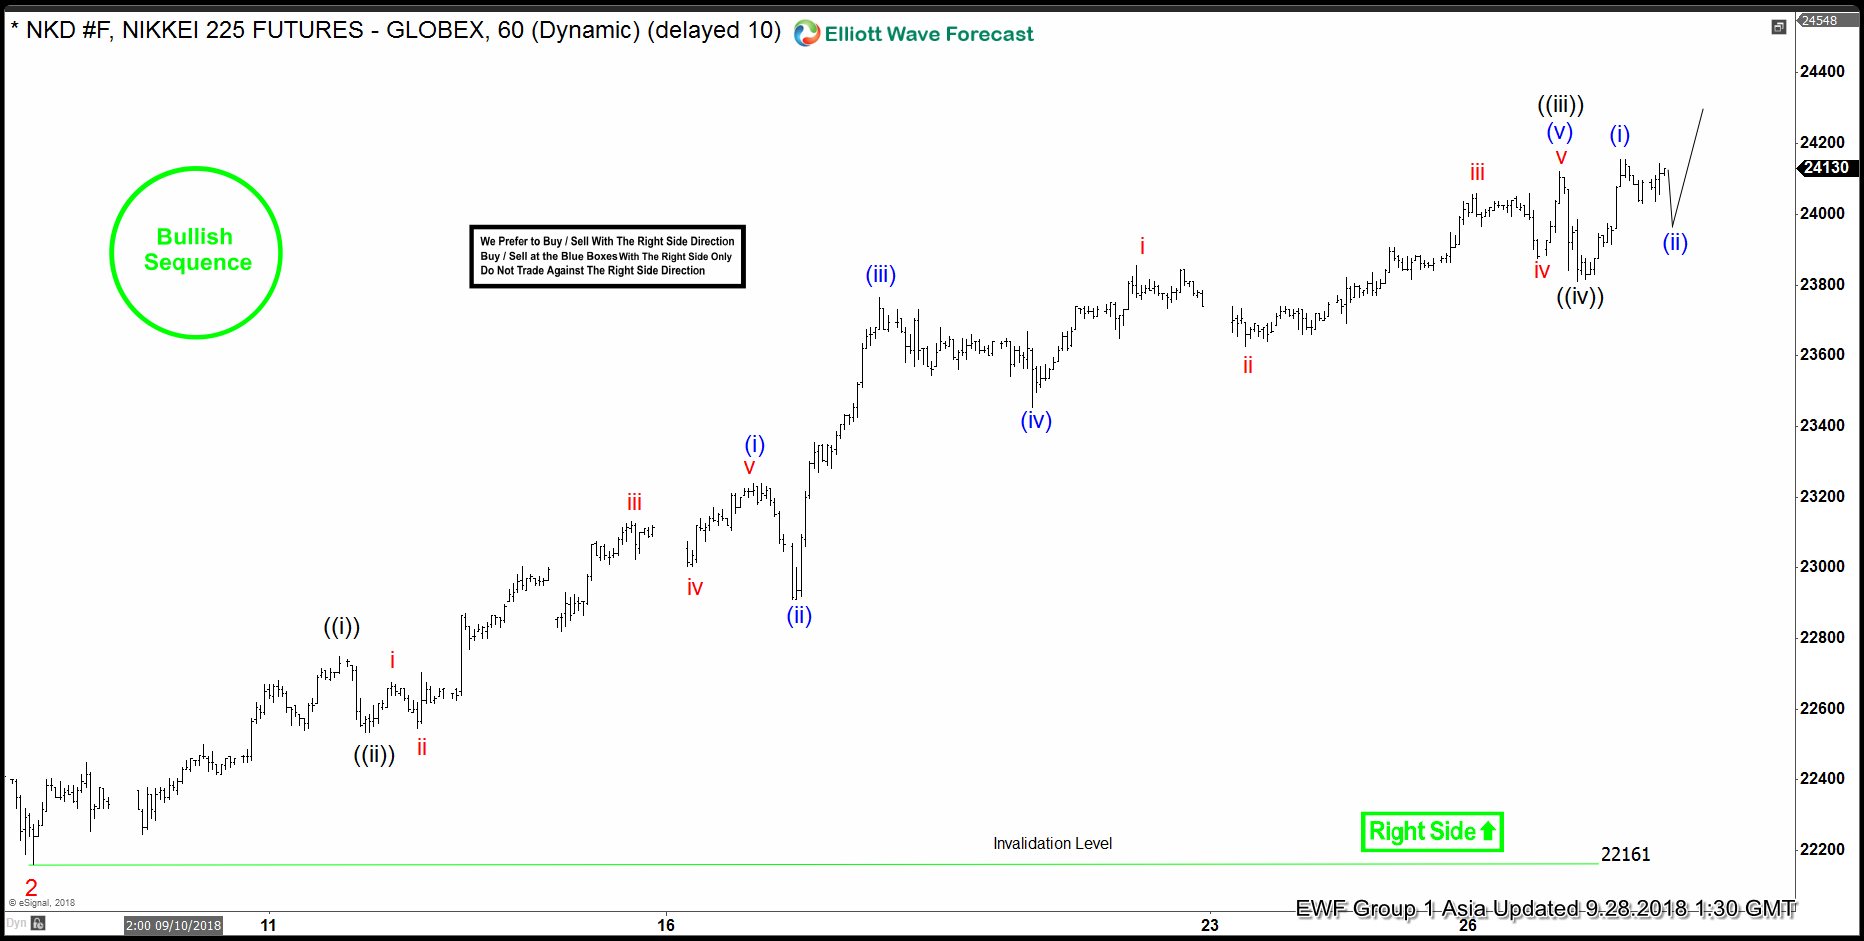
Nikkei Elliott Wave Right Side Calling Higher
Read MoreNikkei short-term Elliott wave view suggests that the decline to 22161 on 9/06/2018 low ended Minor wave 2. Above from there, Minor wave 3 remain in progress, nesting higher in an impulse structure. With lesser degree cycles showing sub-division of 5 waves structure in each leg higher i.e Minute wave ((i)), ((iii)) & ((v)) expected […]