

The Power of 3-7-11 and the Grand Super Cycle: How We Saw the Bullish Turn in April 2025 Back on April 9, 2025, while World Indices were dropping sharply and global sentiment had turned overwhelmingly bearish, we published an article that challenged the fear-driven narrative. We explained why selling was not the right approach and […]
-
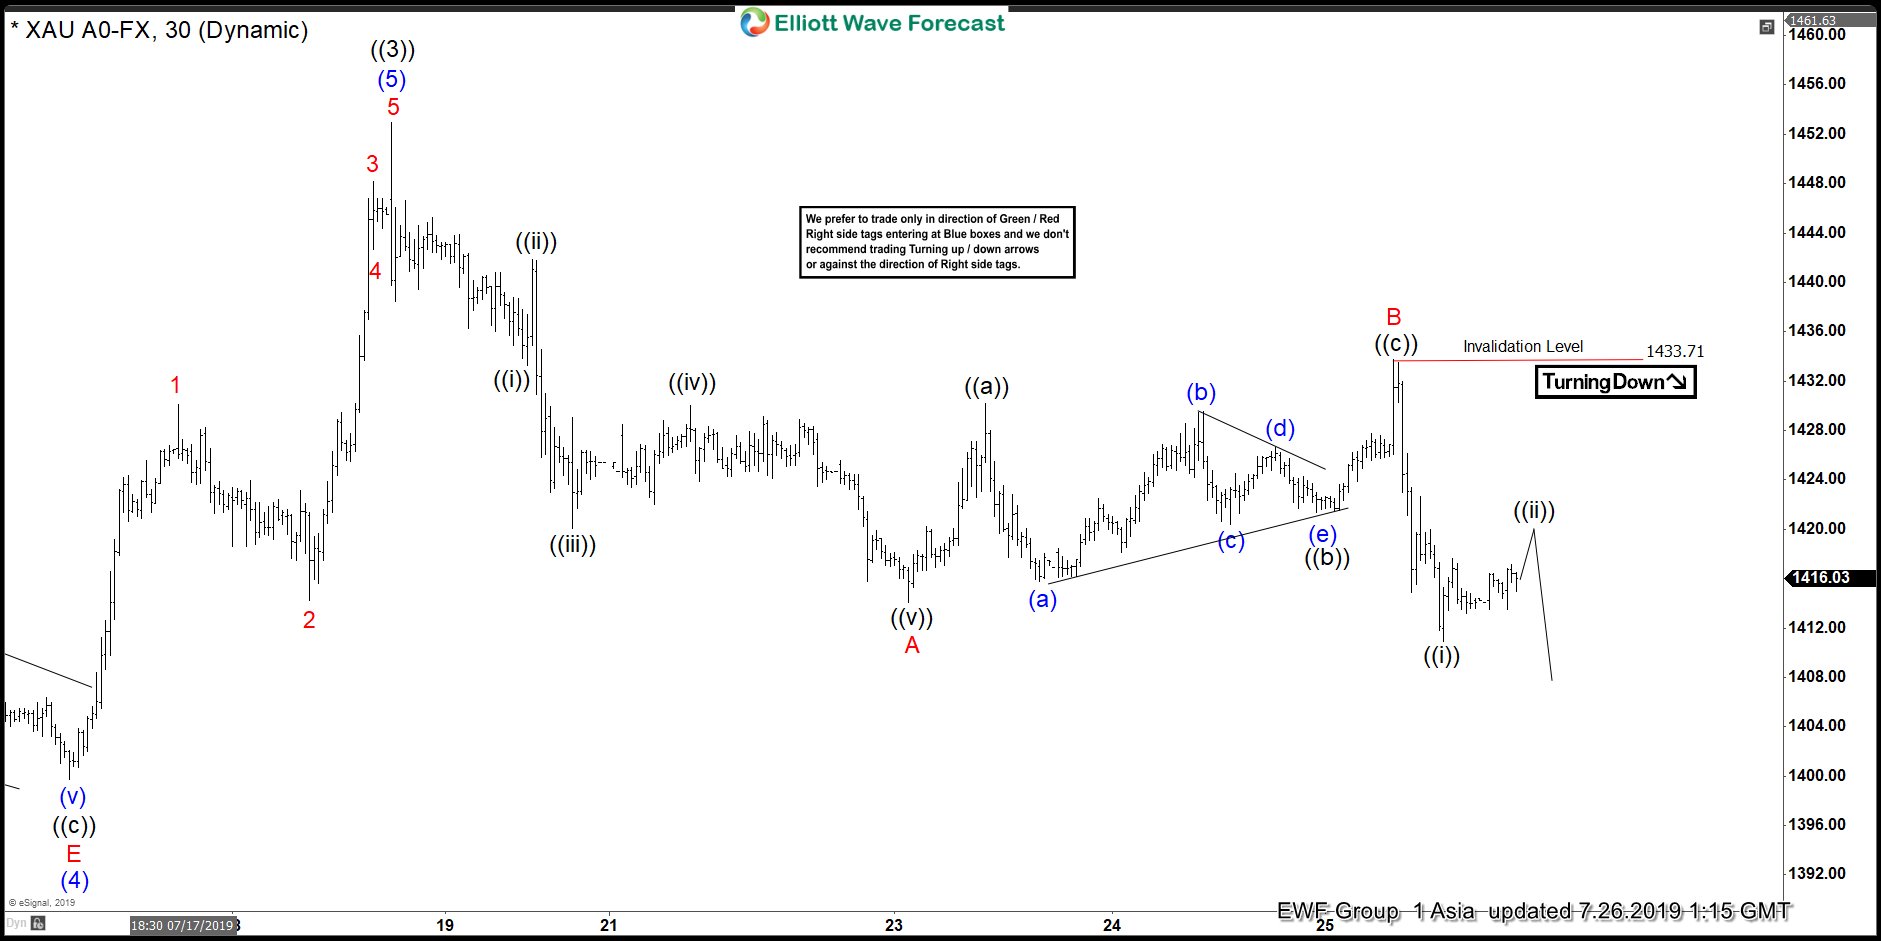
Gold Reached The Biggest Extreme. What’s Next?
Read MoreGold has managed to reach it’s the biggest extreme from 2015 lows by reaching our target area at $1450. This article & video show the Elliott Wave path
-
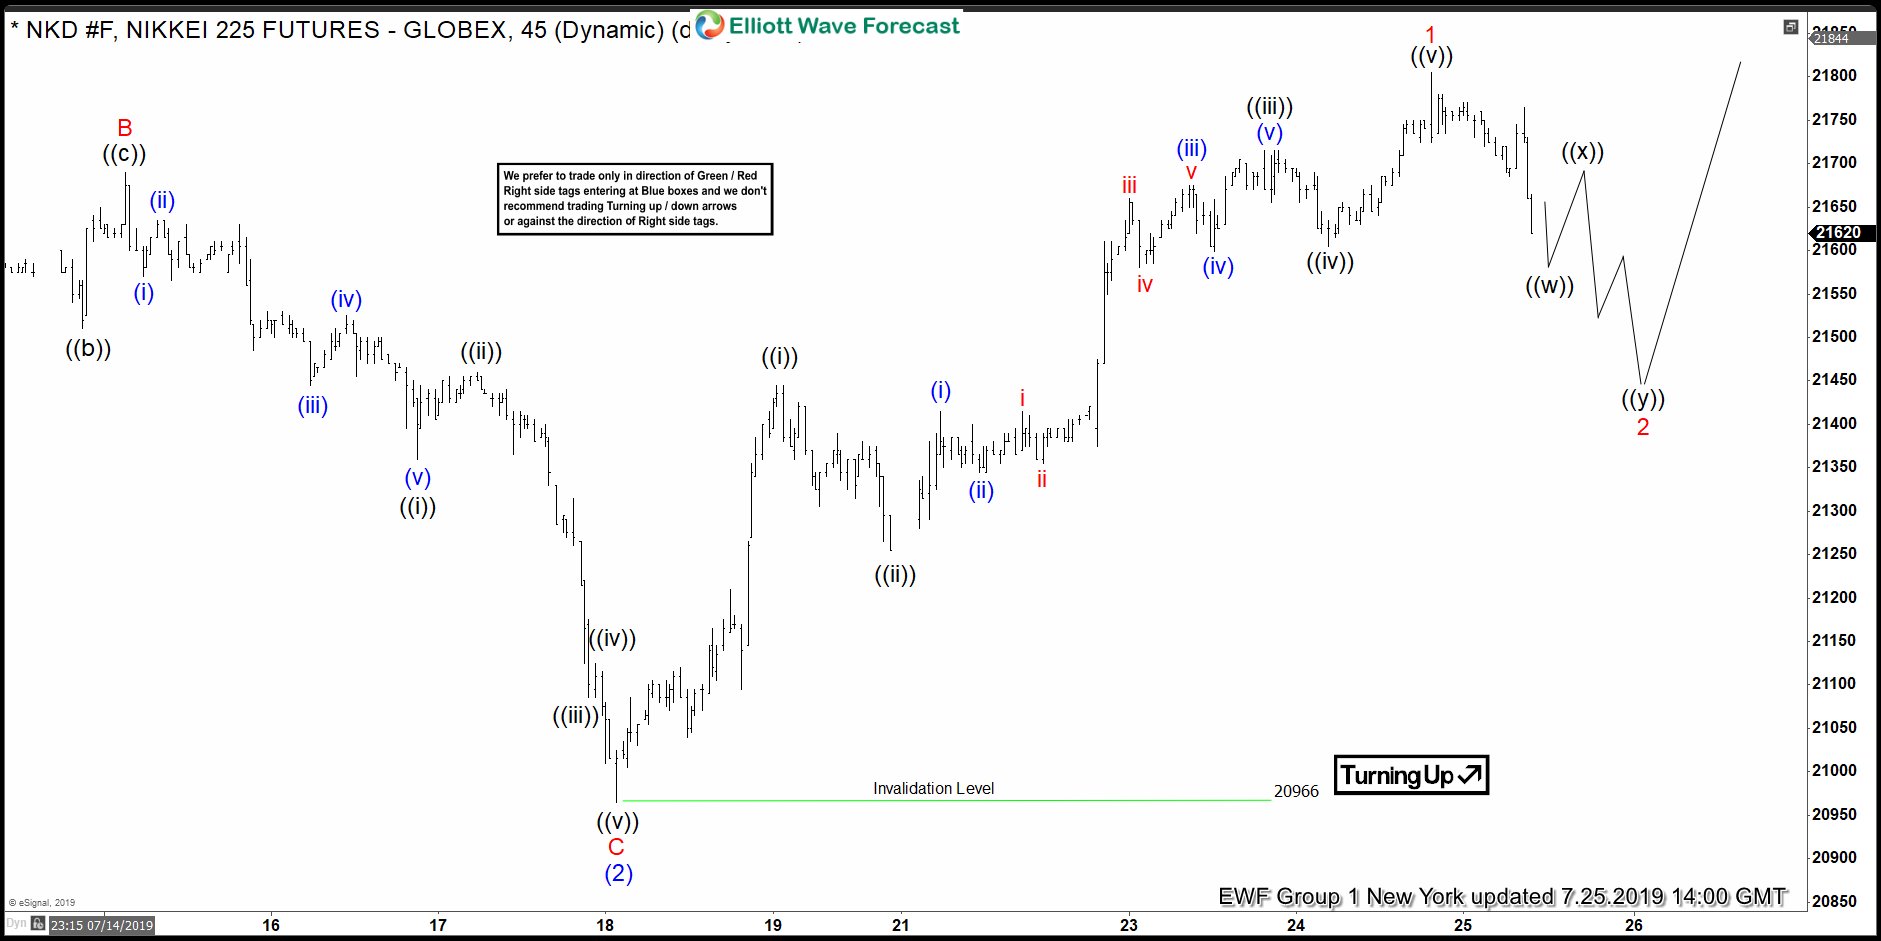
Nikkei Elliott Wave View: Leading The Move Higher
Read MoreNikkei ended the short term correction against 6/03/2019 low at 20966 low. This article and video shows the next Elliott Wave path.
-
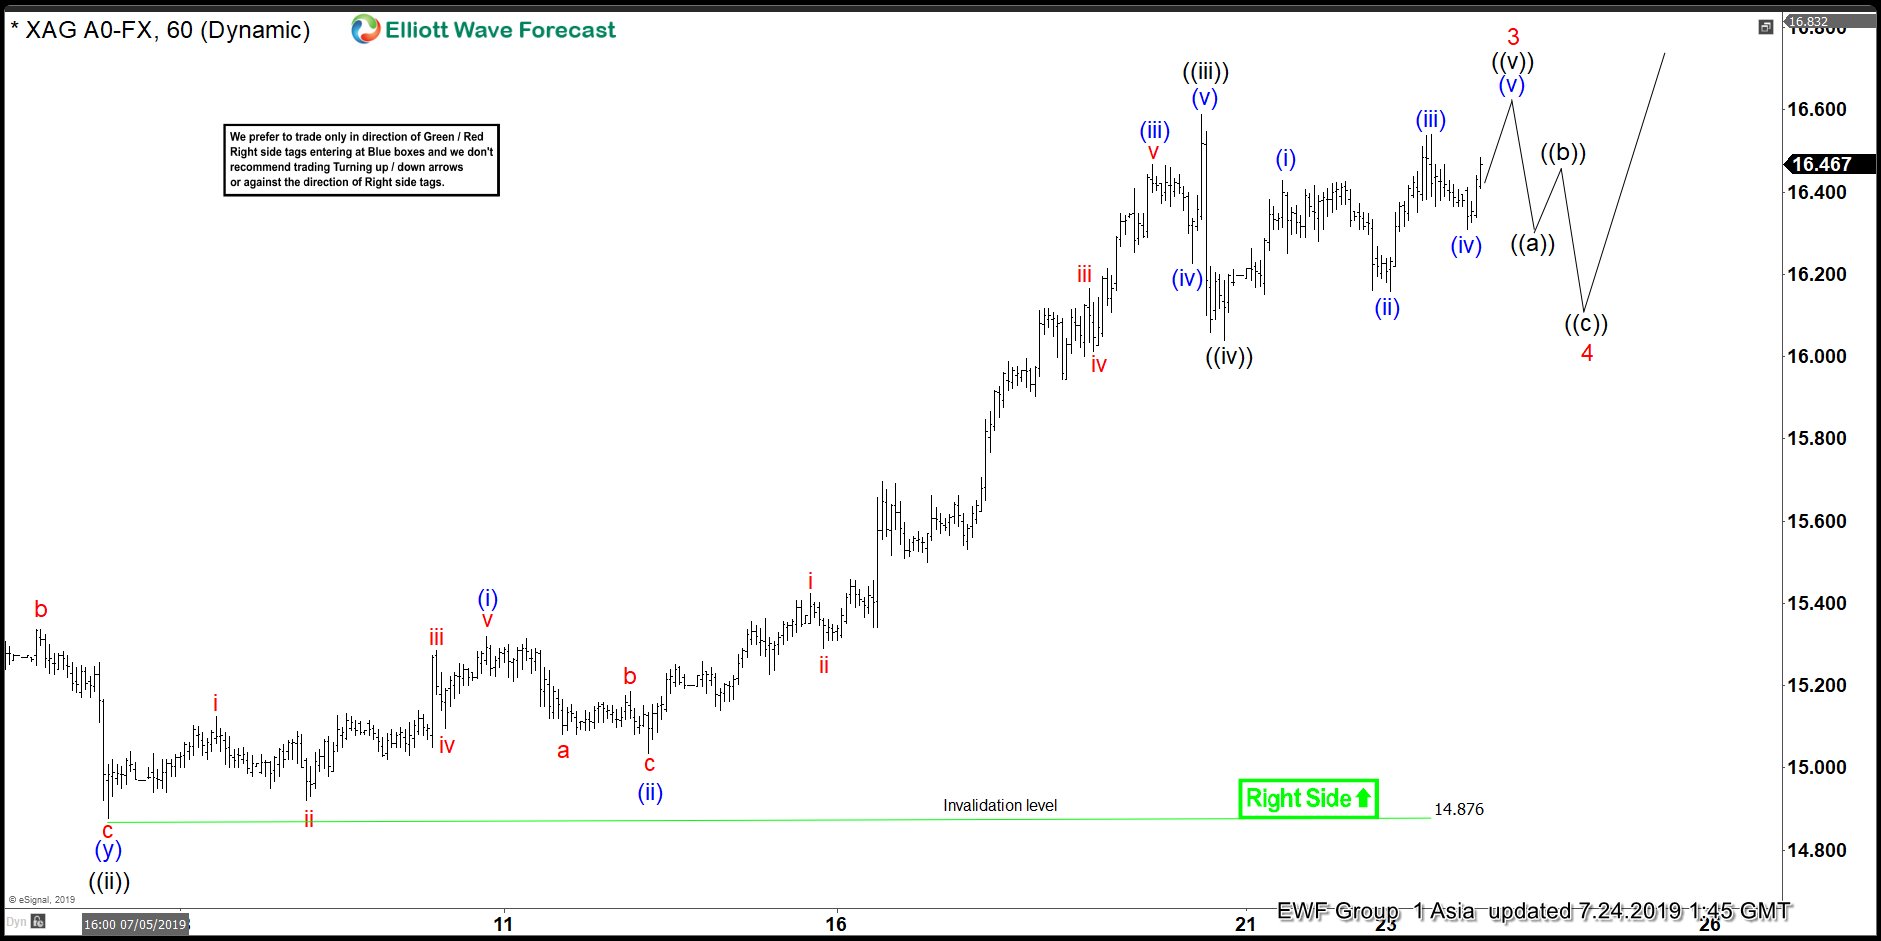
Silver Elliott Wave View: Impulse Move Favoring More Upside
Read MoreSilver rally from May 28, 2019 low is unfolding as an impulse Elliott wave structure favoring more upside to take place. The near-term pullback to $14.87 low ended wave ((ii)). Up from there, the metal made a strong rally to the upside and ended wave ((iii)) at $16.58 high. The internals of that rally unfolded […]
-
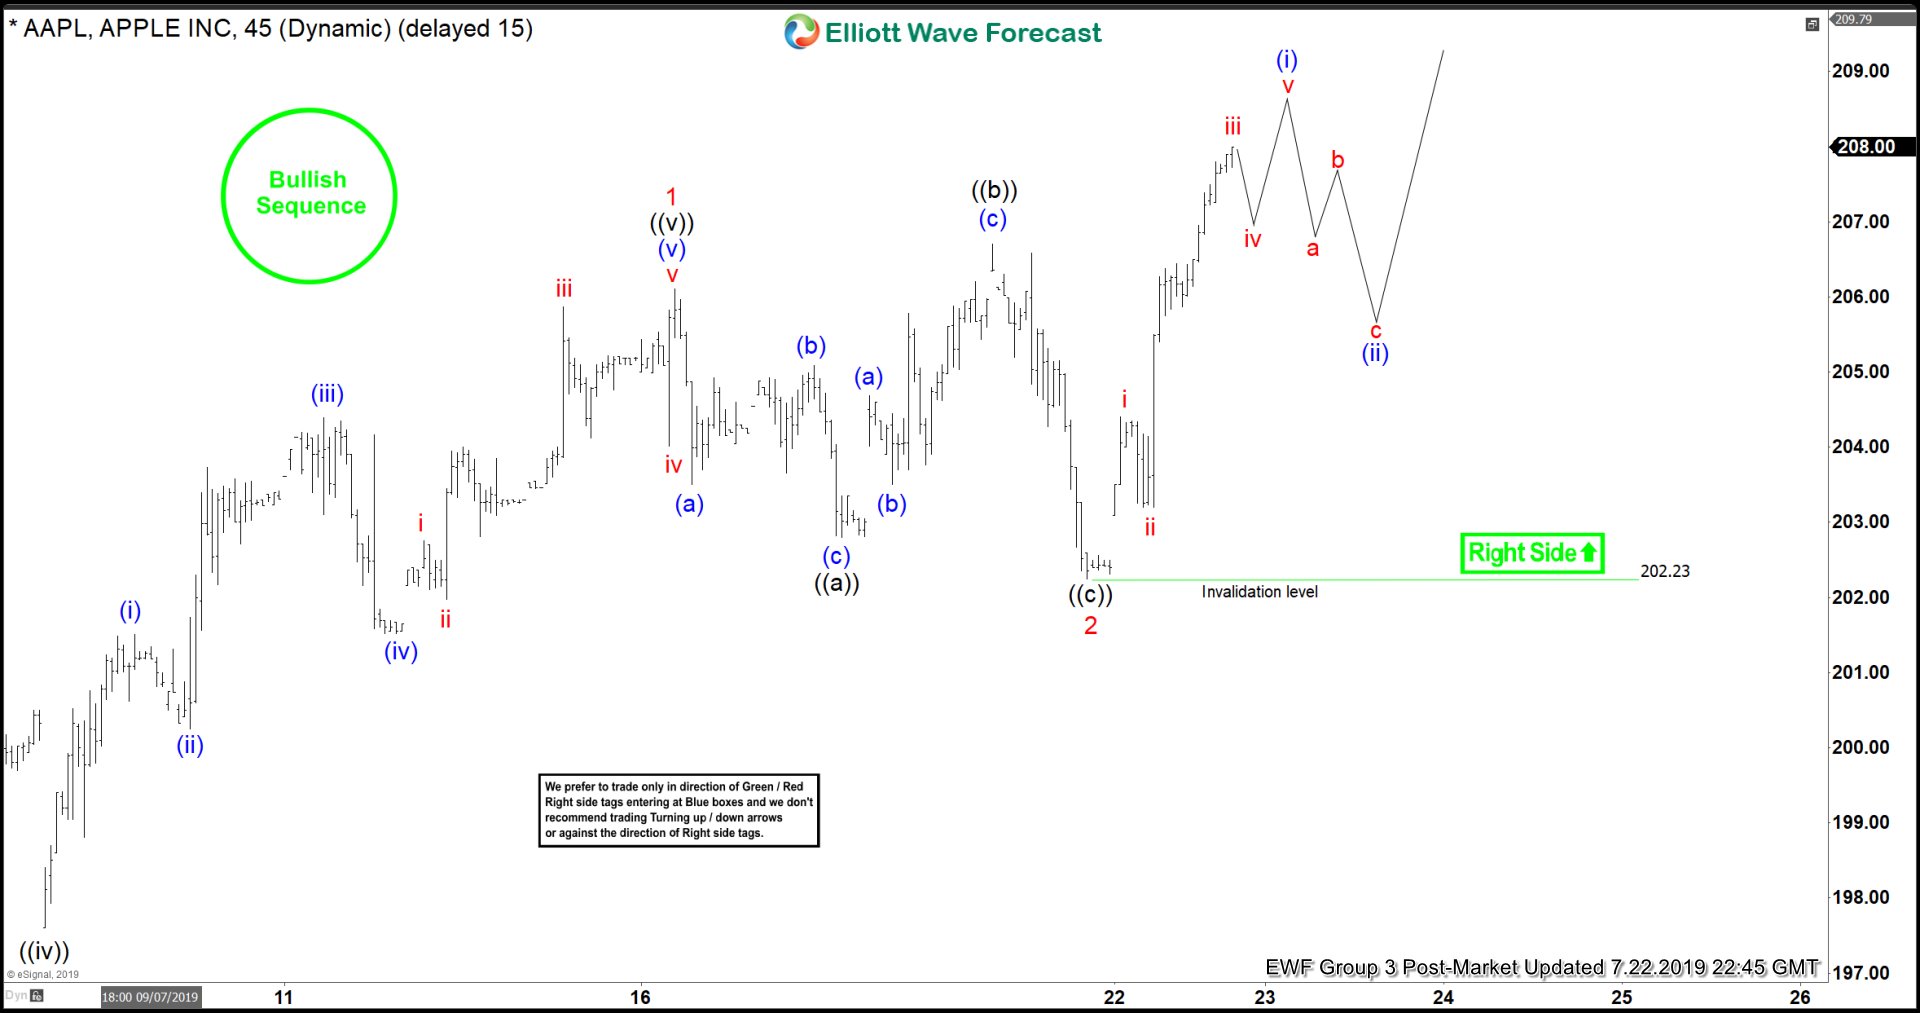
Apple Elliott Wave View: Break Higher Is Imminent
Read MoreApple shows a bullish sequence from June 04 low favoring more upside calling for a potential break higher. This article & video show the Elliott Wave path.