
-
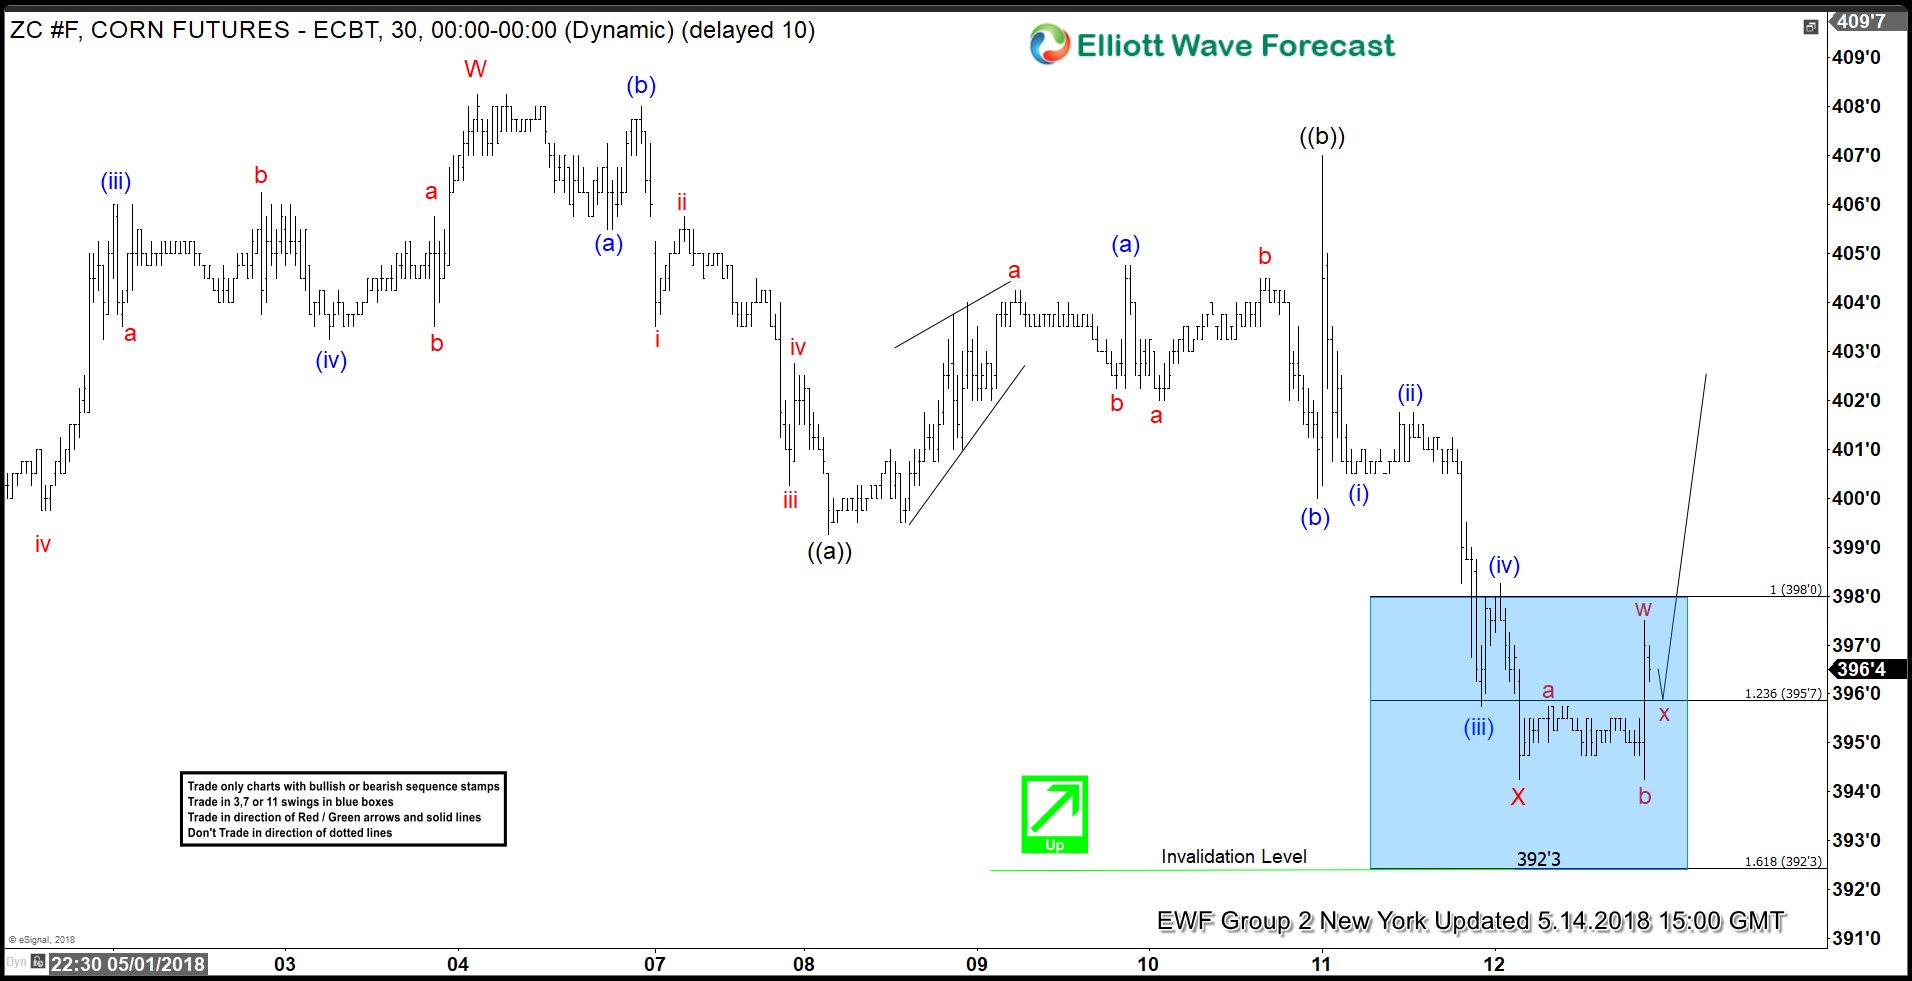
CORN (ZC #F) Futures Forecasting the Rally & Buying The Dips
Read MoreHello fellow traders. Another trading opportunity we have had lately is Corn Futures. In this technical blog we’re going to take a quick look at the Elliott Wave charts of ZC #F published in members area of the website. In further text we’re going to explain the forecast and trading setup. As our members know, […]
-
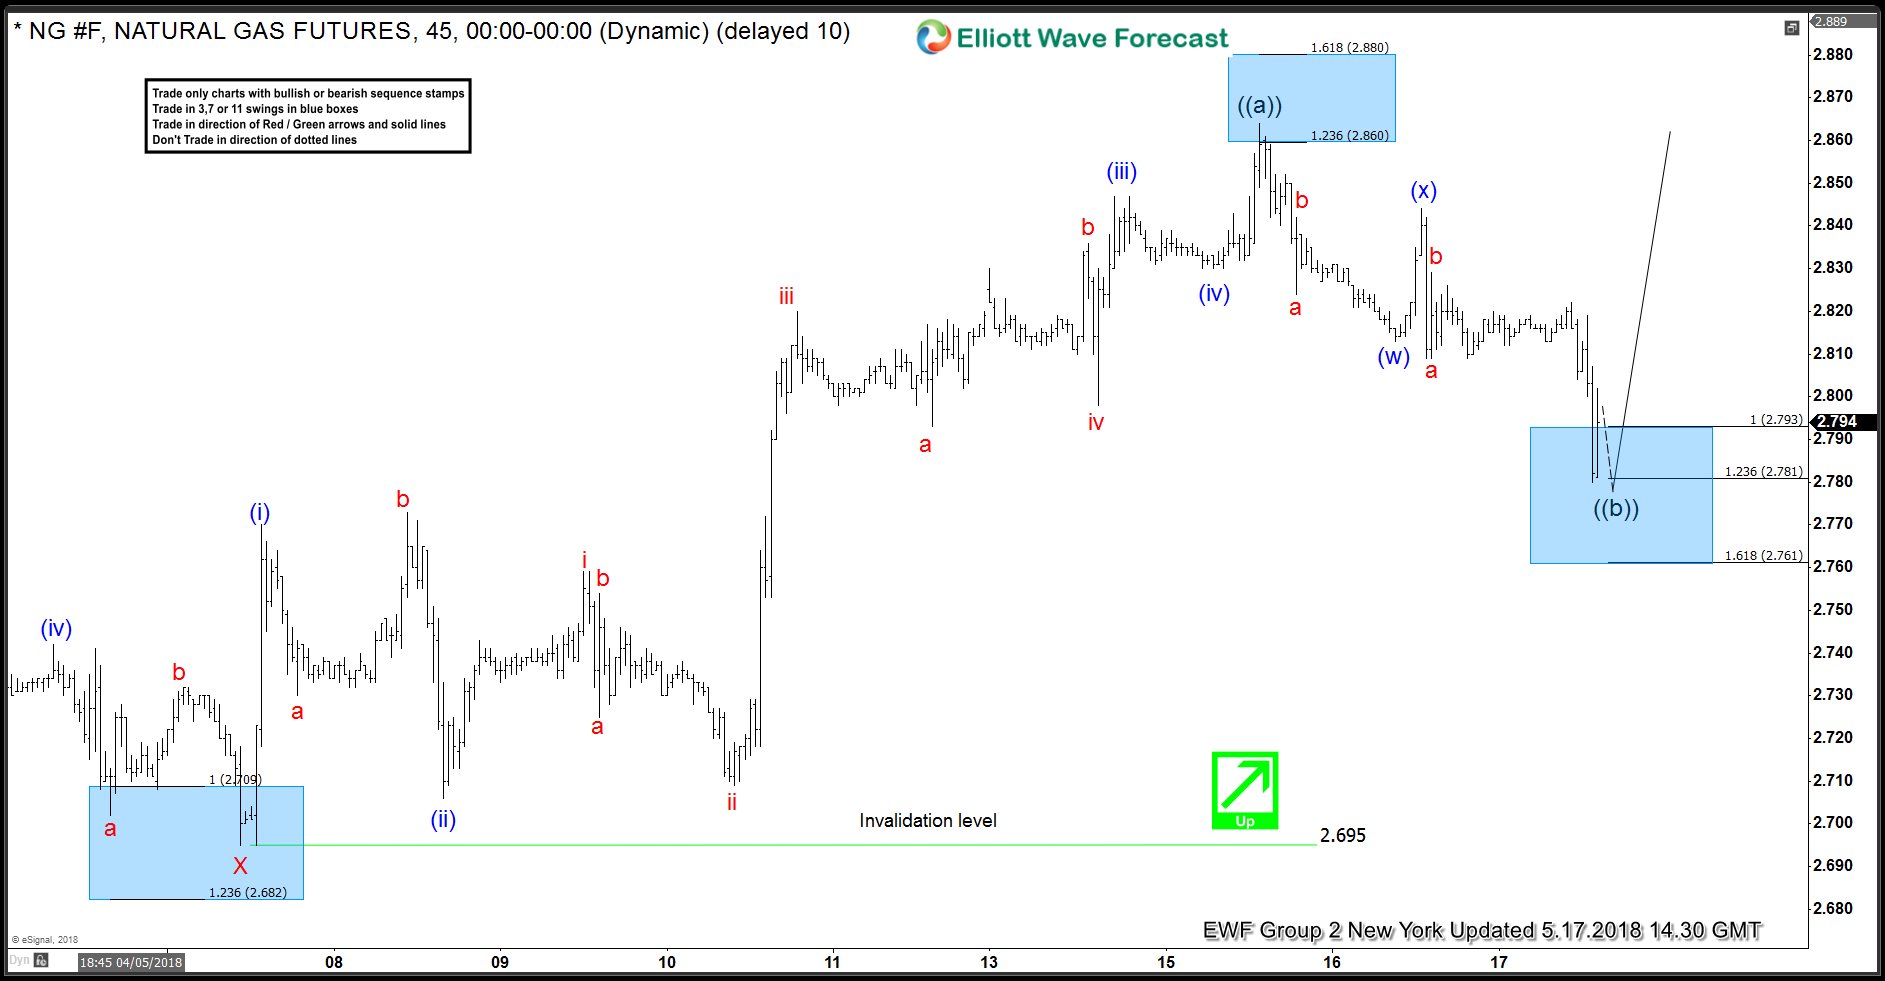
Natural Gas ( NG #F) Buying The Dips
Read MoreHello fellow traders. Another trading opportunity we have had lately is Natural Gas (NG #F). In this technical blog we’re going to take a quick look at the past Elliott Wave charts of NG #F published in members area of the website. In further text we’re going to explain the forecast and trading setup. Natural […]
-
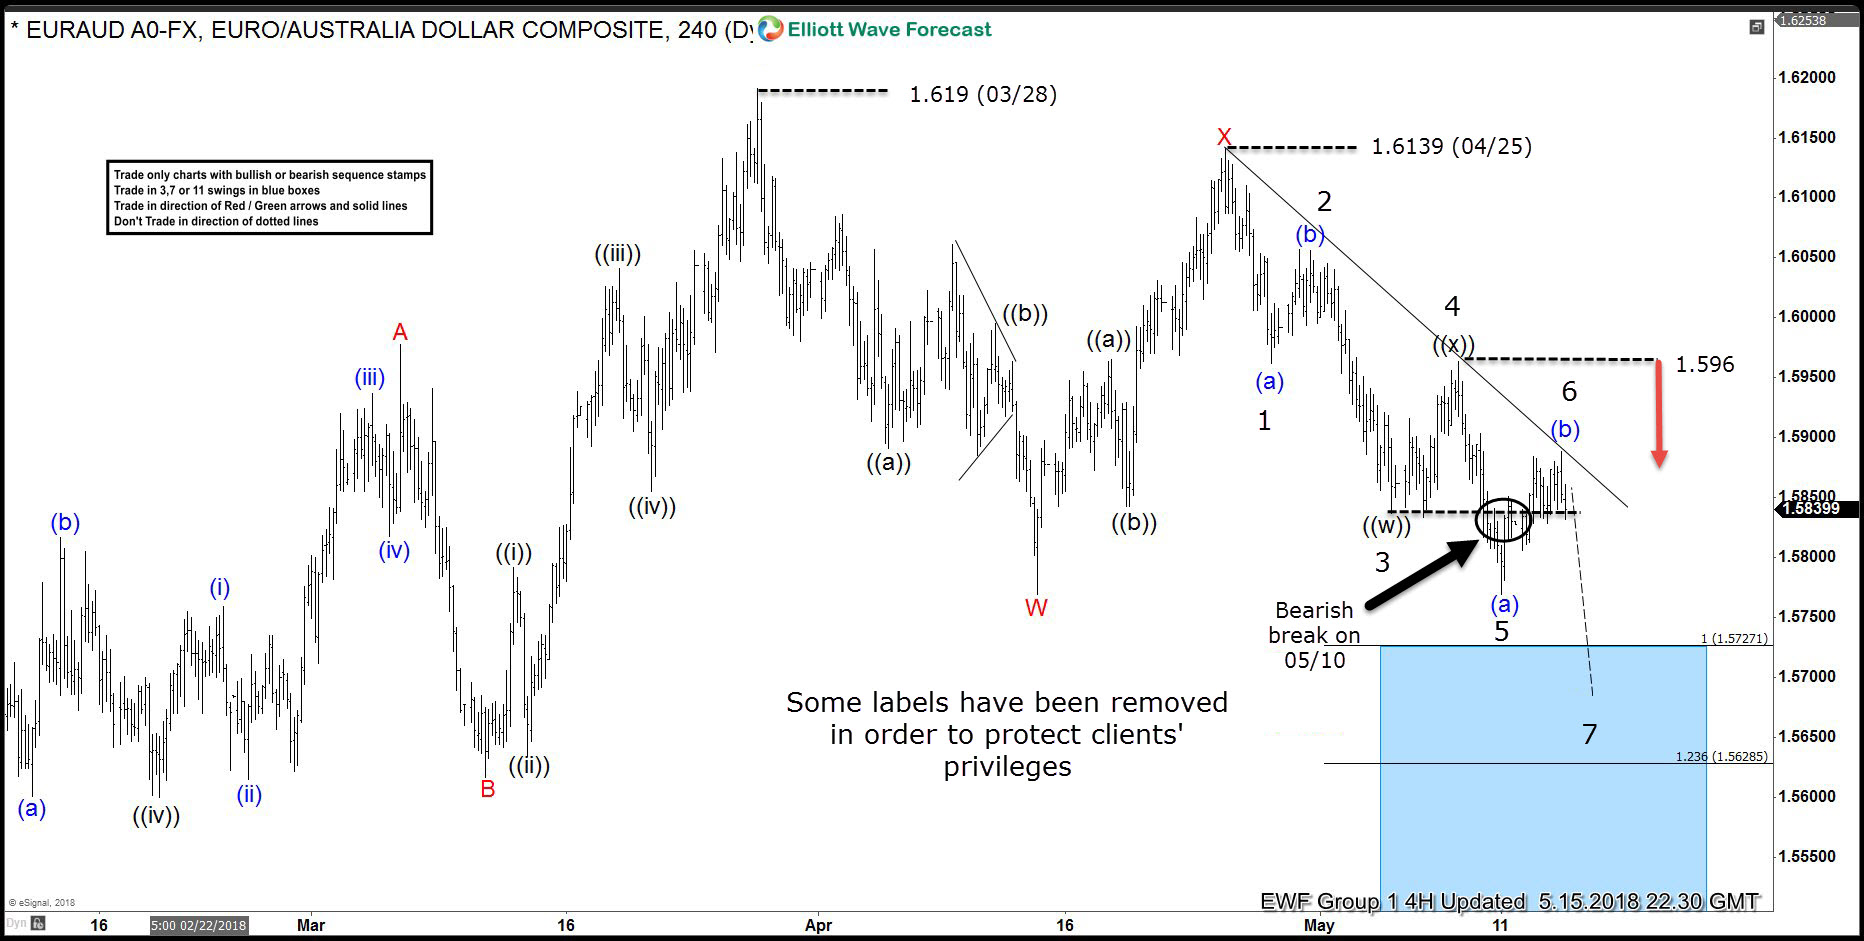
EURAUD Reaching The Extremes in March 28th Cycle
Read MoreHello fellow traders. In this technical blog we’re going to take a quick look at the charts of EURAUD published in members area of the website. In further text we’re going to explain Elliott Wave Forecast and Swings count. EURAUD Elliott Wave 4 Hour Chart 5.15.2018 EURAUD has made important break on May 10th, making short […]
-
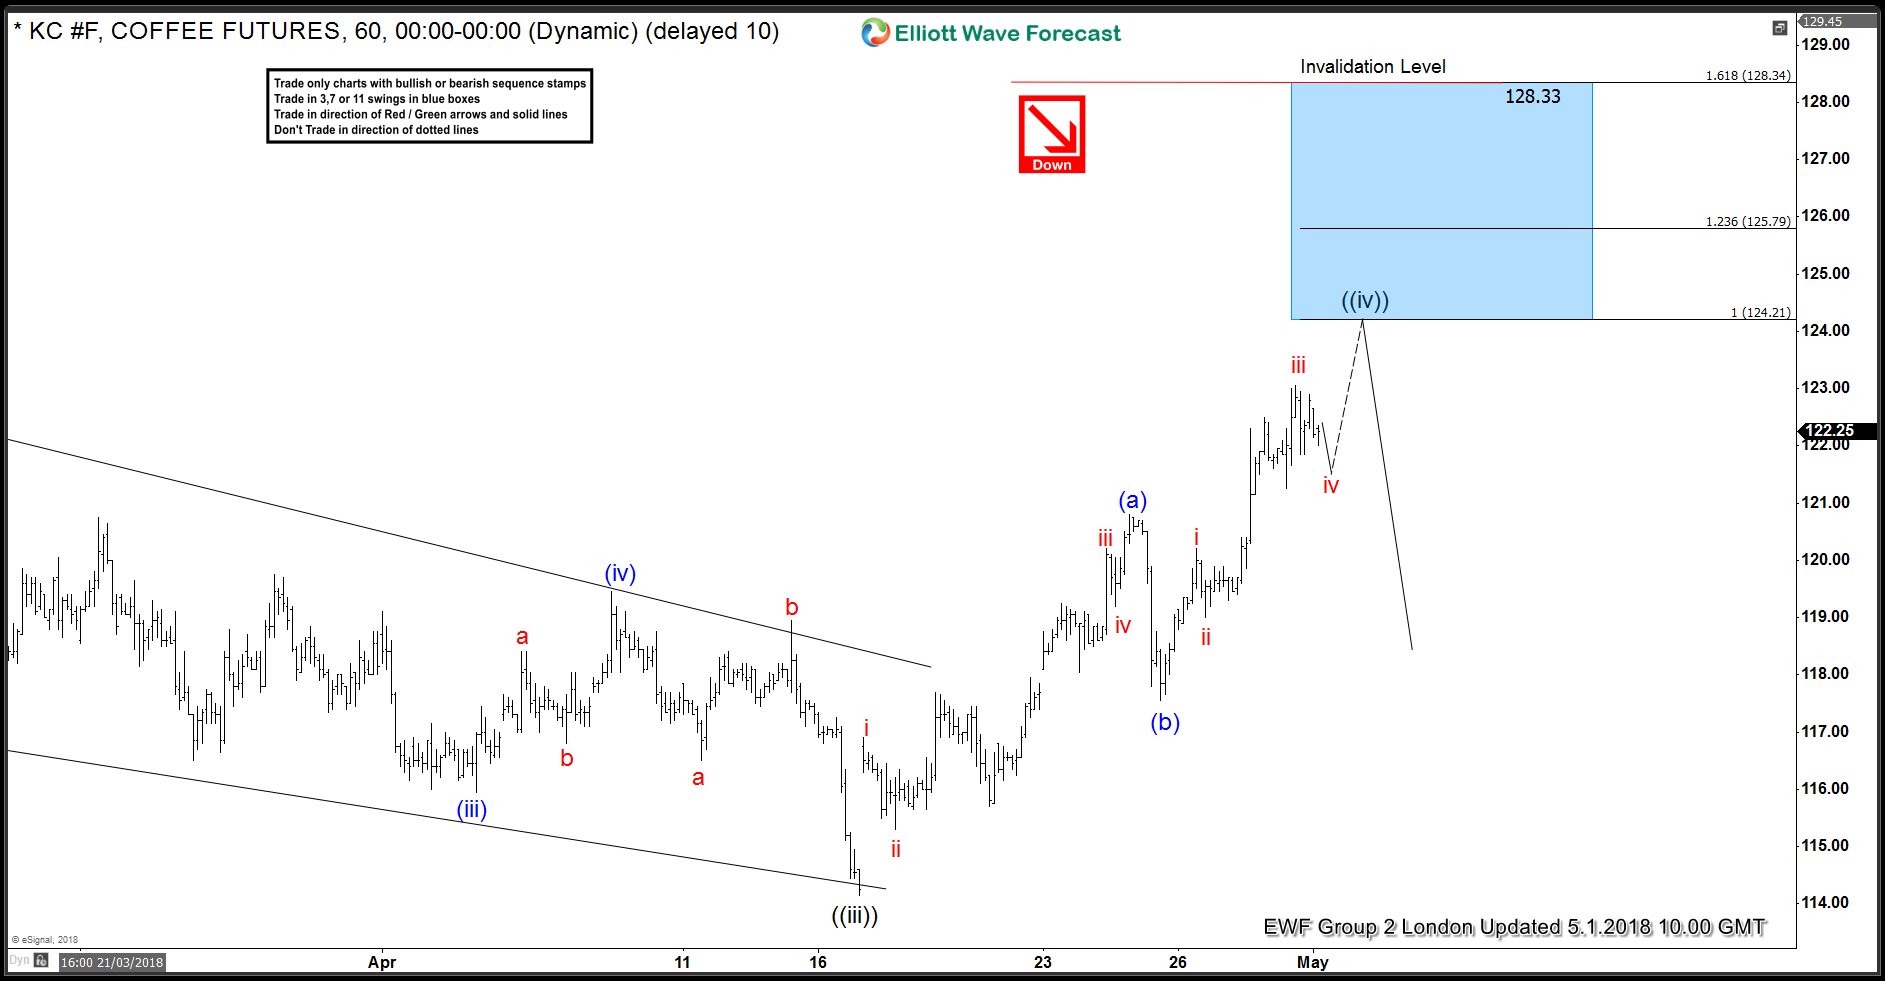
COFFEE Futures (KC#F) Selling The Bounce
Read MoreHello fellow traders. In this technical blog we’re going to take a quick look at the charts of COFFEE Futures (KC#F) . In further text we’re going to explain the Elliott Wave structure, forecast and trading strategy. As our members know, KC#F has had incomplete bearish sequences in H4 cycle according to Sequence Report. Consequently […]
-
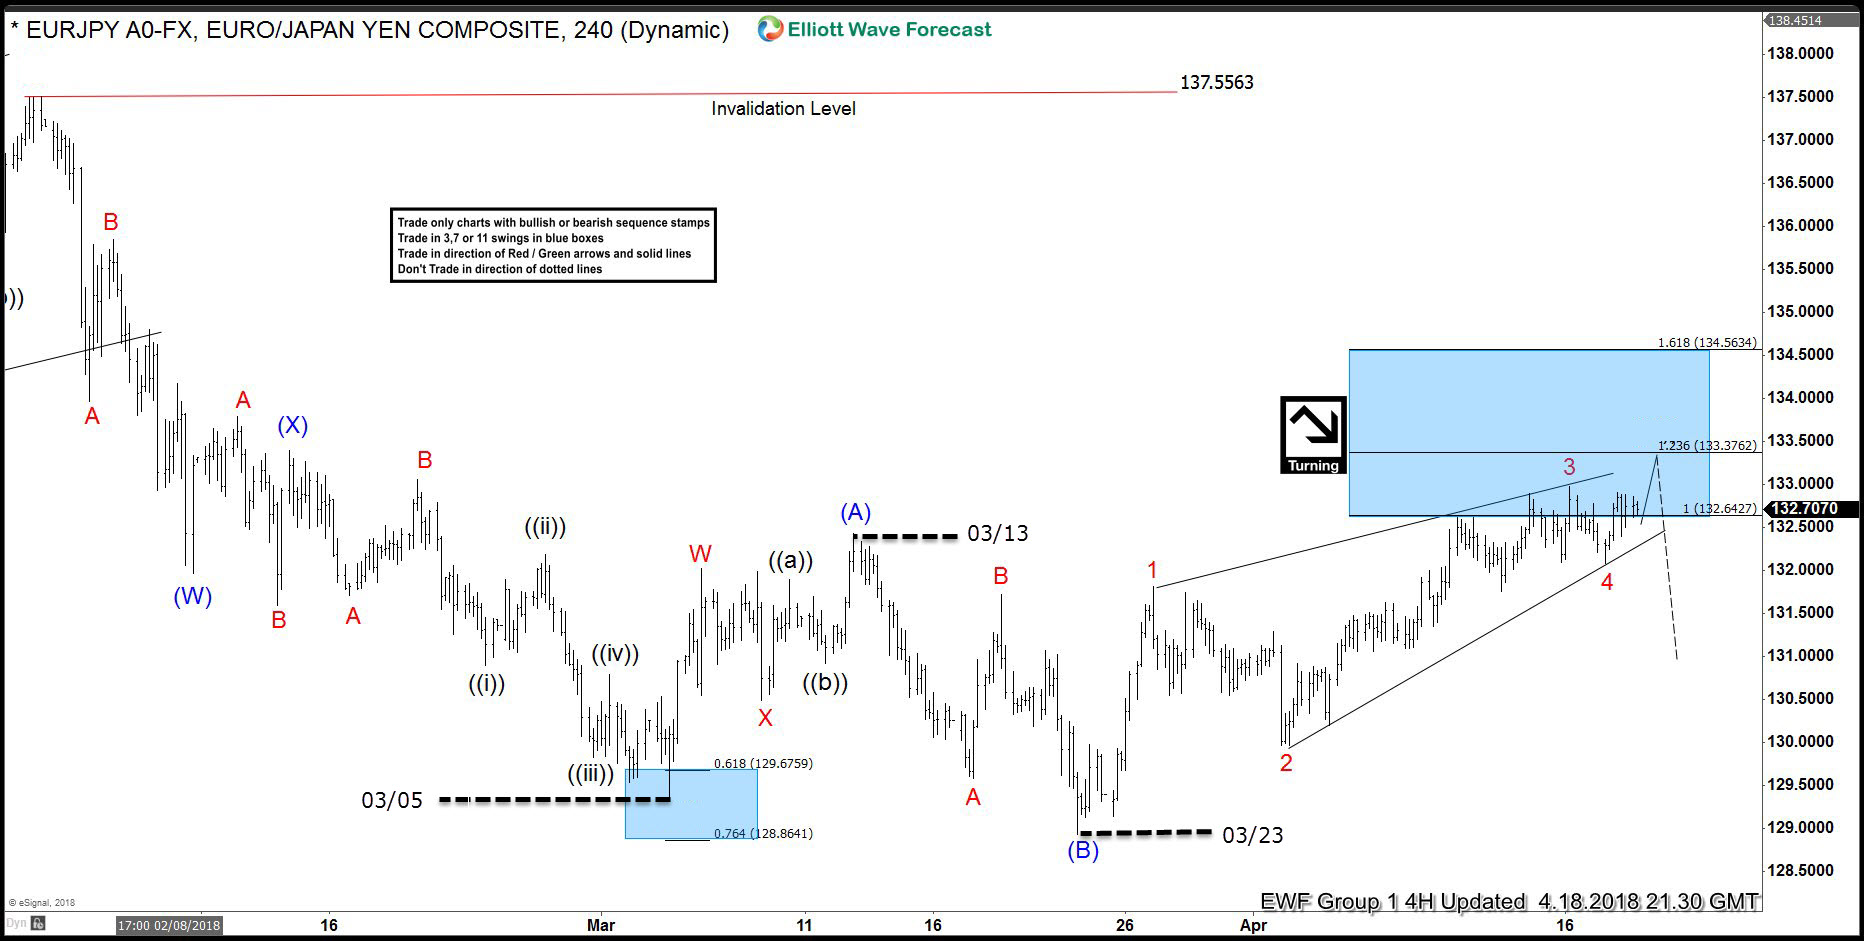
EURJPY Forecasting The Decline After Elliott Wave Flat
Read MoreHello fellow traders. In this technical blog we’re going to take a quick look at the Elliott Wave charts of EURJPY published in members area of the website. As our members know, the pair has been trading lately within Elliott Wave Flat structure. In further text we’re going to explain the forecast and Elliott Wave […]
-
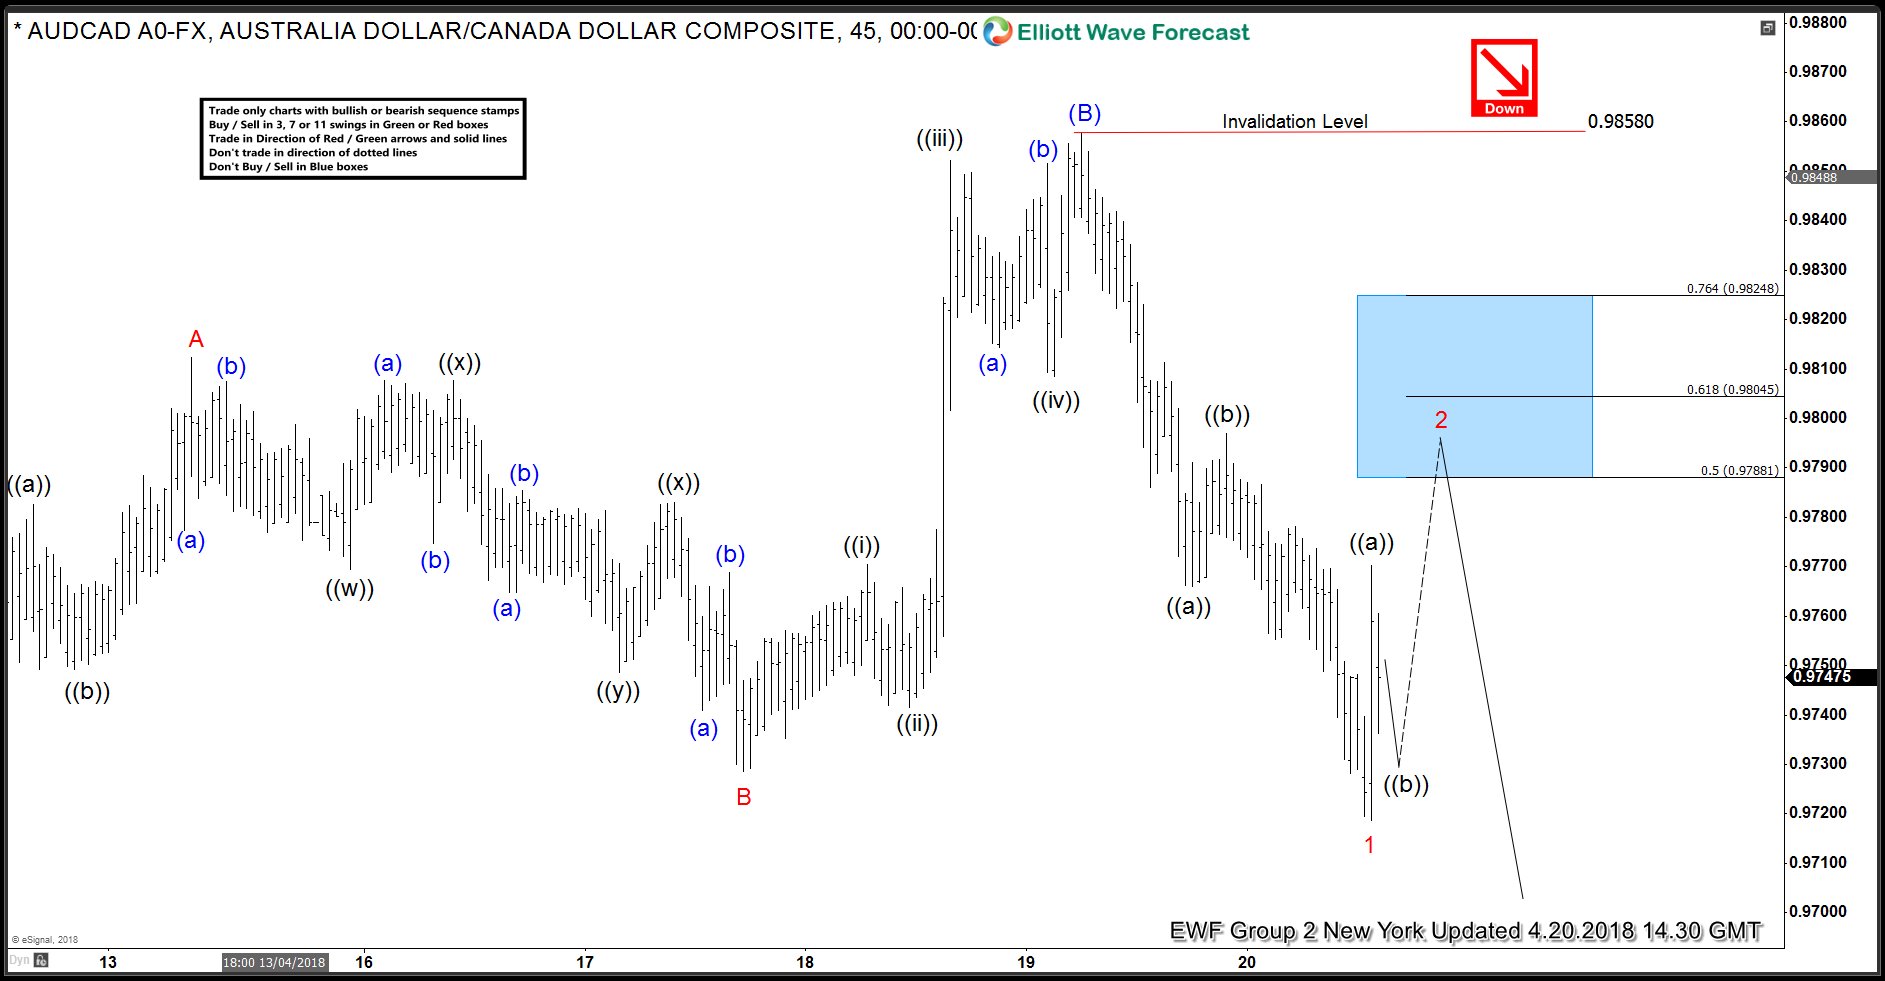
AUDCAD Forecasting the Decline & Selling the Rallies
Read MoreHello fellow traders. In this technical blog we’re going to take a quick look at the Elliott Wave charts of AUDCAD published in members area of the website. On April 20th, the pair broke 04/12 low and open further extension to the downside. Mentioned broke made cycle from the March 13th peak incomplete and the […]