
-
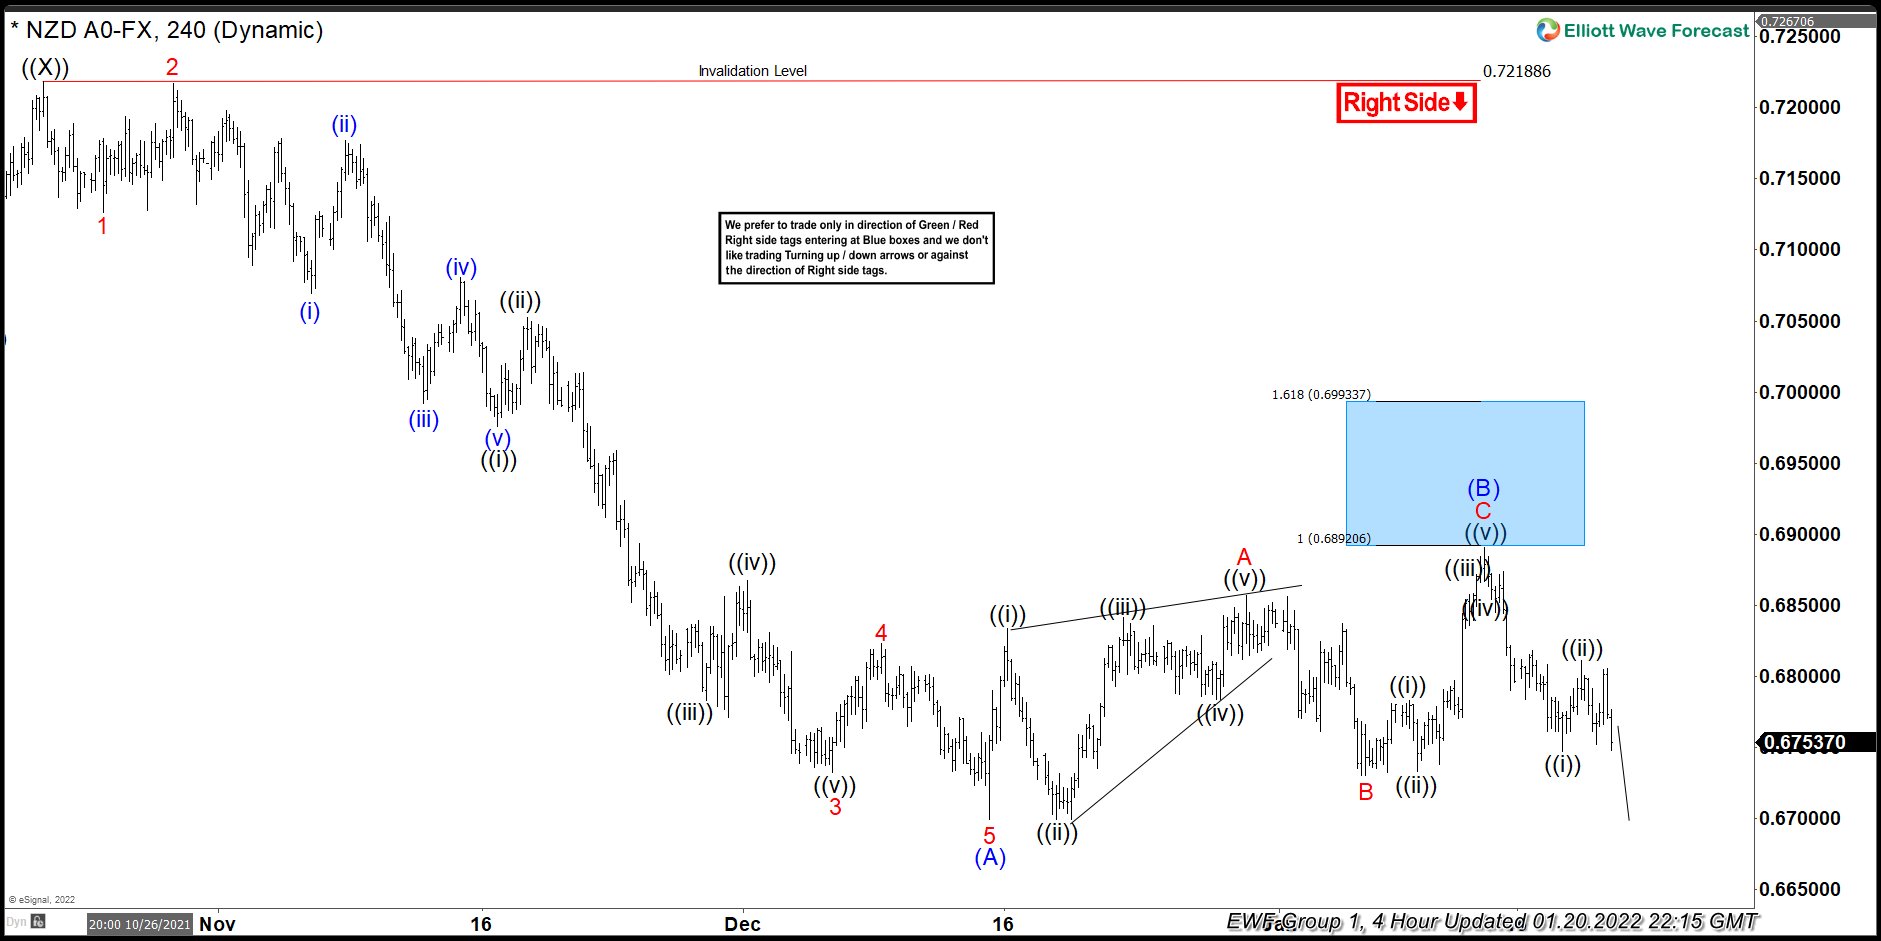
NZDUSD : Forecasting The Decline After Elliott Wave Zig Zag
Read MoreHello fellow traders. In this technical blog we’re going to take a quick look at the Elliott Wave charts of NZDUSD. As our members know, NZDUSD is showing incomplete bearish sequences in the cycle from the February 2021 peak. Recently the pair gave us 3 waves bounce against the 0.7217 peak. Recovery unfolded as Elliott […]
-
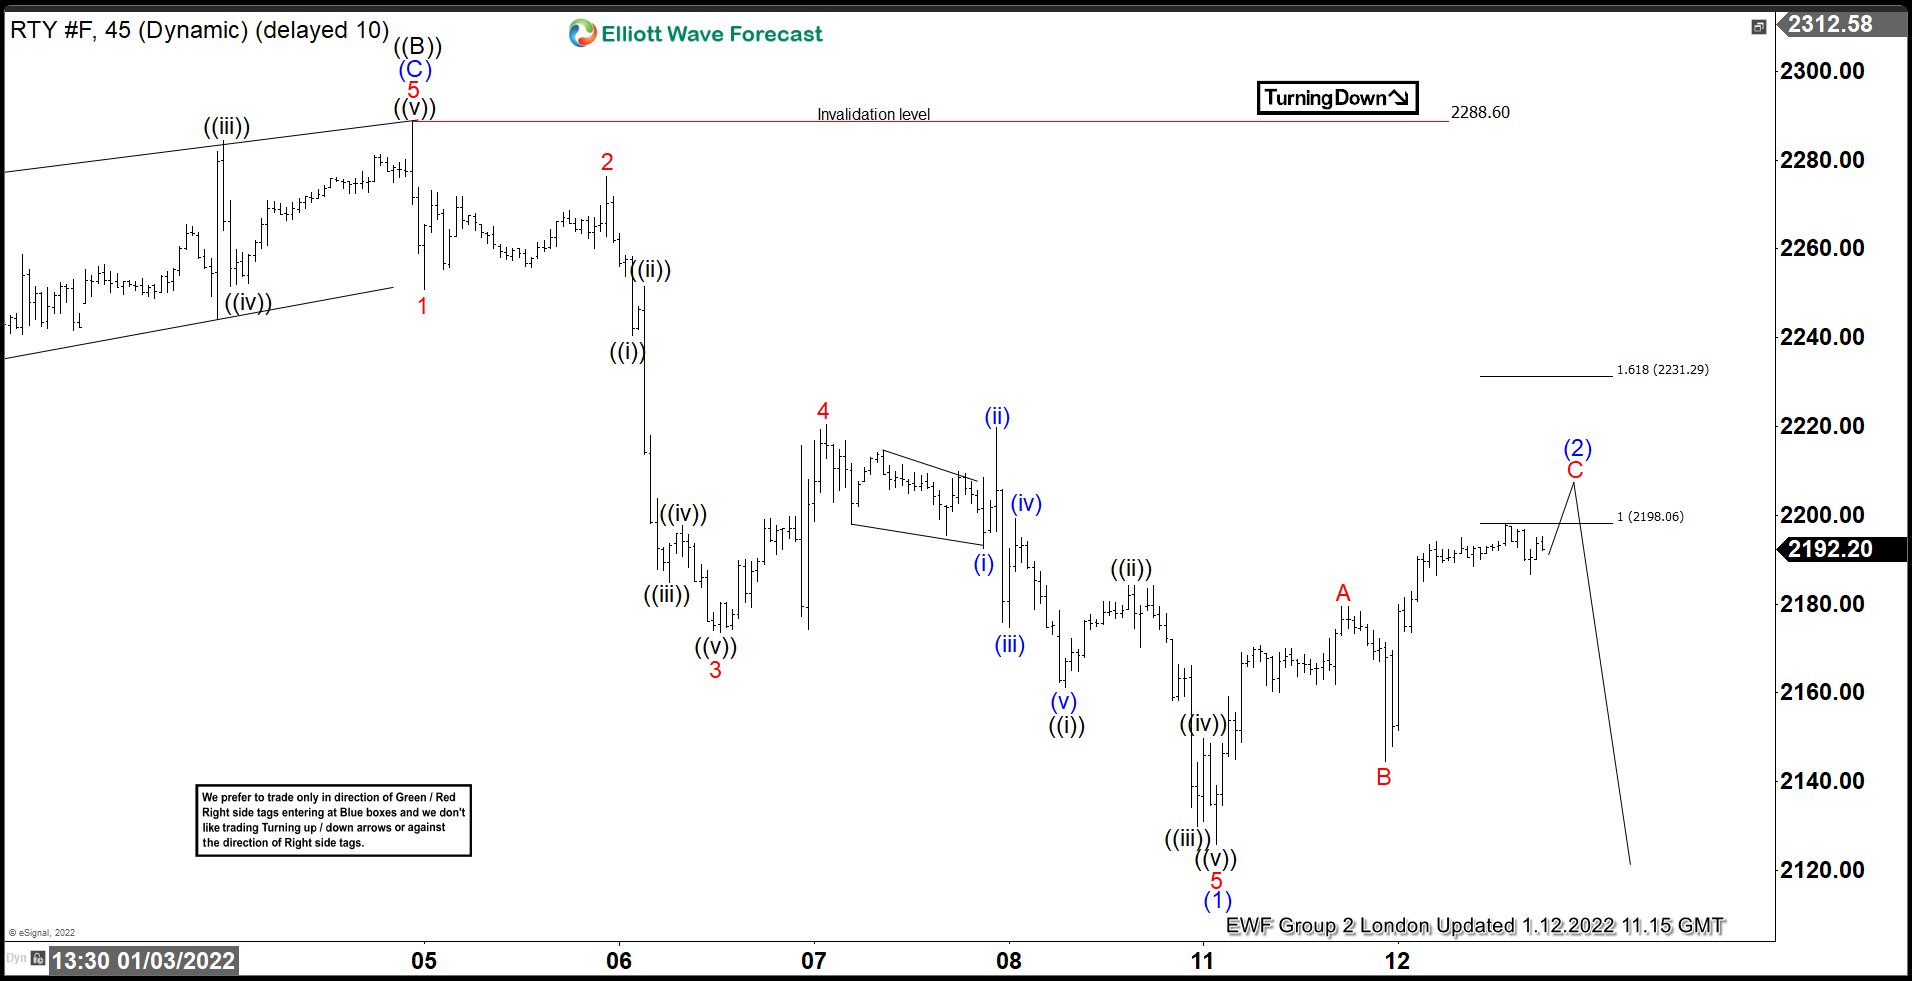
Russell Futures ($RTY #F) : Elliott Wave Forecasting The Decline
Read MoreHello fellow traders. In this technical blog we’re going to take a quick look at the Elliott Wave charts of Russell Futures ($RTY #F), published in members area of the website. As our members know, the futures has made lower low sequences in the cycle from the 11.8.2021 peak. In the mean time correction turned […]
-
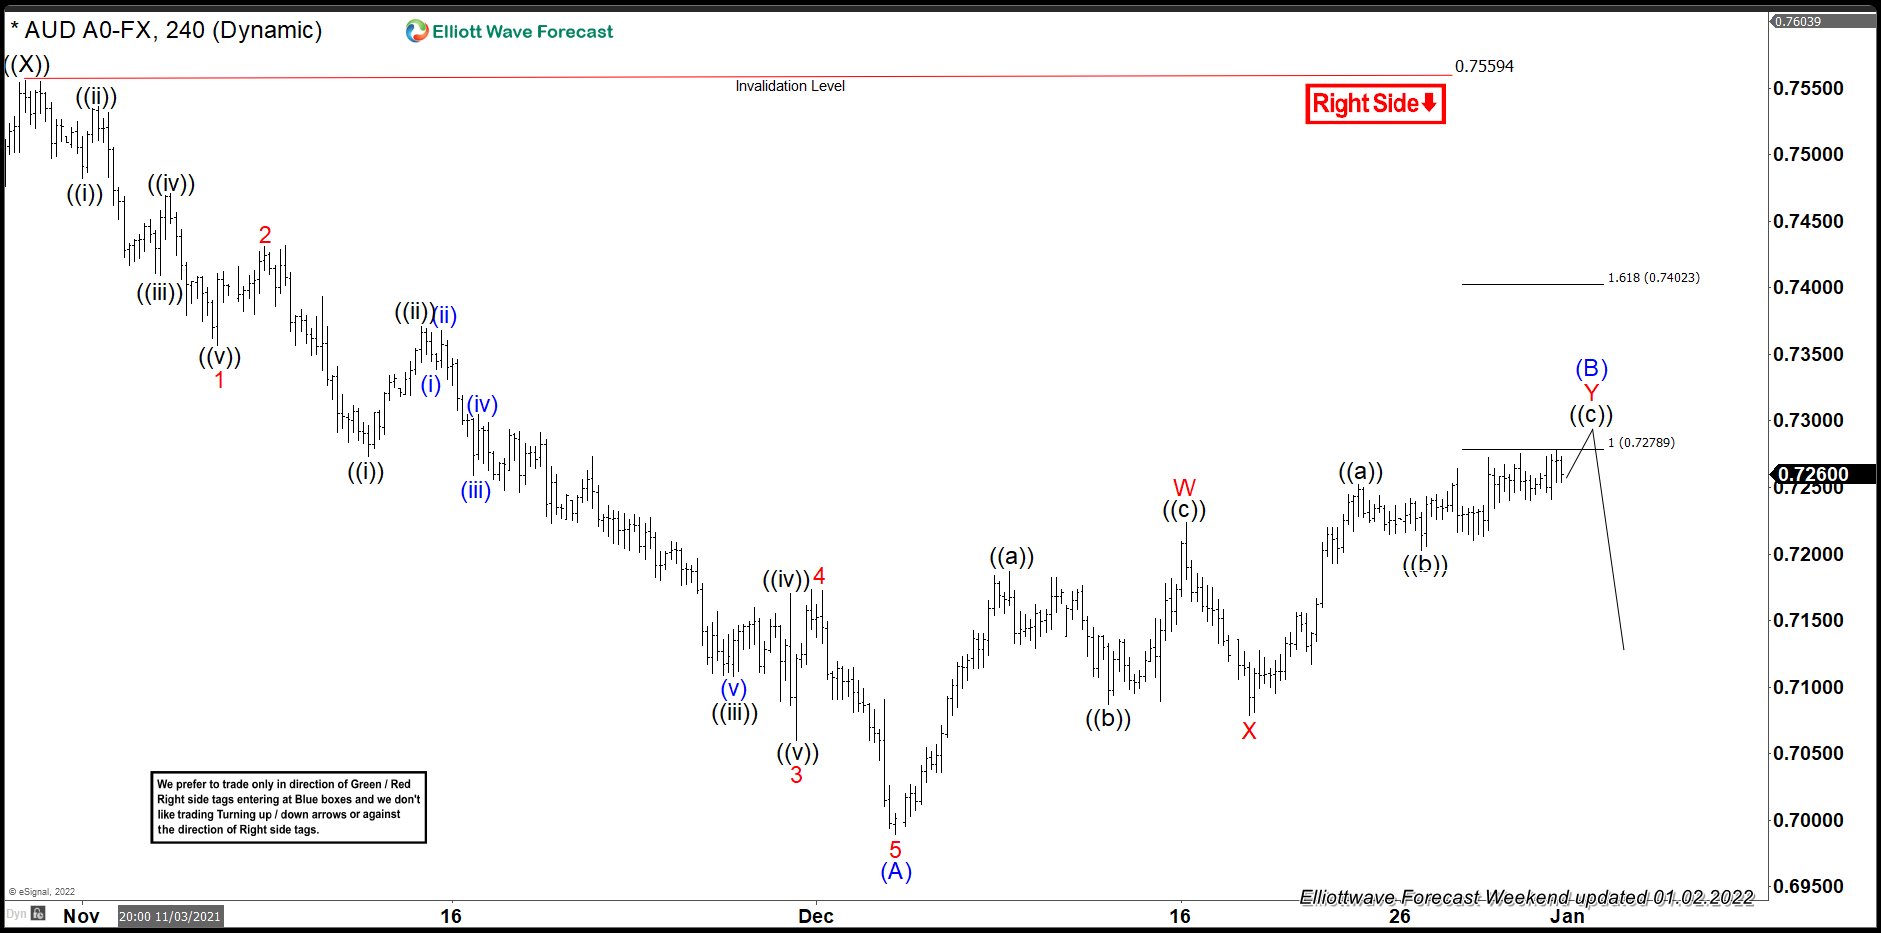
AUDUSD Forecasting The Decline After Elliott Wave Double Three Pattern
Read MoreHello fellow traders. In this technical blog we’re going to take a quick look at the Elliott Wave charts of AUDUSD Forex Pair published in members area of the Elliottwave-Forecast . As our members know, AUDUSD s is showing lower low sequences in the cycle from the February 25th peak. Recently we got recovery which […]
-
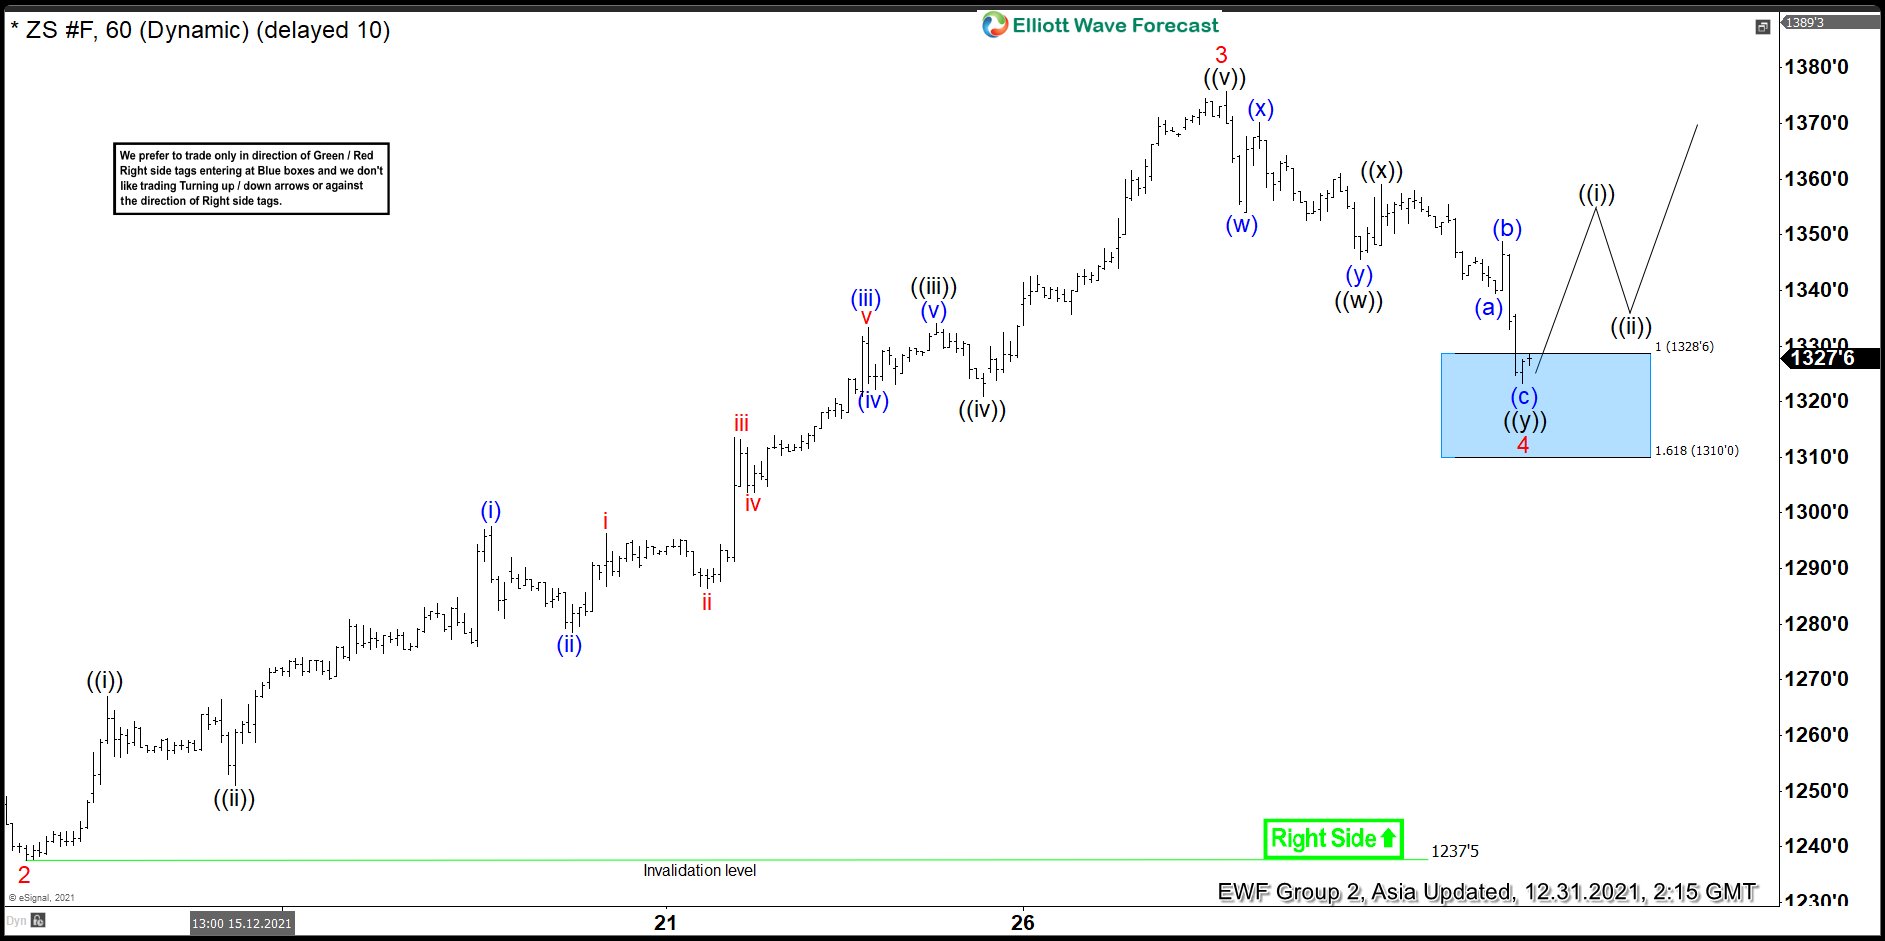
Soybeans Futures ( $ZS_F ) Buying The Dips At The Blue Box Area
Read MoreSoybeans Futures ( $ZS_F ) is another instrument that has given us trading opportunities lately . The commodity is showing impulsive bullish sequences in the cycle from the November’s 1181’3 low. Recently it made clear 3 waves pull back and found buyers at the blue box as we expected. In this technical blog we’re going […]
-
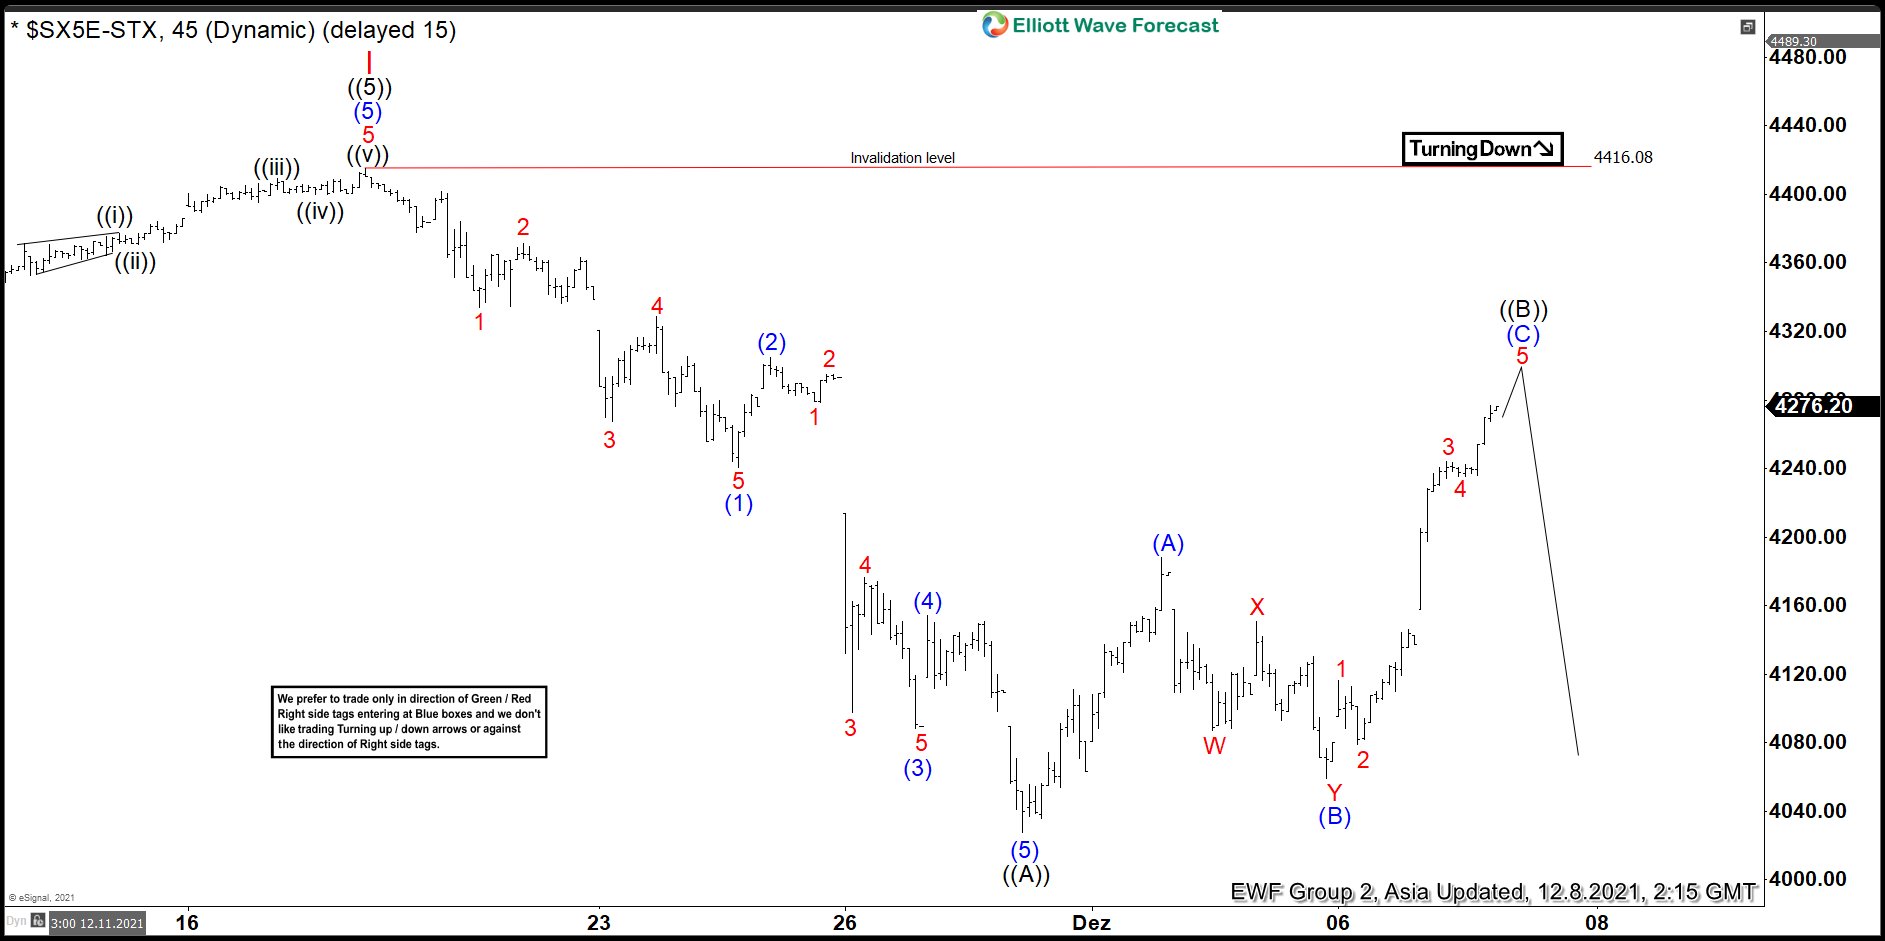
Eurostoxx (SX5E) Elliott Wave: Forecasting The Path
Read MoreHello fellow traders. In this technical blog we’re going to take a quick look at the Elliott Wave charts of Eurostoxx $ SX5E published in members area of the website. As our members know, we were calling the decline after 3 waves recovery against the 4416.08 peak. In further text we’re going to explain Elliott Wave Forecast. […]
-
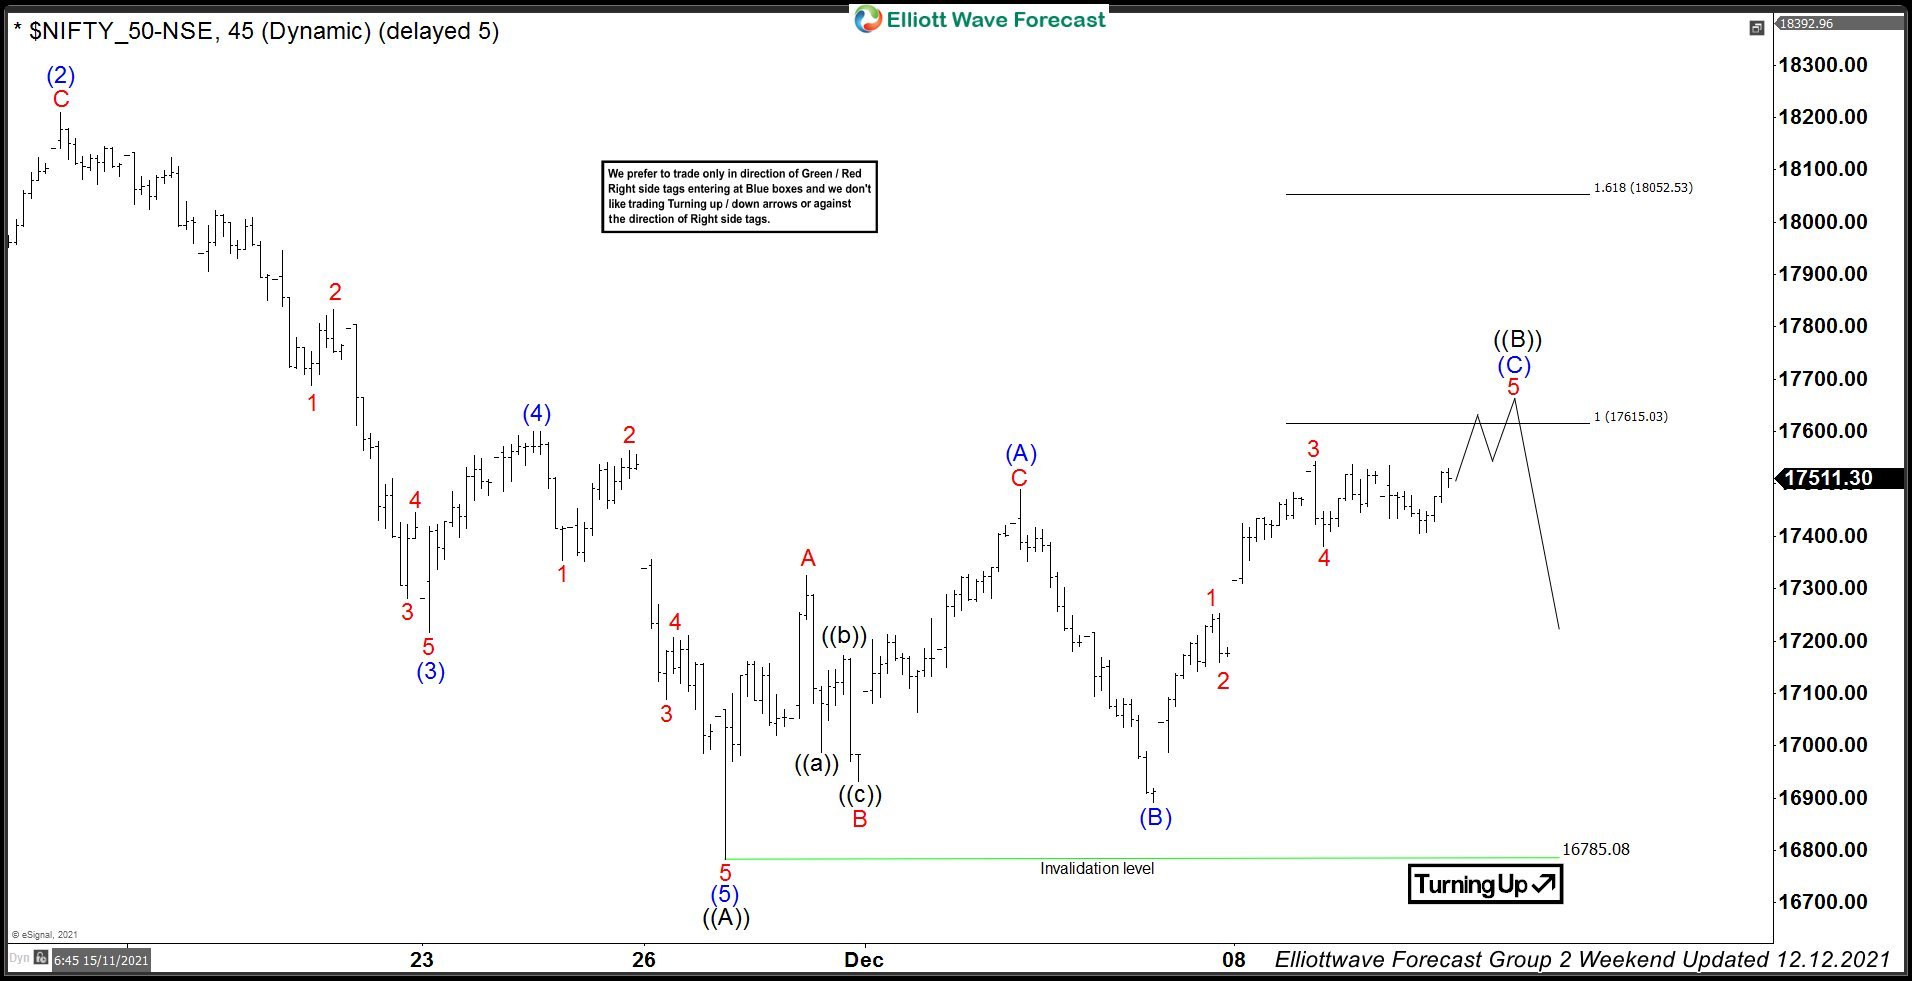
NIFTY Index Found Sellers After Elliott Wave Flat Pattern
Read MoreIn this technical blog we’re going to take a look at the Elliott Wave charts charts of NIFTY index published in members area of the website. Recently the Index corrected the cycle from the 18600 ( October ) peak. Recovery unfolded as Elliott Wave Flat structure. Once target area was reached, the index found sellers […]