
-
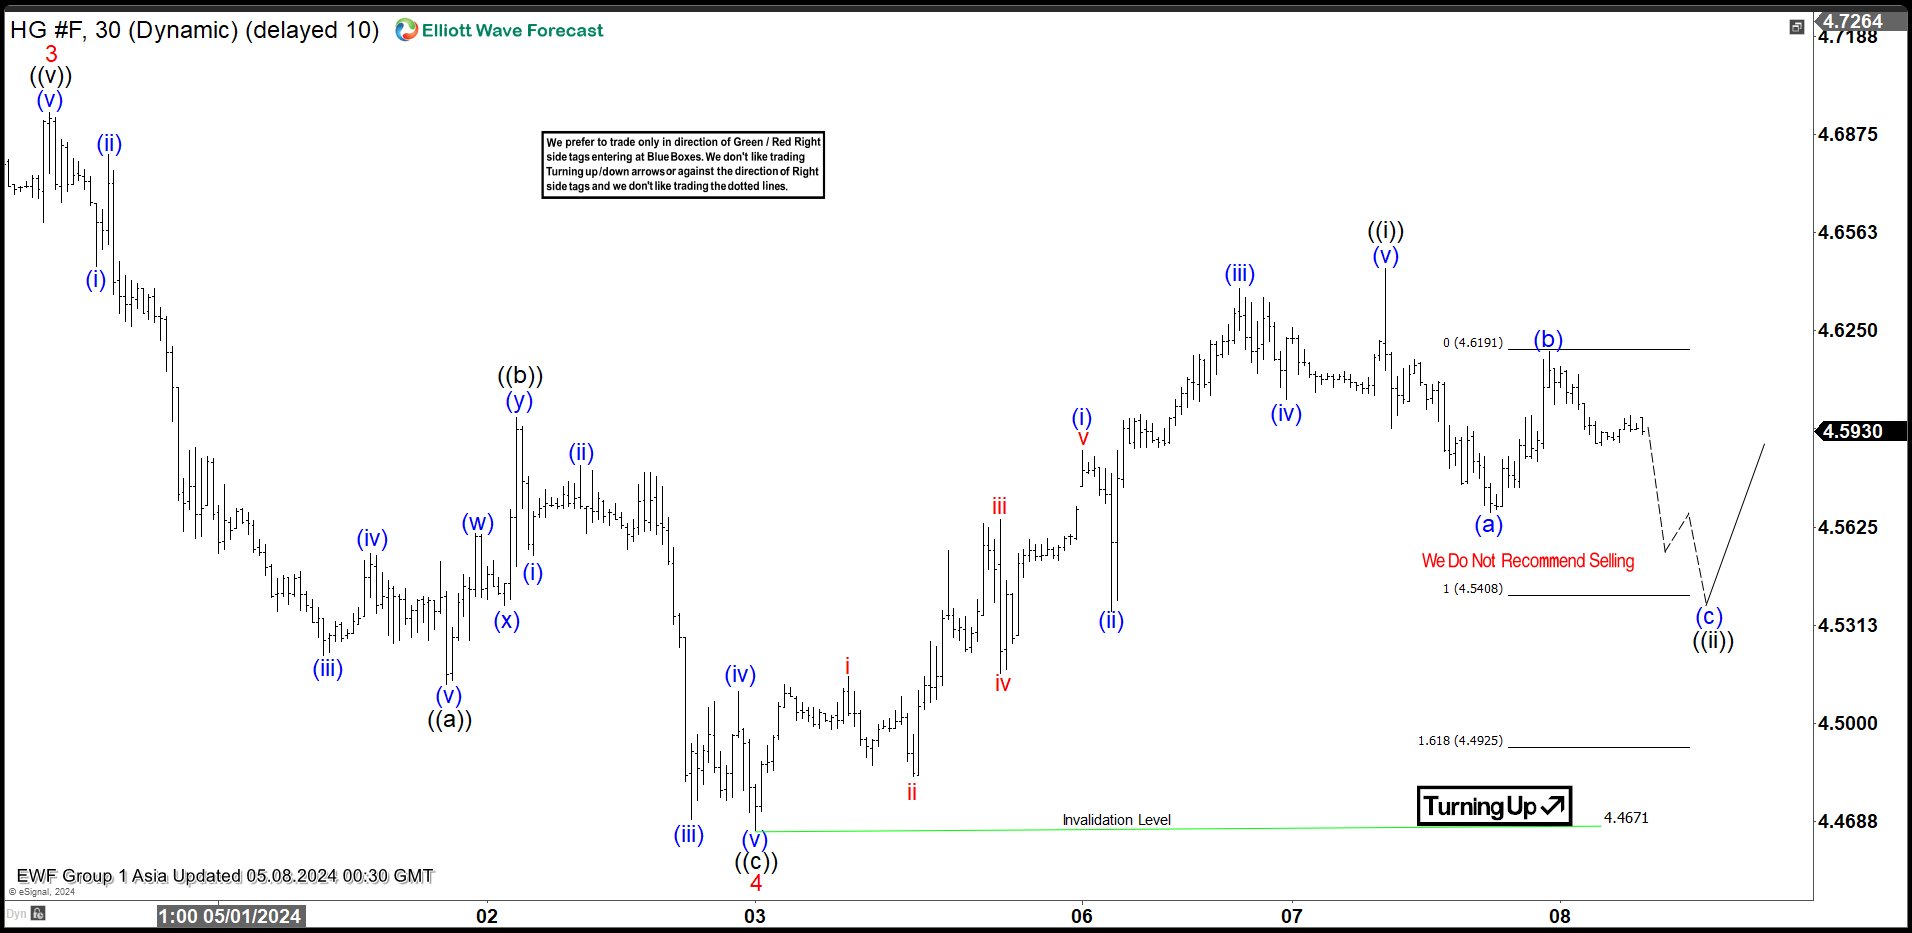
Copper (HG_F) Elliott Wave : Forecasting the Rally from the Equal Legs Zone
Read MoreIn this technical article we’re going to take a quick look at the Elliott Wave charts of Copper Futures HG_F, published in members area of the website. As our members know, Copper is showing impulsive bullish sequences in the cycle from the 3.6592 low. Consequently we are favoring the long positions at this stage. The […]
-
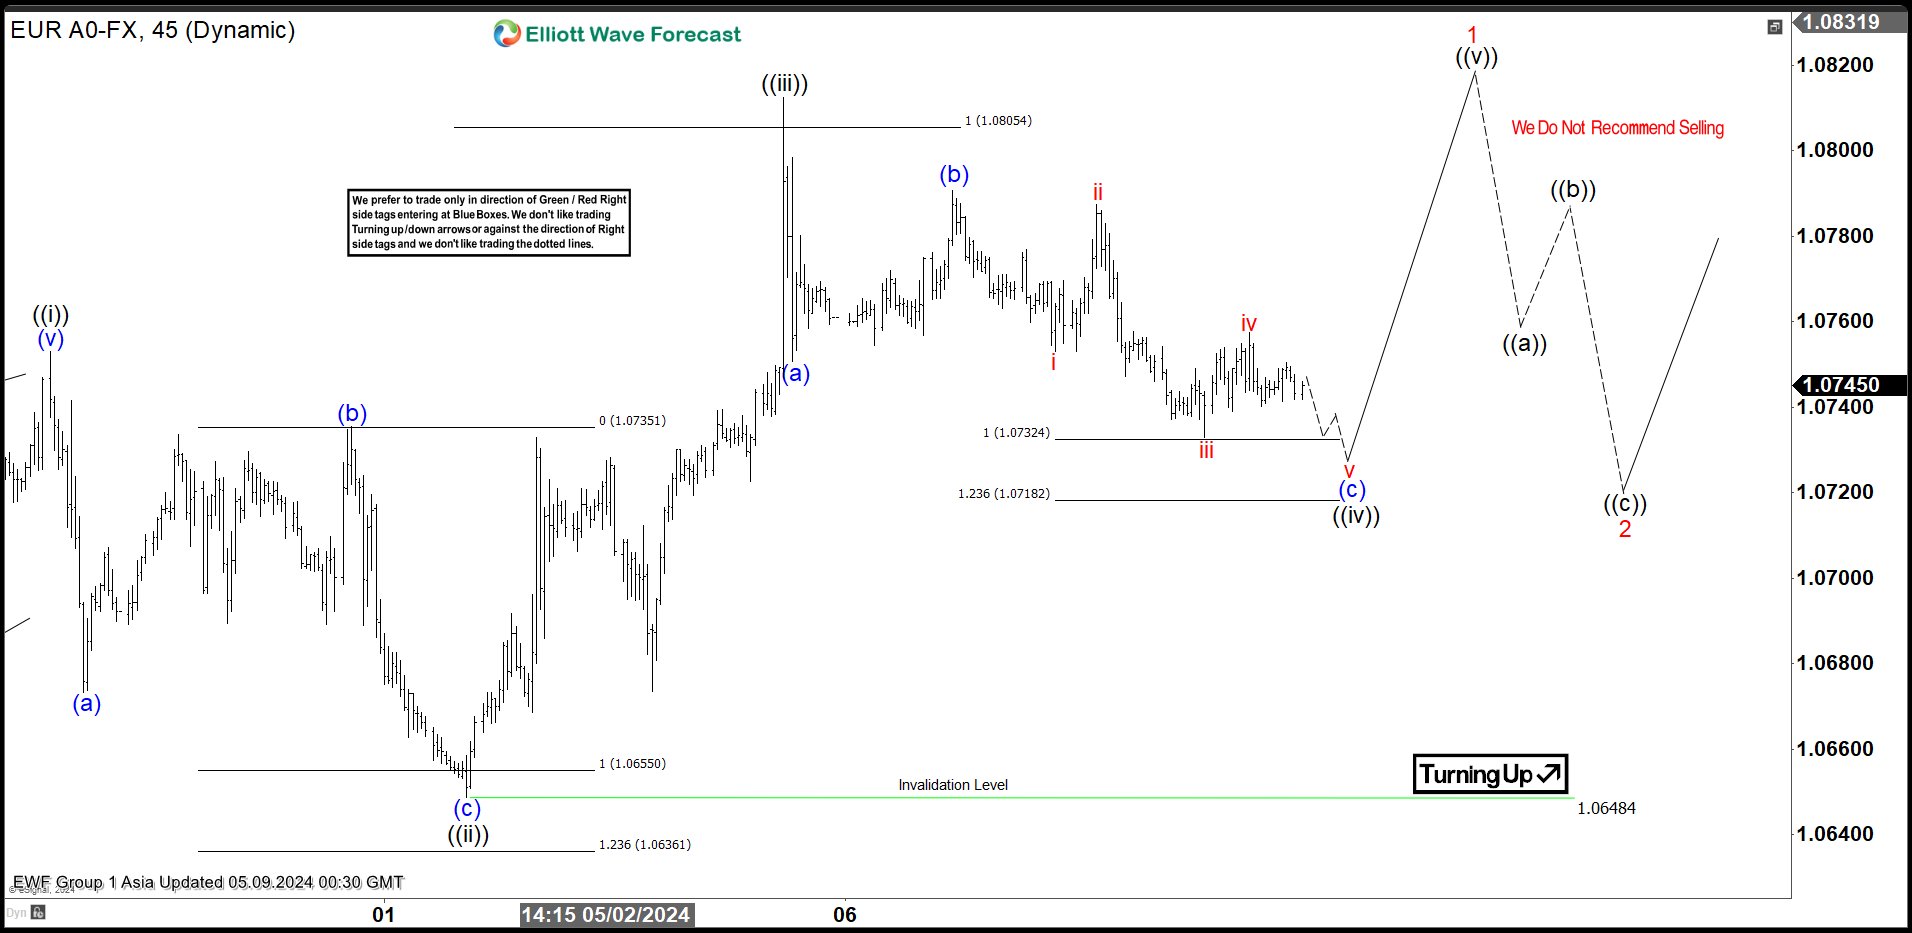
EURUSD Elliott Wave: Forecasting the Rally from Equal Legs Area
Read MoreGreetings fellow traders. In this technical article we’re going to take a quick look at the Elliott Wave charts of EURUSD, published in members area of the website. As our members know, EURUSD has ended the cycle from the December’s 2023 peak. The pair has recently pulled back in a 3-wave pattern, with buyers stepping […]
-
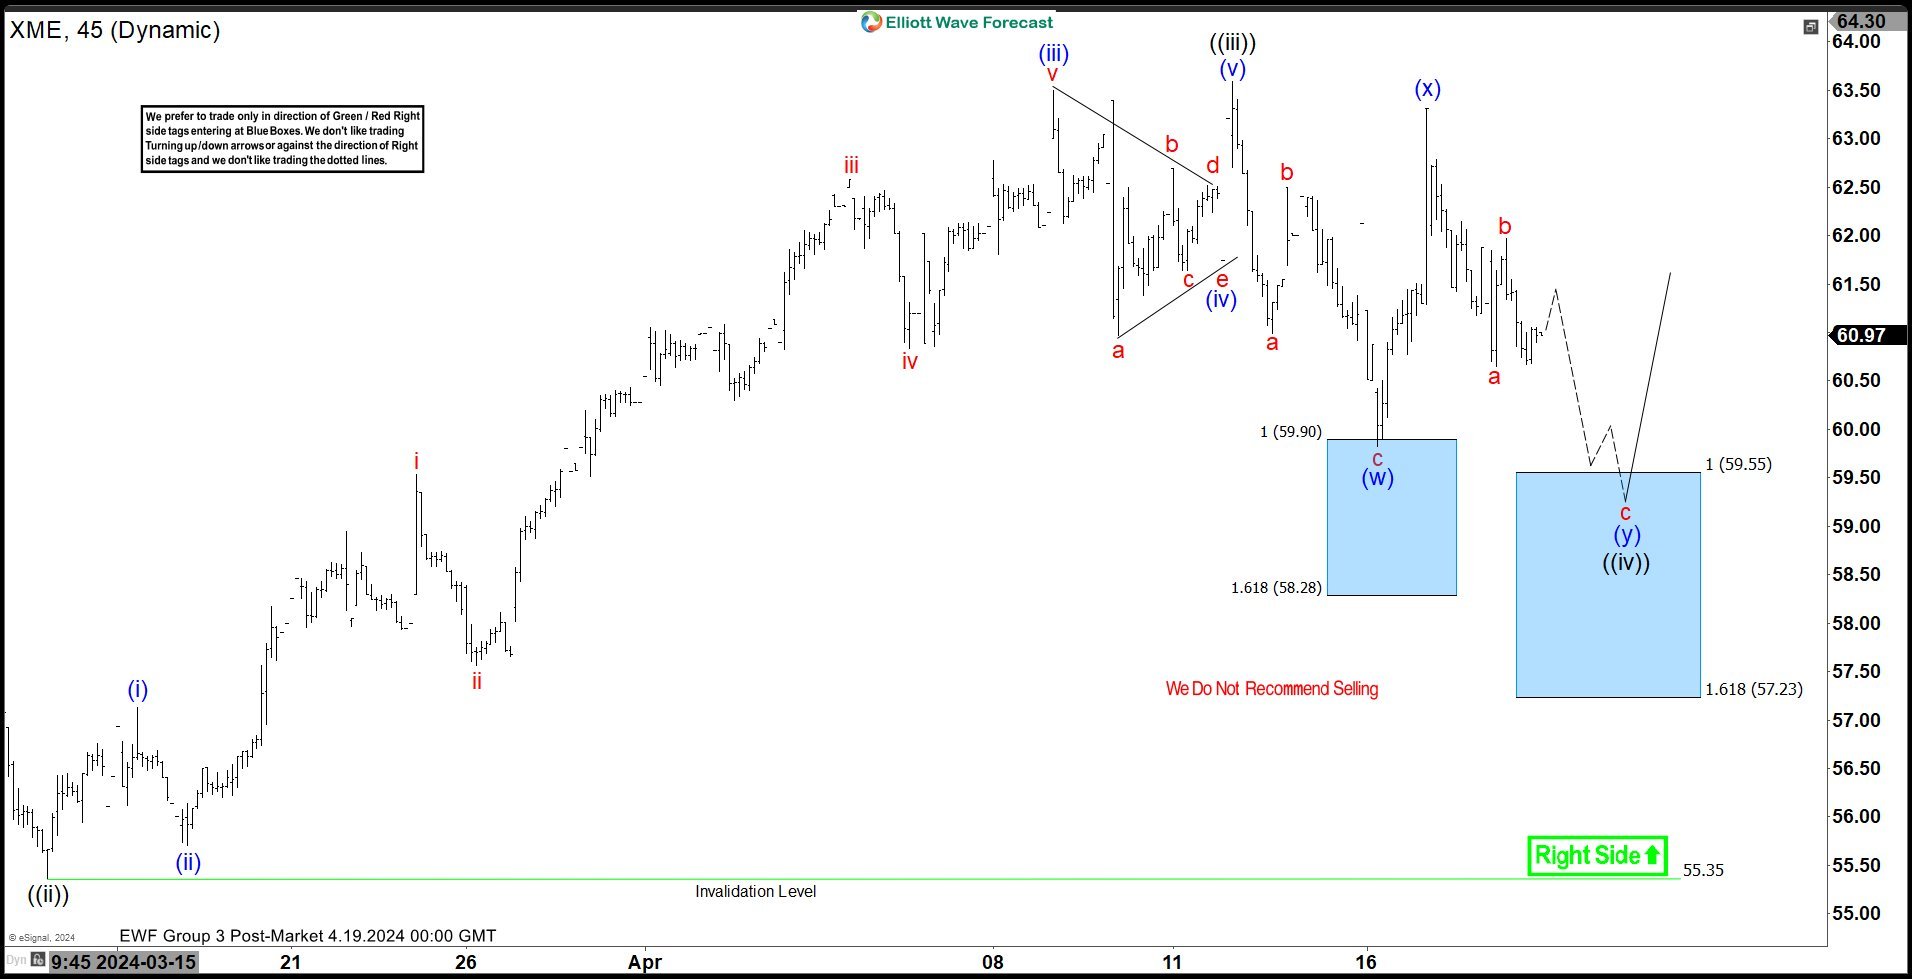
XME Elliott Wave : Buying The Dips at the Blue Box Area
Read MoreHello fellow traders. In this technical blog we’re going to take a quick look at the Elliott Wave charts of XME ETF, published in members area of the website. As our members know XME is showing impulsive bullish sequences and we have been favoring the long side of the ETF. Recently, we experienced a pullback […]
-
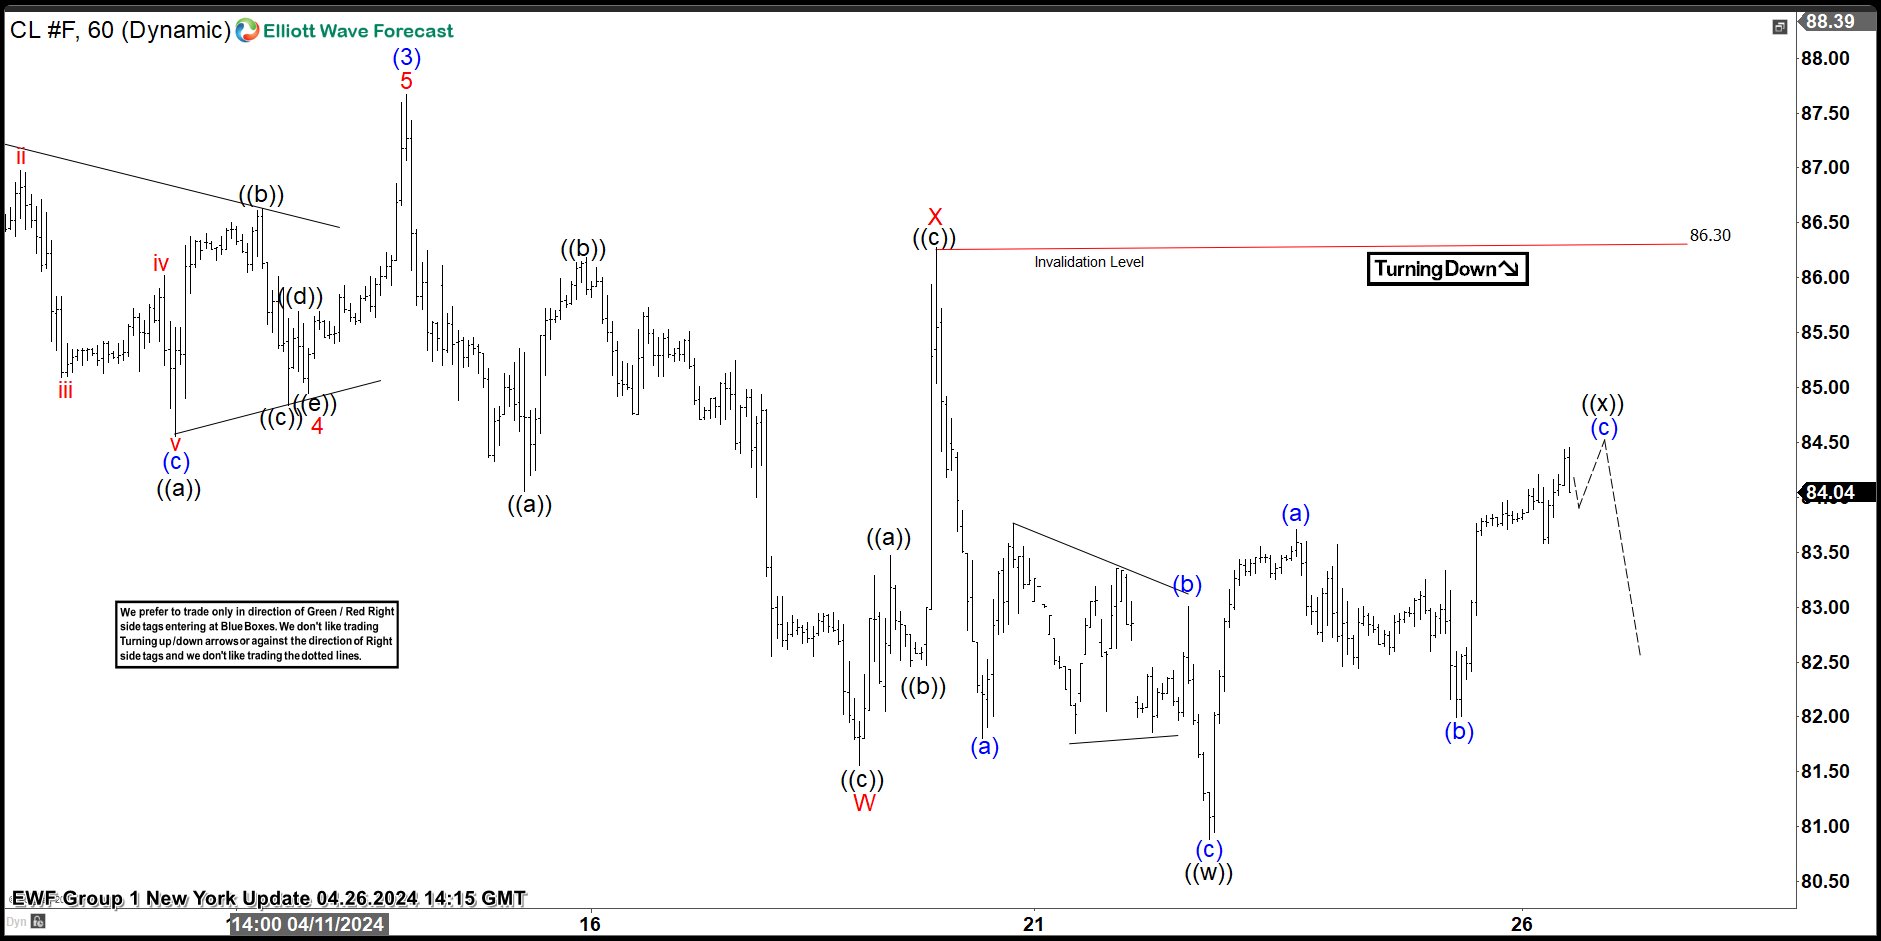
OIL (CL_F) Elliott Wave: Incomplete Sequences Forecasting The Path
Read MoreHello fellow traders. In this technical article we’re going to look at the Elliott Wave charts of Oil published in members area of the website. The commodity shows bullish sequences in the cycle from the 67.75 low. Consequently we are favoring the long side and recommending members to keep buying the dips in 3,7,11 swings when […]
-
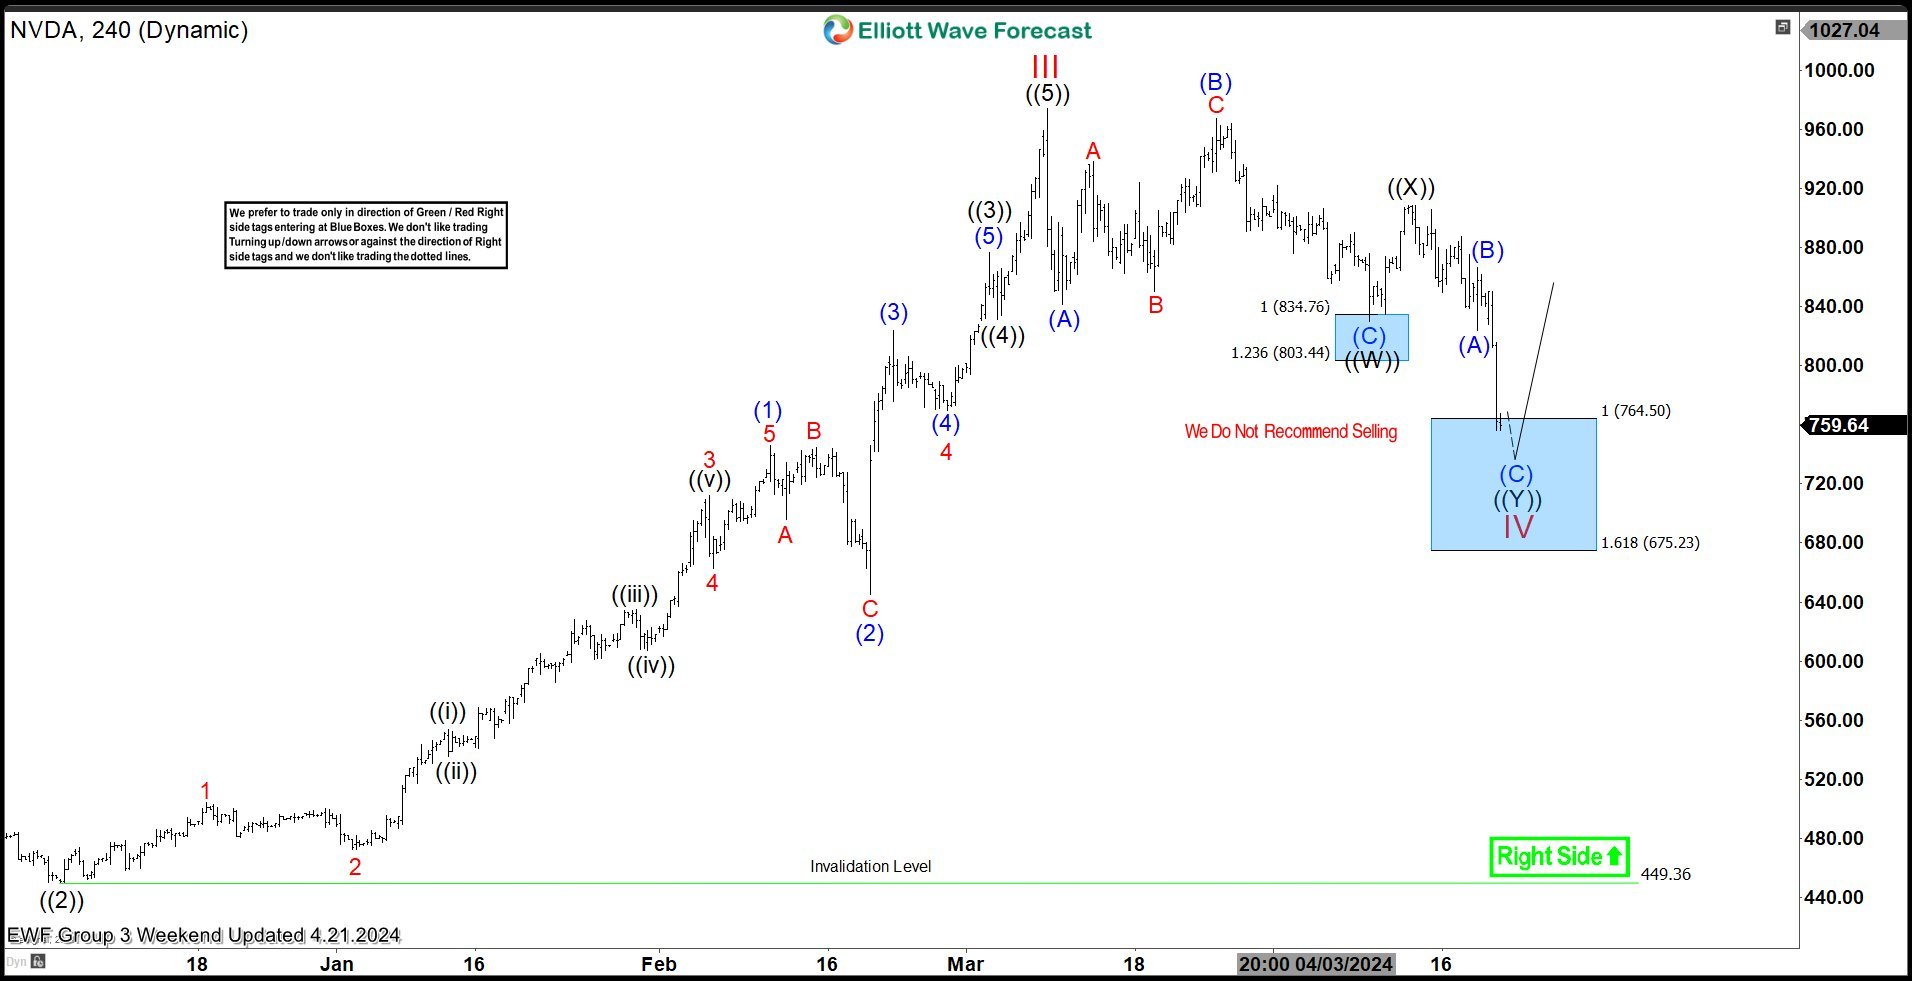
NVIDIA (NVDA) Buying The Dips After Elliott Wave Double Three Pattern
Read MoreHello fellow traders. In this technical article we’re going to take a look at the Elliott Wave charts charts of NVIDIA (NVDA) Stock published in members area of the website. Our members are aware of the numerous positive trading setups we’ve had among Stocks and Indices recently. One of them is NVIDIA , which made […]
-
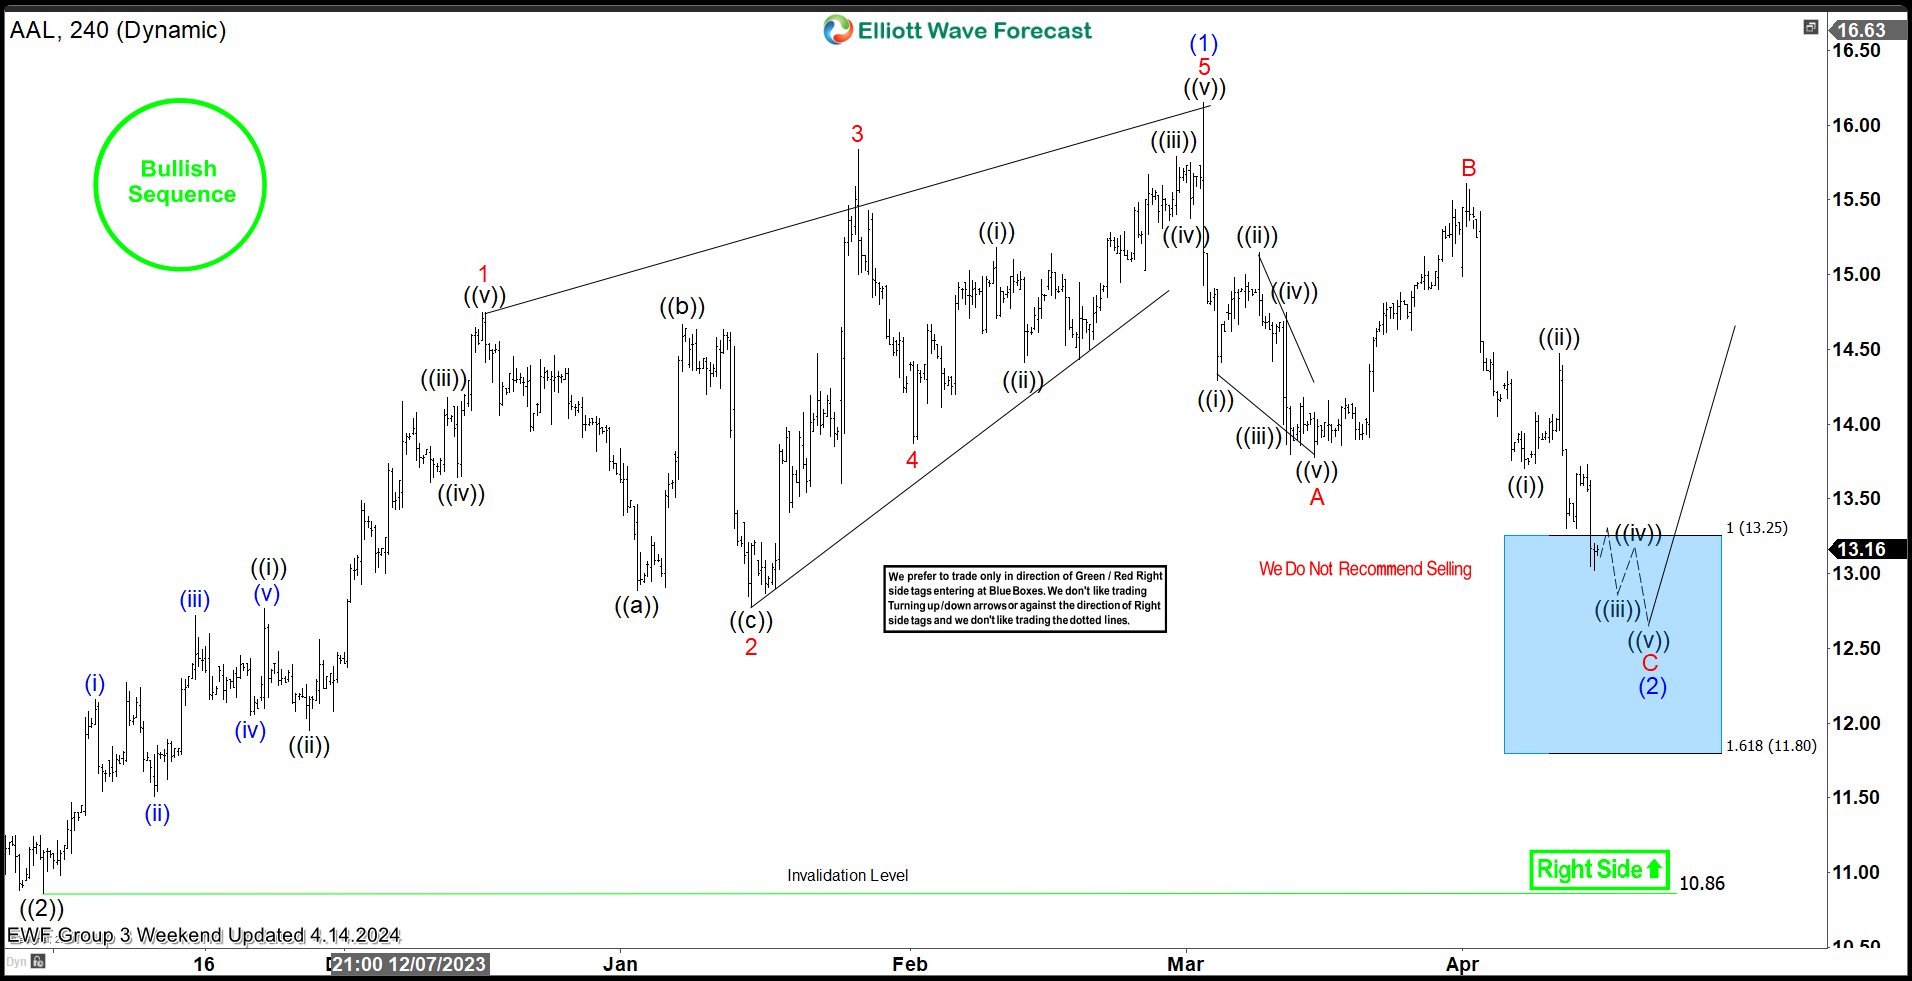
American Airlines (AAL) : Buying The Stock at the Blue Box
Read MoreHello fellow traders, As our members know we have had many profitable trading setups recently. In this technical article, we are going to present another Elliott Wave trading setup we got in American Airlines (AAL) . The stock completed correction precisely at the Equal Legs zone, referred to as the Blue Box Area. In the […]