
-
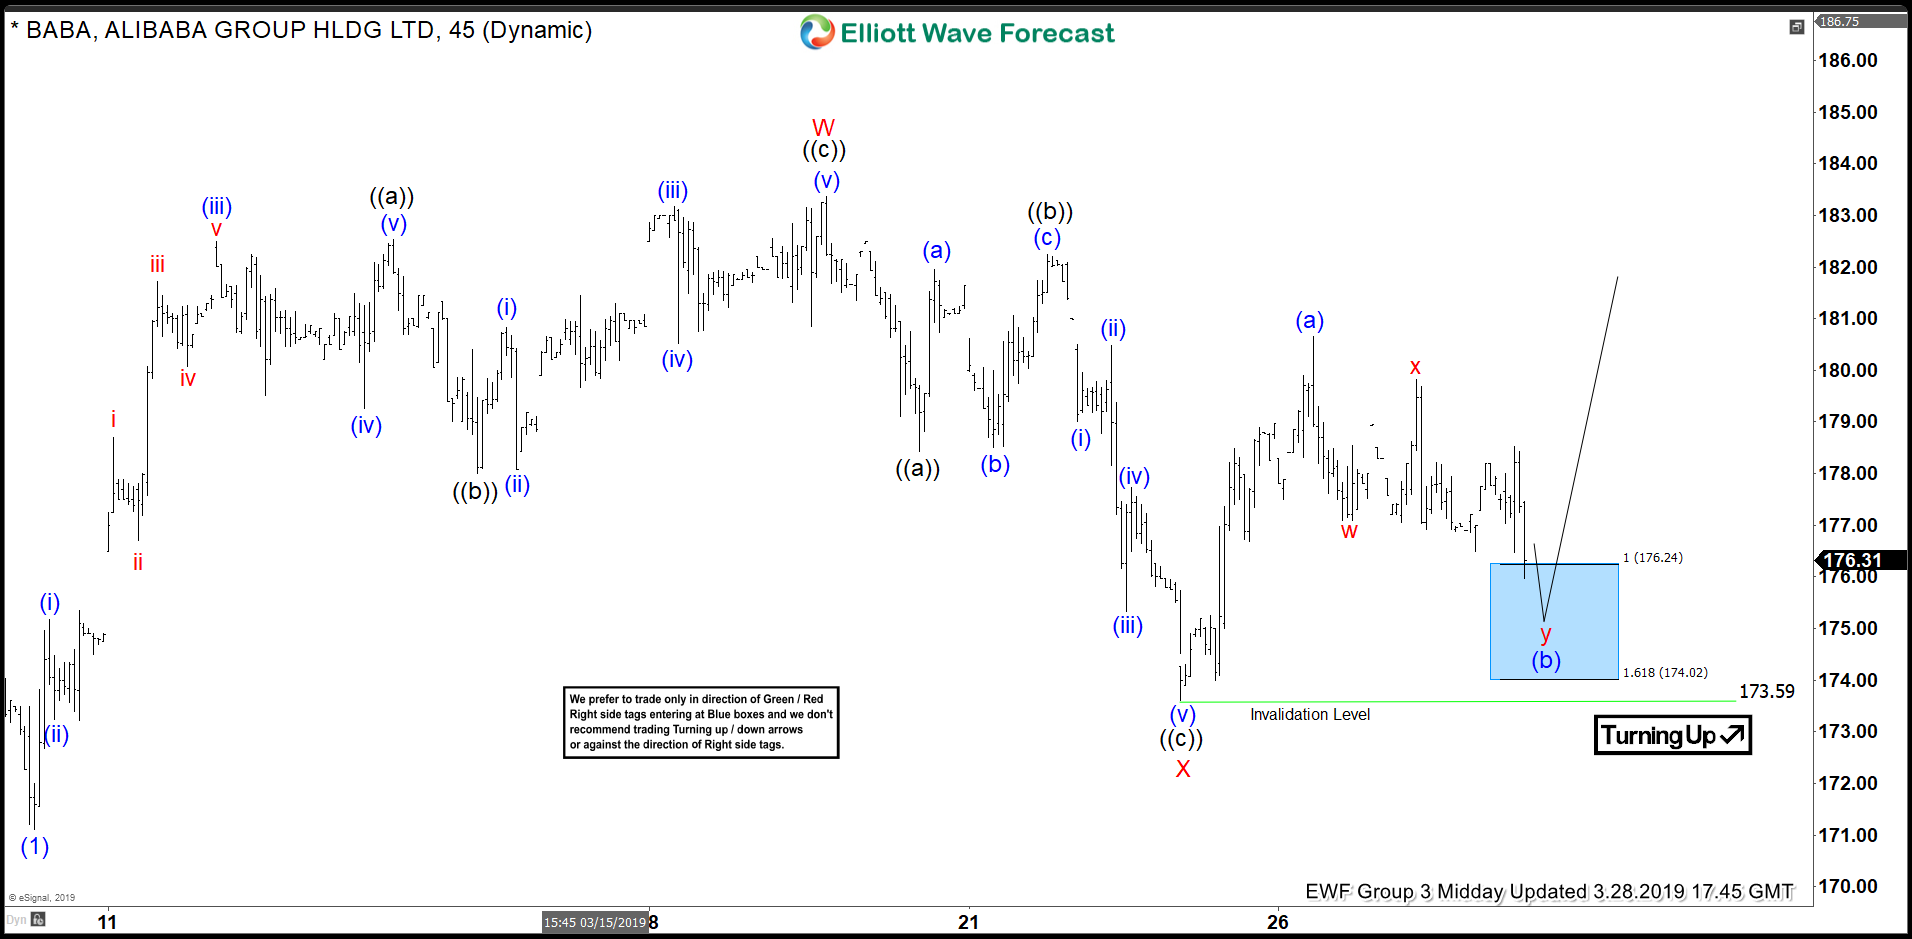
BABA Elliott Wave View: Found Buyers in Blue Box and Rallied
Read MoreHello fellow traders. Today, I want to share some Elliott Wave charts of the BABA stock which we presented to our members in the past. Below, you see the 1-hour updated chart presented to our clients on the 03/28/19. showing that BABA ended the cycle from 03/07/19 low (171.55) at the peak of 03/19/19 (183.48) in red wave […]
-
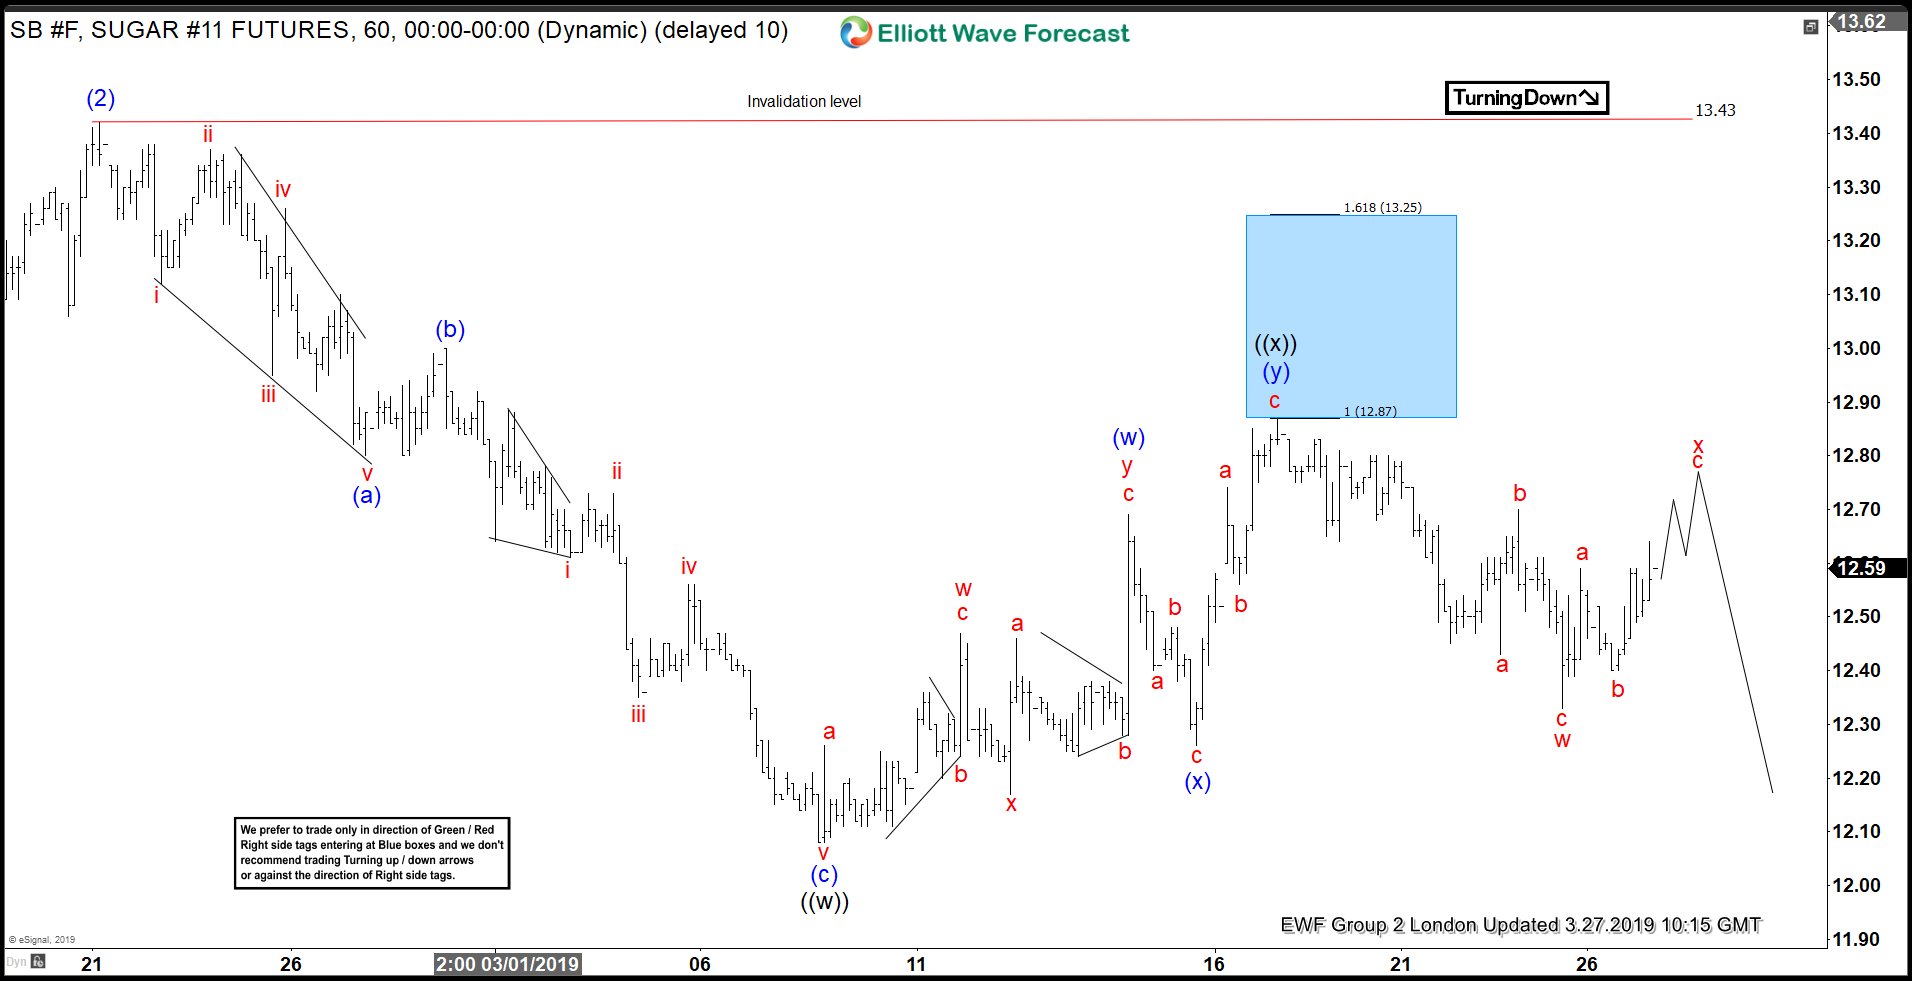
Sugar Elliott Wave Analysis: Calling The Reaction from Inflection Area
Read MoreI want to share with you Elliott Wave charts of Sugar which we presented to our members recently. You see the 1-hour updated chart presented to our clients on the 03/18/19. The higher degree trend of the pair is to the downside. So our members know that the right side is to the downside in the daily […]
-
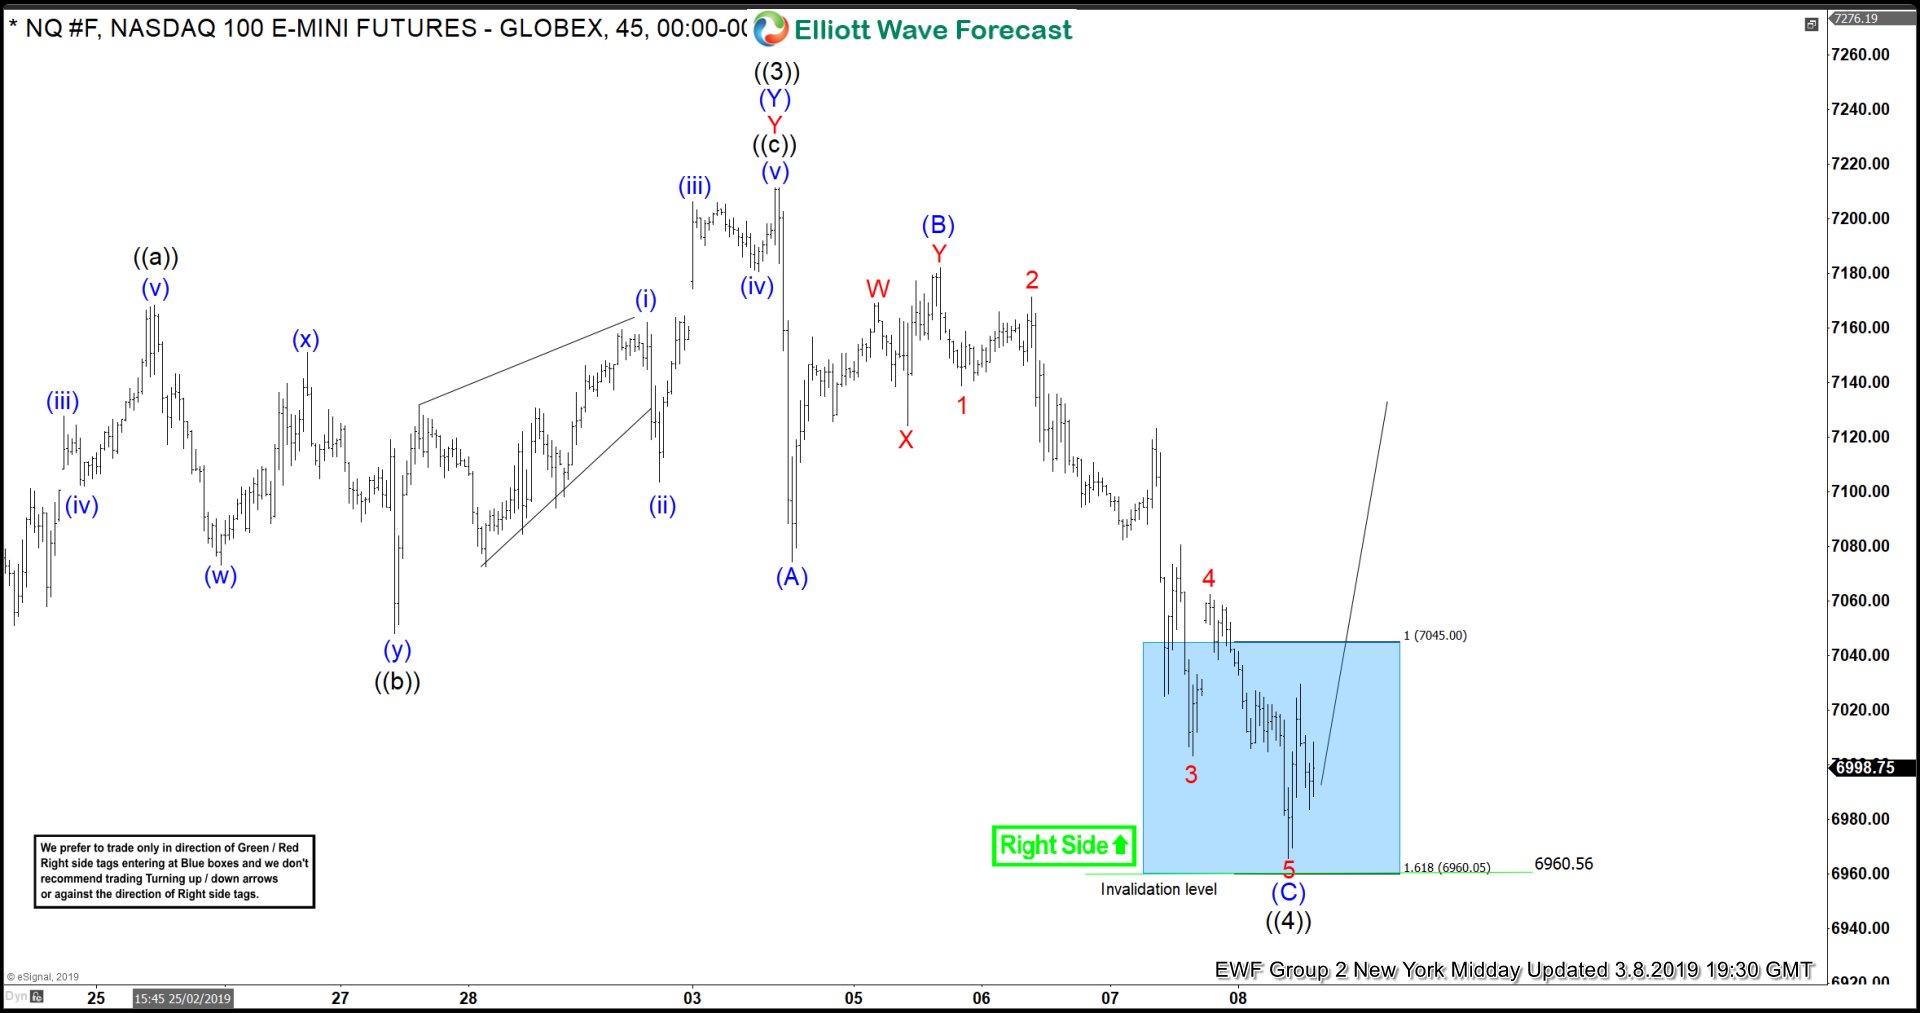
Elliott Wave View: High Frequency Box Suggested NASDAQ Rally
Read MoreHello fellow traders. Today, I want to share some Elliott Wave charts of Nasdaq Futures (NQ_F) which we presented to our members in the past. Below, you see the 1-hour updated chart presented to our clients on the 03/08/19. showing that the Index has a 1 Hour right side tag against 6960.56 low. In the 1H chart we […]
-
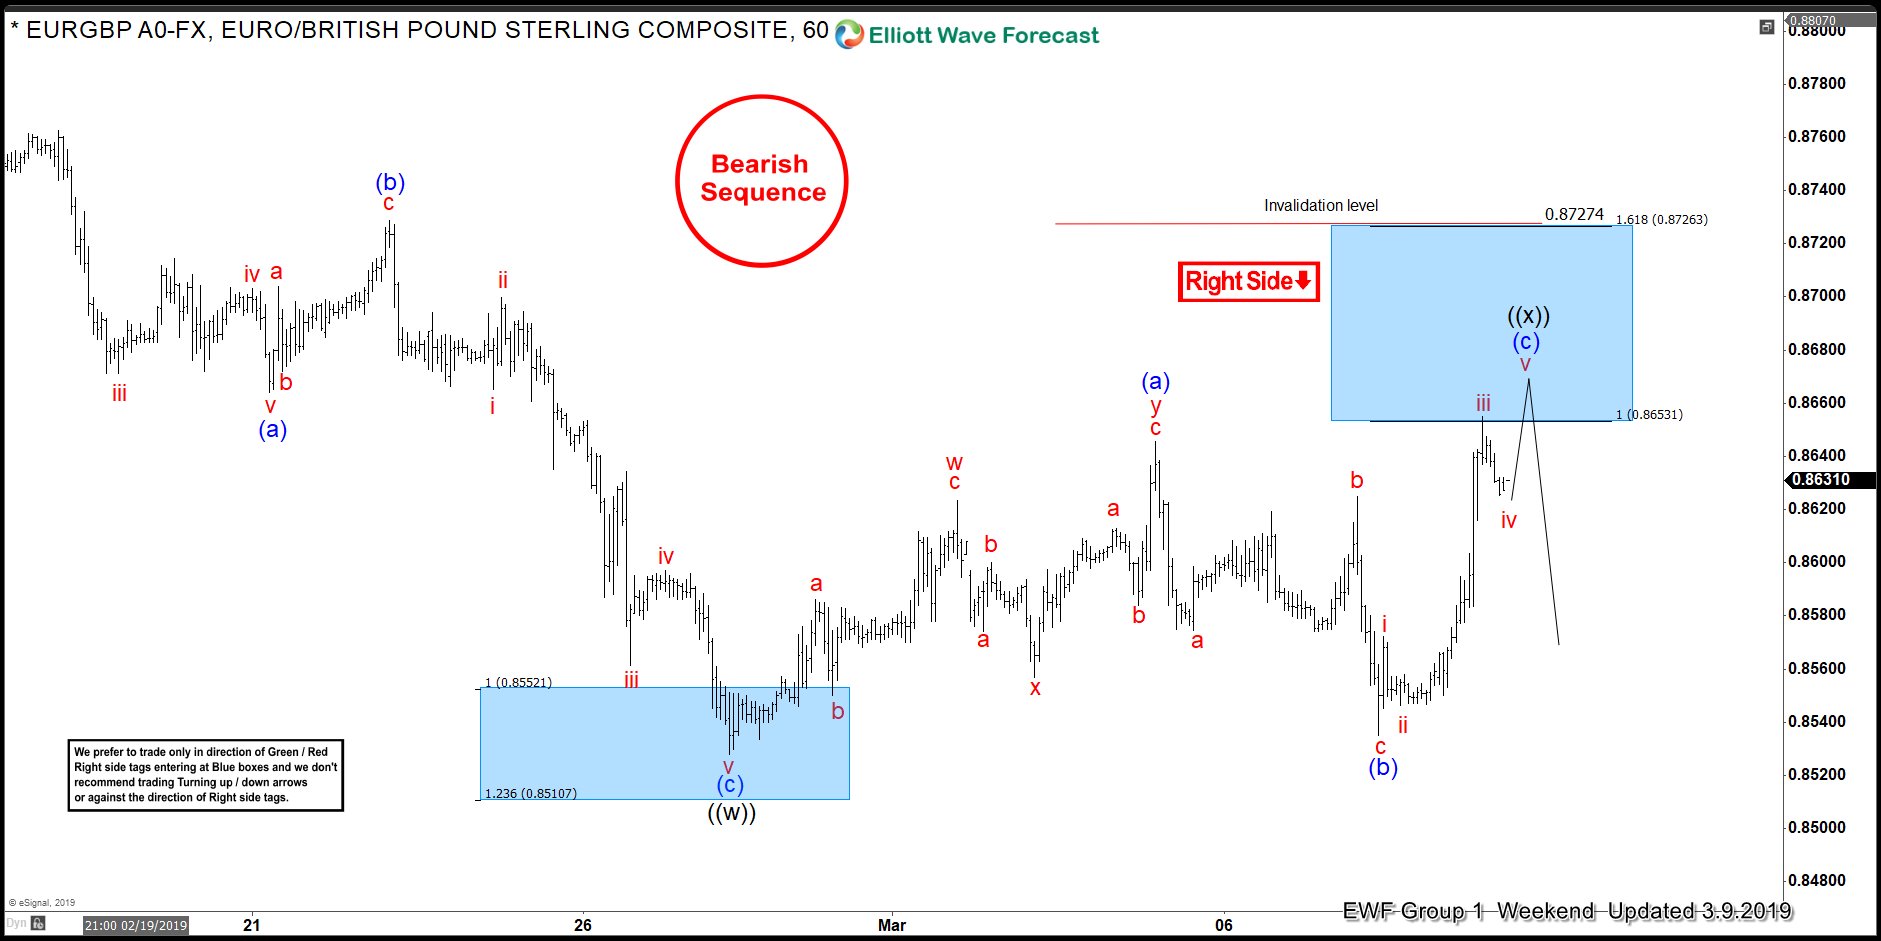
Elliott Wave Analysis: Trading EURGBP with Right Side System
Read MoreIn this blog, I want to share with you some Elliott Wave charts of EURGBP which we presented to our members recently. You see the 1-hour updated chart presented to our clients on the 03/09/19. The higher degree trend of the pair is to the downside. So our members know that the right side is to the downside. […]
-
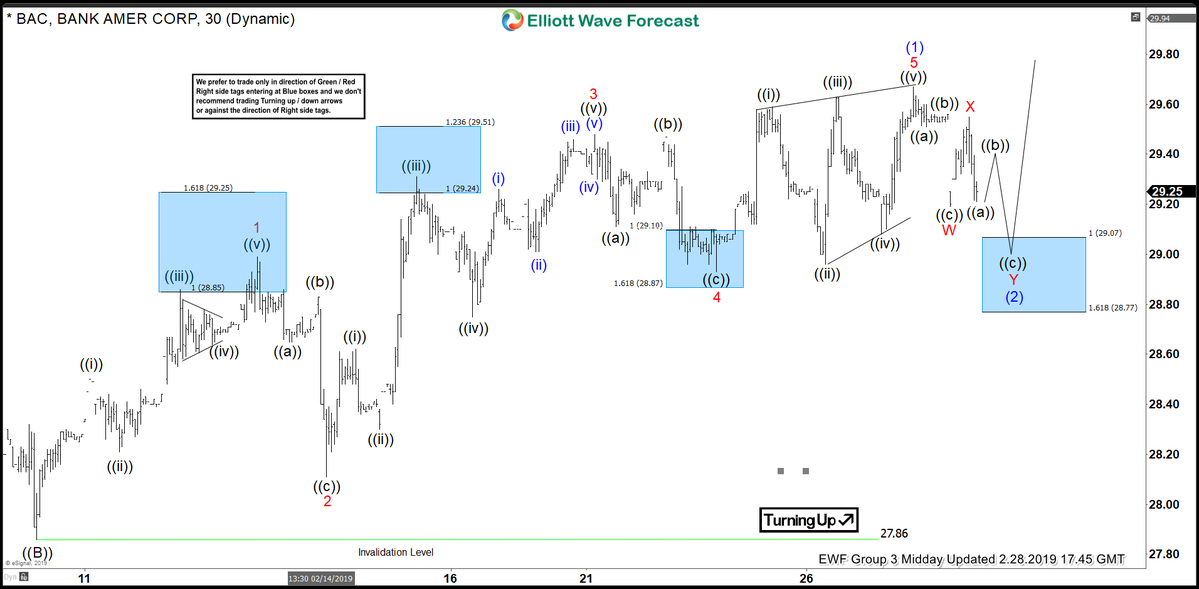
BAC Elliott Wave Analysis: Calling The Reaction From Inflection Area
Read MoreIn today’s blog we will look at Bank of America’s chart (BAC) which shows a blue box. This blue box represents inflection area where a reaction in 3 waves at least can happen. Below, you see the 1-hour updated chart presented to our clients on the 02/28/19. From 02/08/19 low (27.88) the stock ended the cycle at 01/27/19 […]
-
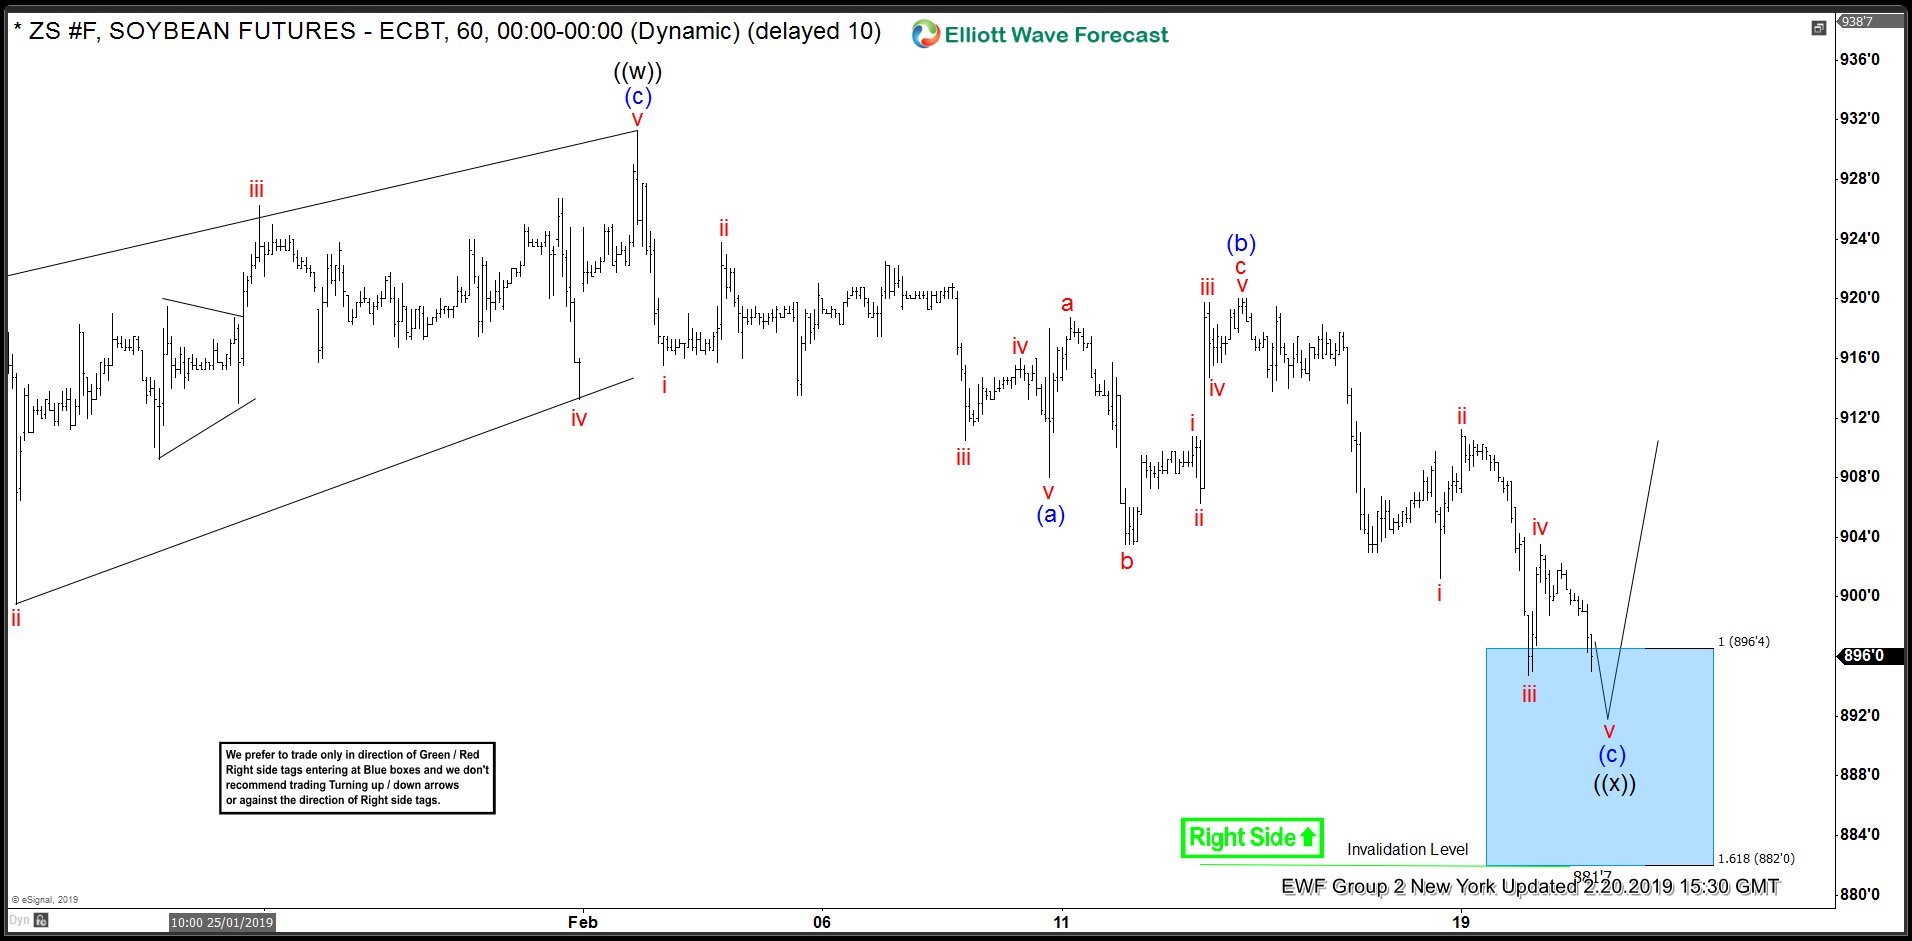
Soybean Futures (ZS_F) Analysis : Found Buyers in Blue Box
Read MoreHello fellow traders. Today, I want to share some Elliott Wave charts of Soybean (ZS_F) which we presented to our members in the past. Below, you see the 1-hour updated chart presented to our clients on the 02/20/19. showing that ZS has a 1 Hour right side tag against 882 low. From 12/27/18 low (867.2) ZS ended […]