
-
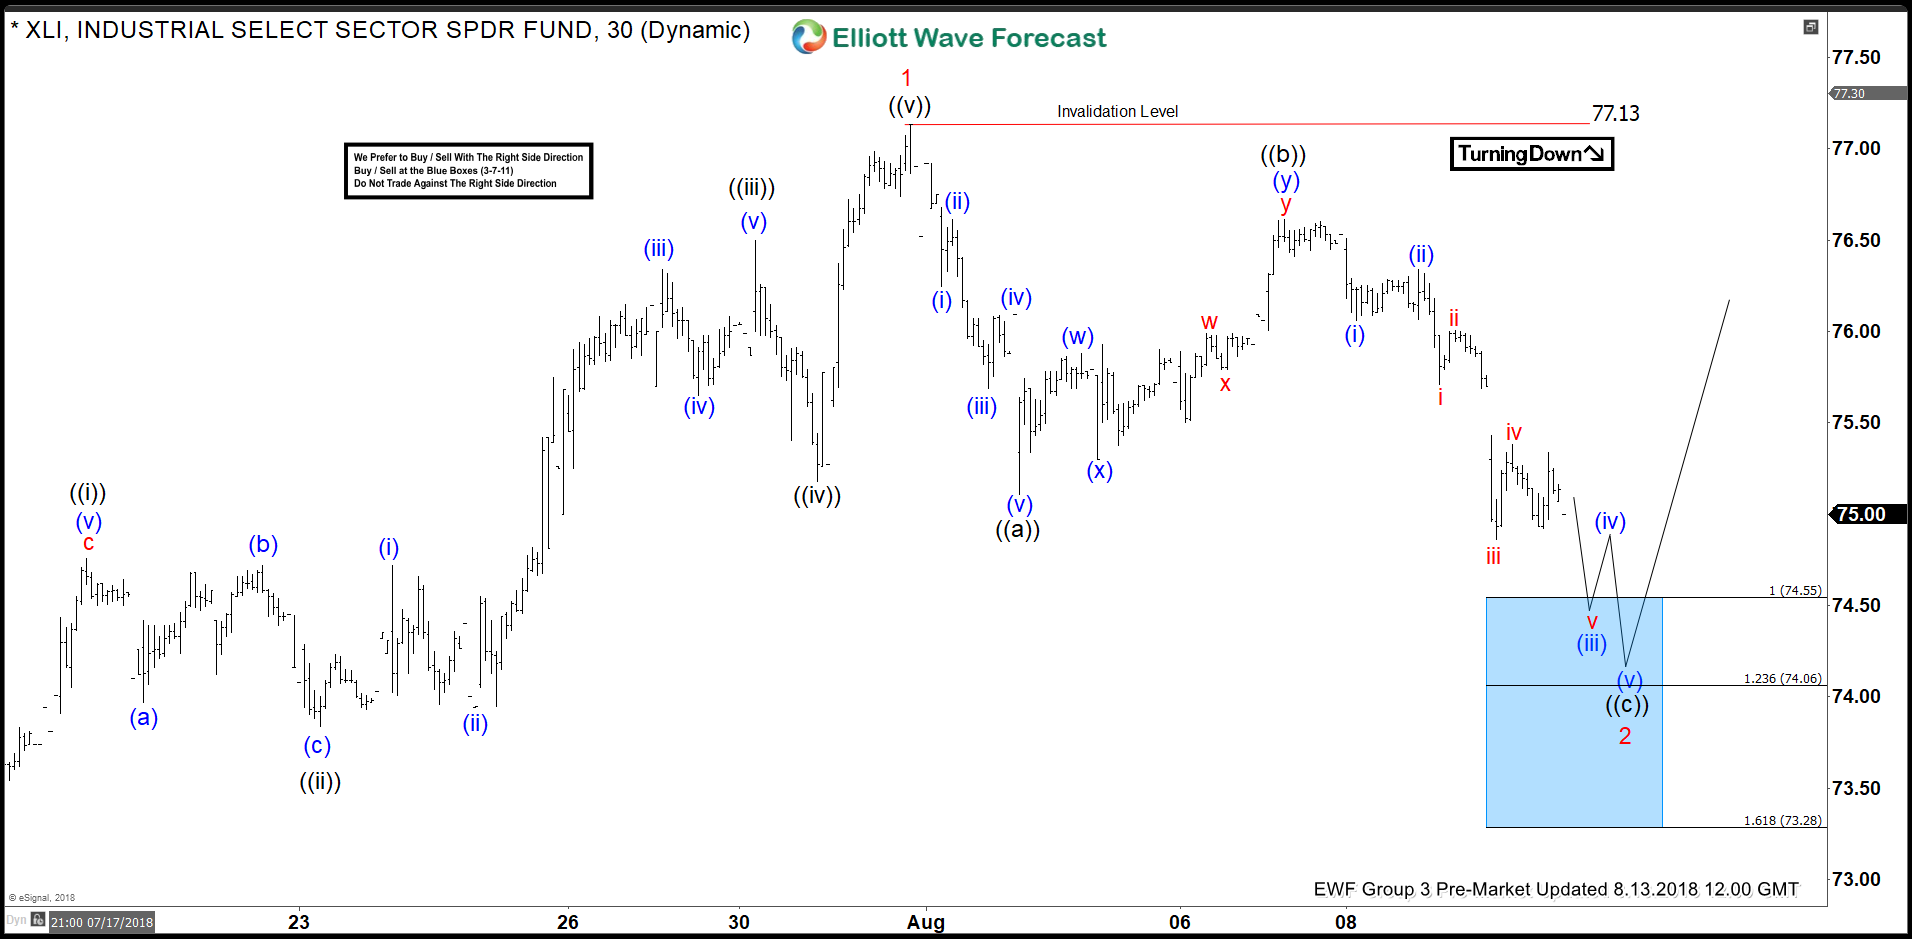
XLI Elliott Wave Analysis: Inflection Area Called The Rally
Read MoreHello fellow traders. In this blog, we will have a look at some past Elliott Wave charts of the Industrial Select Sector (XLI) which we presented to our members in the past. Below, you see the 1-hour updated chart presented to our clients on the 08/13/18 showing that XLI ended the cycle from 06/27 low in red wave 1. As […]
-
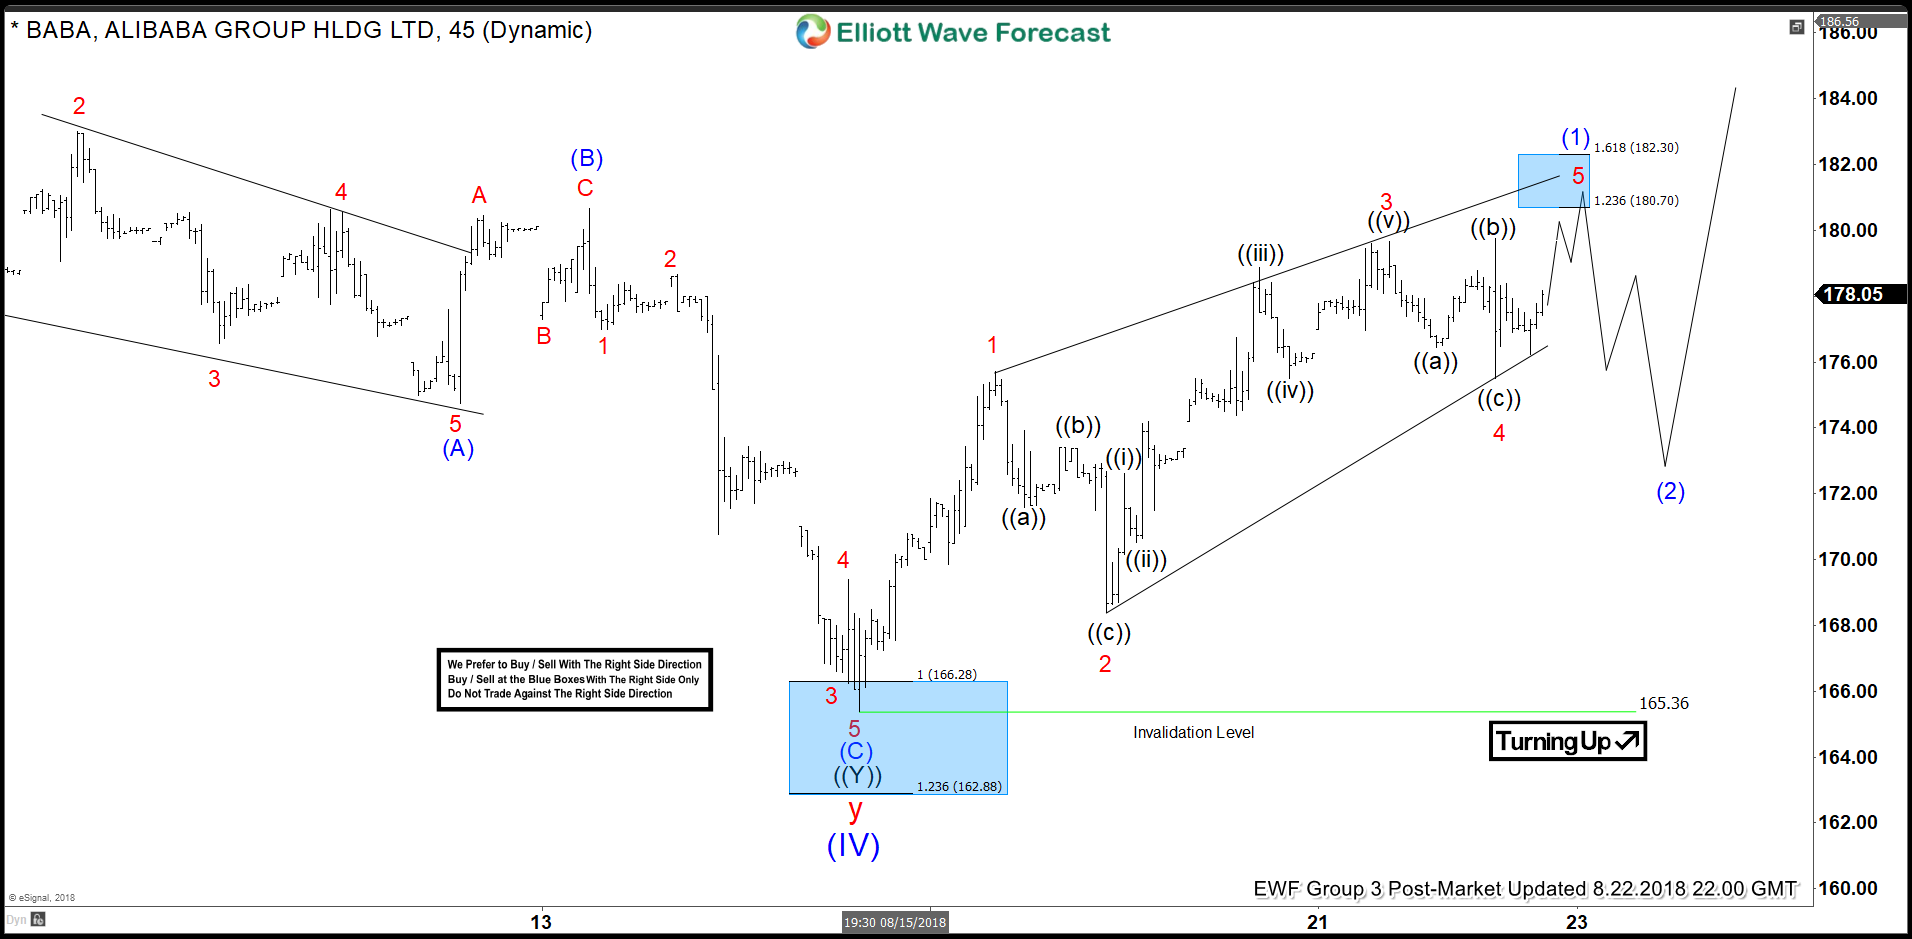
BABA Elliott Wave View: Found Buyers in Blue Box and Rallied
Read MoreIn this blog, we will have a look at some recent short-term Elliott Wave charts of BABA which we presented to our members in the past. Below, you see the 1-hour updated chart presented to our clients on the 08/19/18 indicating that BABA ended the cycle from 06/05 low in blue wave (IV). BABA ended the long-term […]
-
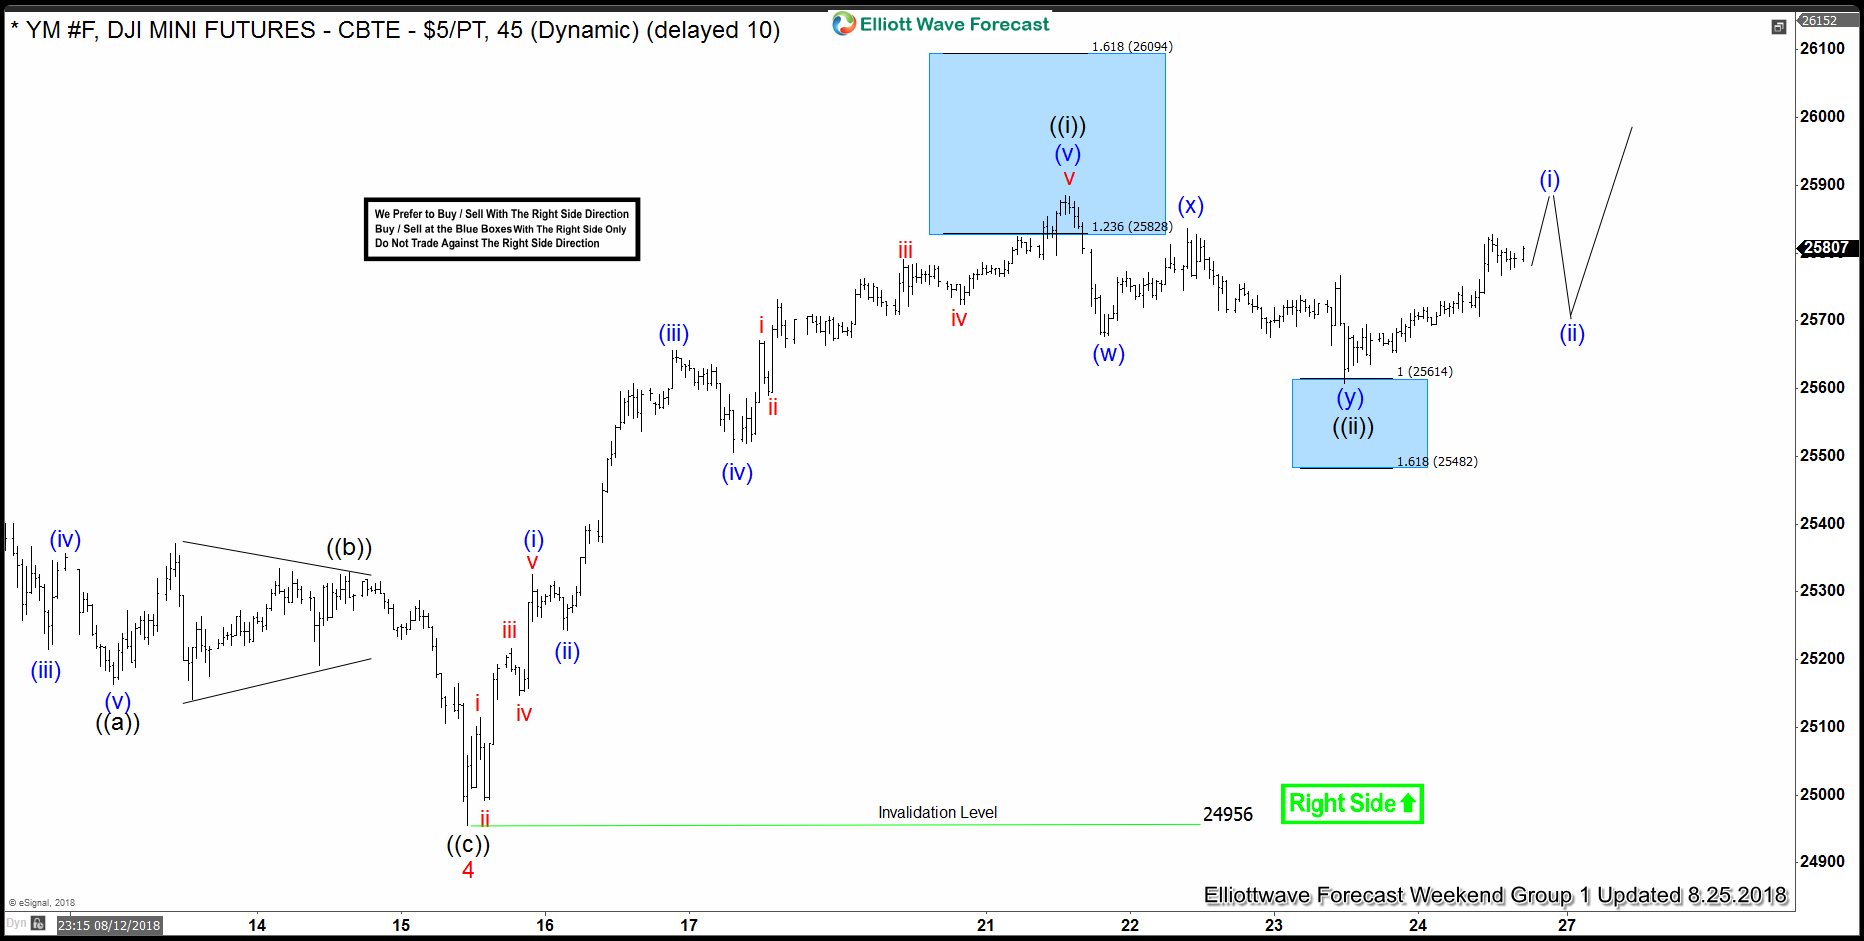
Dow Jones Futures Elliott Wave View: Reacting Higher From Blue Box
Read MoreHello fellow Traders. In this blog, we will have a look at some recent short-term Elliott Wave charts of the Dow Jones Industrial which we presented to our members in the past. Below, you see the 1-hour updated chart presented to our clients on the 08/23/18 indicating that Dow Jones ended the cycle from 08/15 low in black wave […]
-
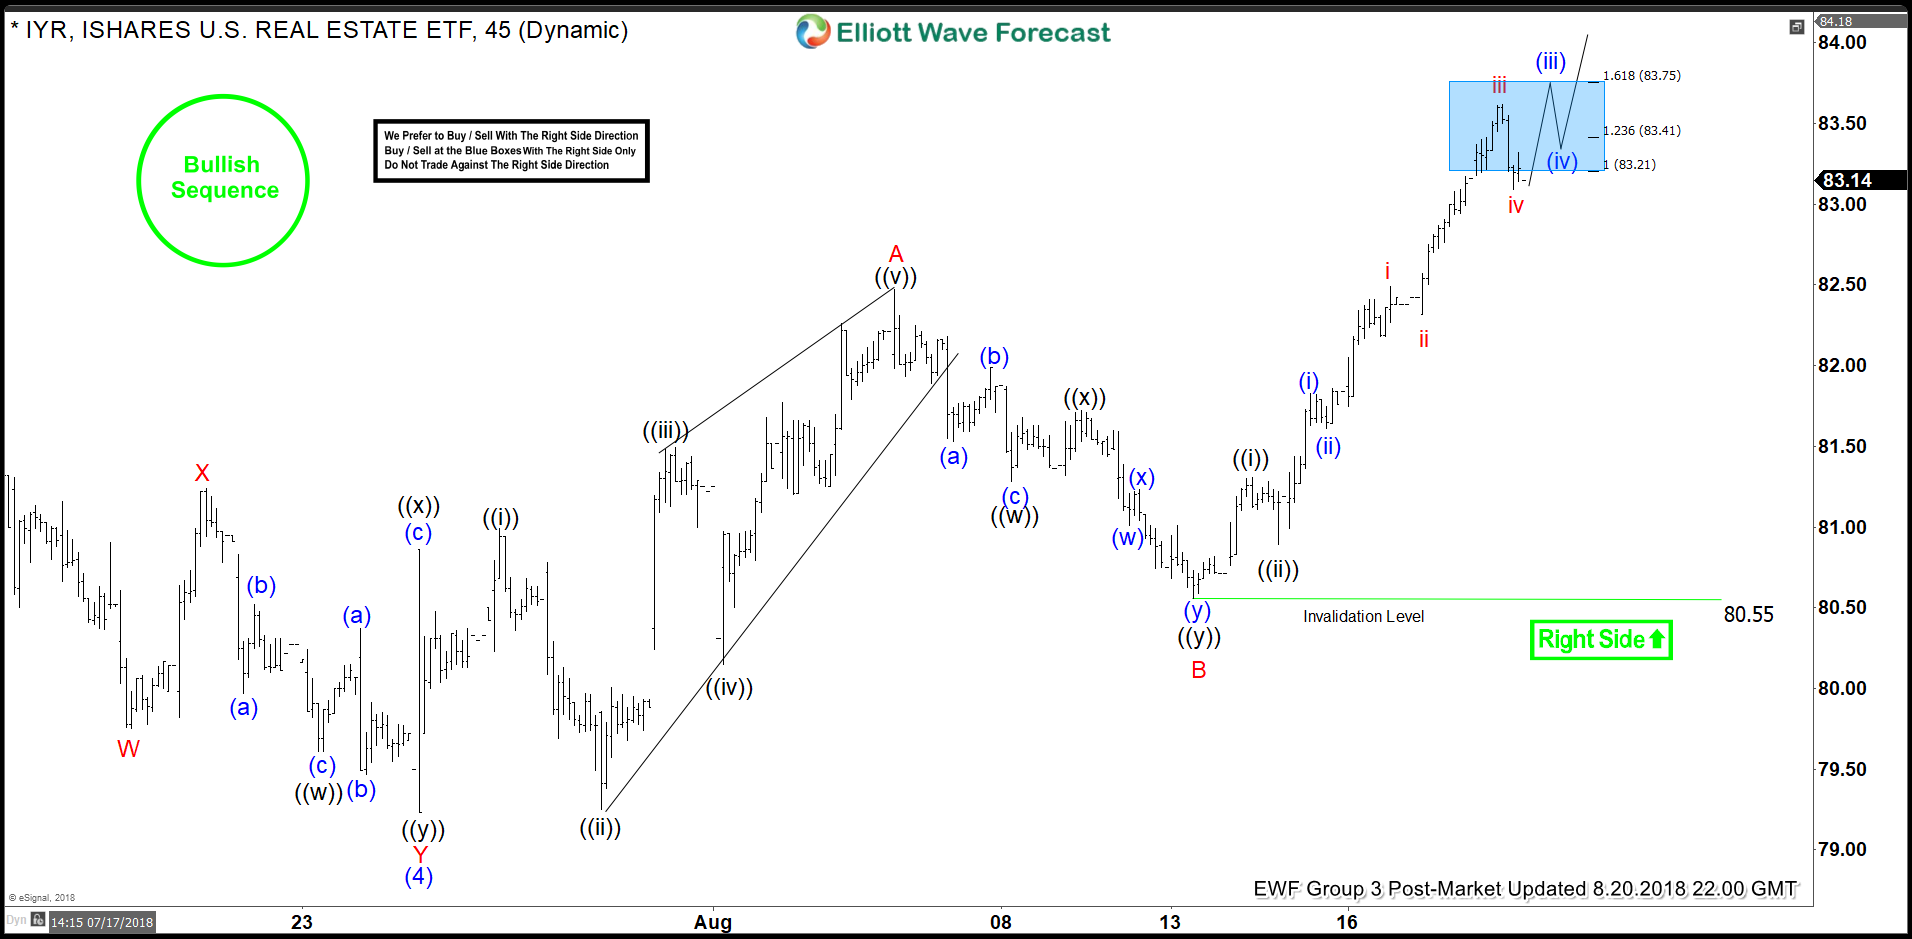
IYR Elliott Wave View: Found Buyers in Blue Box and Rallied
Read MoreHello Traders, In this blog, I want to share with you our recent Elliott Wave charts of the Real Estate ETF called IYR which we presented to our members. Below, you see the 1-hour updated chart presented to our clients on the 08/08/18. IYR ended the cycle from 03/23/18 (72.71) low at the peak of 07/06/18 (82.20) in […]
-
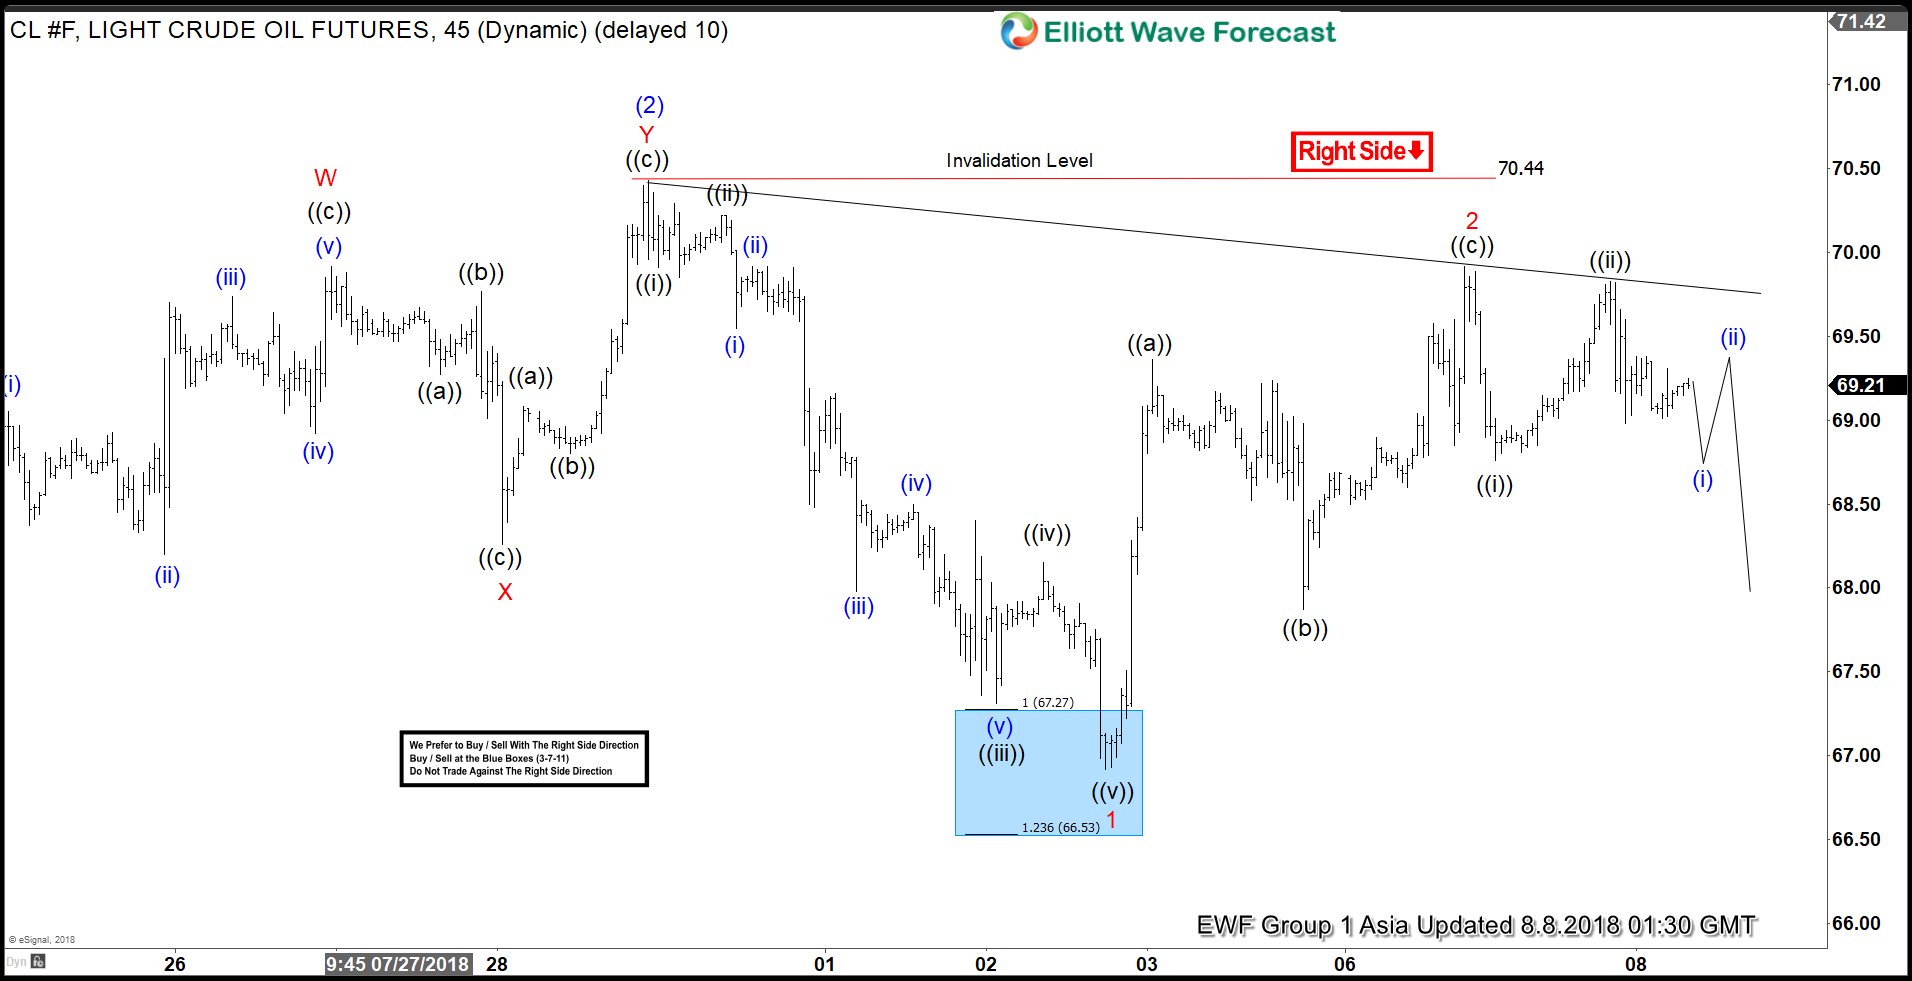
Oil Elliott Wave Analysis: Forecasting the Decline
Read MoreHello fellow traders. Today, we will have a look at some past Elliott Wave charts of Oil which we presented to our members. Below, you can find our 1-hour updated chart presented to our members on the 08/8/18. OIl suggested that the bounce to $70.44 high ended blue wave (2). The internals of that bounce took […]
-
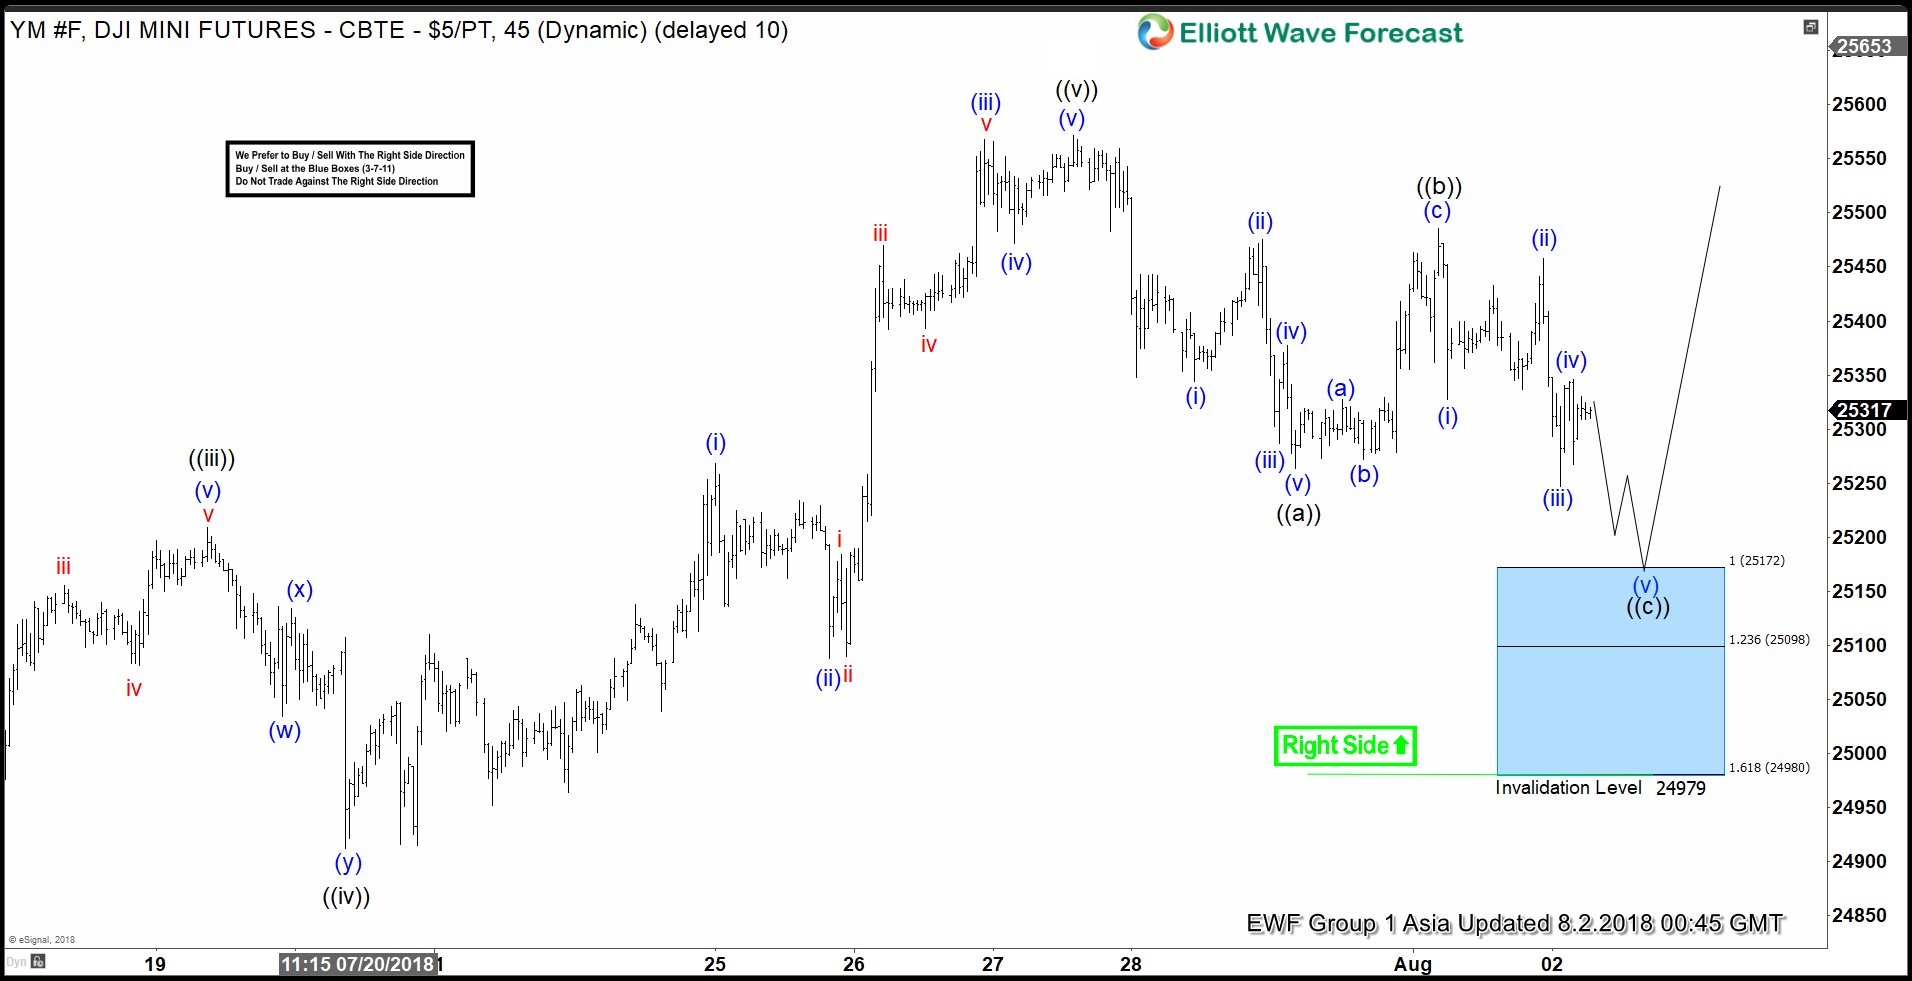
Dow Jones Elliott Wave Analysis: Inflection Area Called The Bounce
Read MoreIn this blog, I want to share some short-term Elliott Wave charts of the Dow Jones Industrial which we presented to our members in the past. Below, you see the 1-hour updated chart presented to our clients on the 08/02/18 indicating that Dow Jones ended the cycle from 07/27 low in red wave 1. As Dow Jones ended the […]