
-
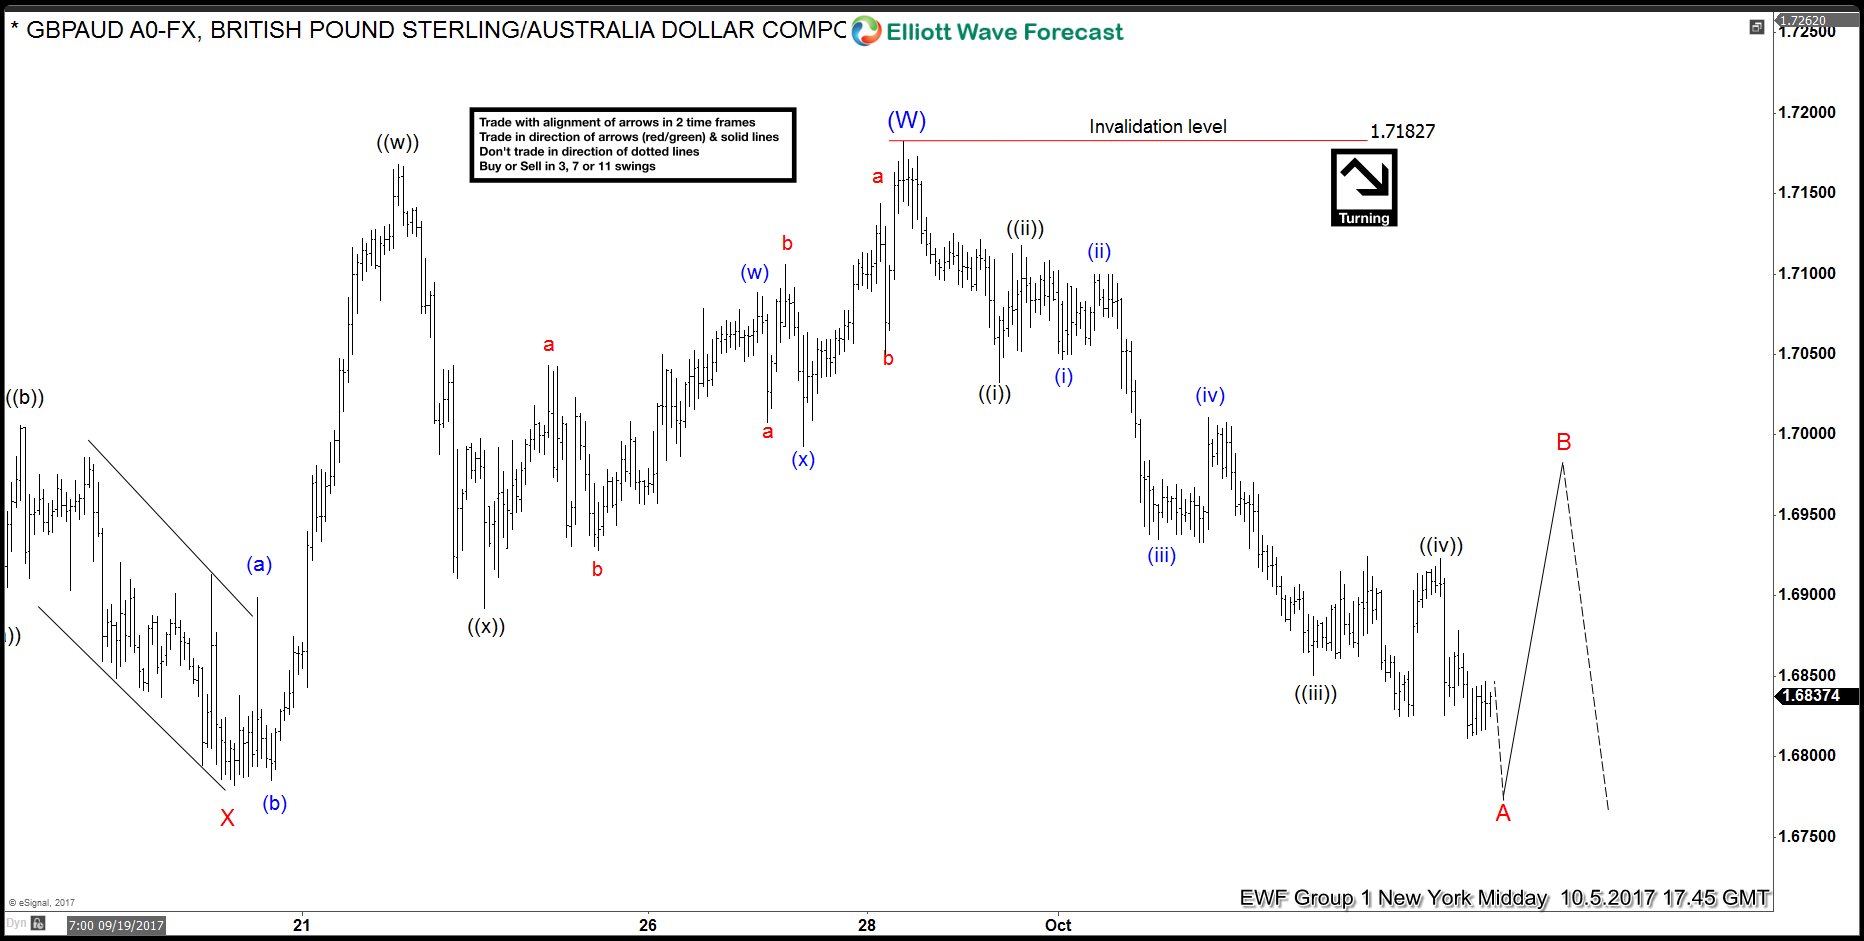
GBPAUD Elliott Wave View: Showing Impulse
Read MoreShort term GBPAUD Elliott wave view suggest that the rally to 1.7182 on 9/28 peak ended the intermediate wave (W). Decline from there is unfolding as an impulse Elliott Wave structure with extension. This 5 waves move should end Minor wave A of an Elliott wave zigzag structure structure or a wave C of a FLAT correction from 9/22 peak (1.7165). In either case, after […]
-
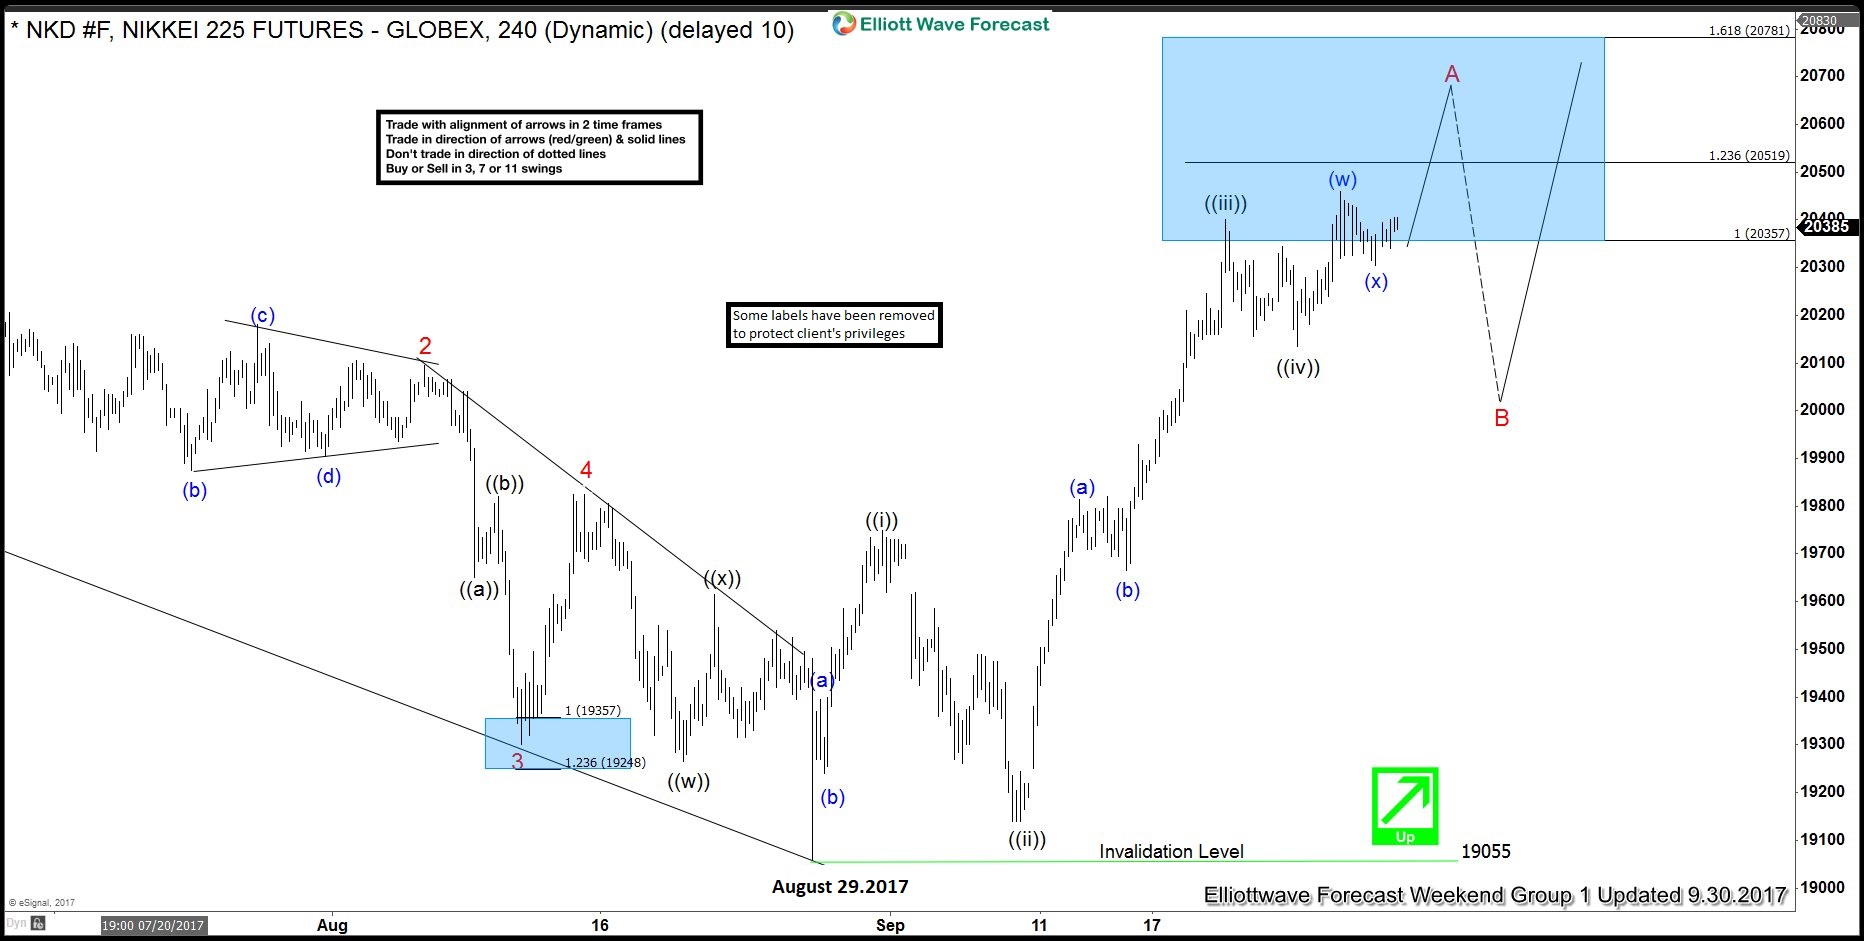
Nikkei ( NKD_F) Elliott Wave View: Diagonal Structure
Read MoreShort term Elliott wave view in Nikkei suggest that the cycle from August 29.2017 low (19055) is unfolding in 5 waves pattern. However looking at the internal subdivision of each wave the bounce looks corrective in nature with upside extensions. Thus suggesting that the Nikkei cycle from August 29 low (19055) could be following a leading Diagonal […]
-
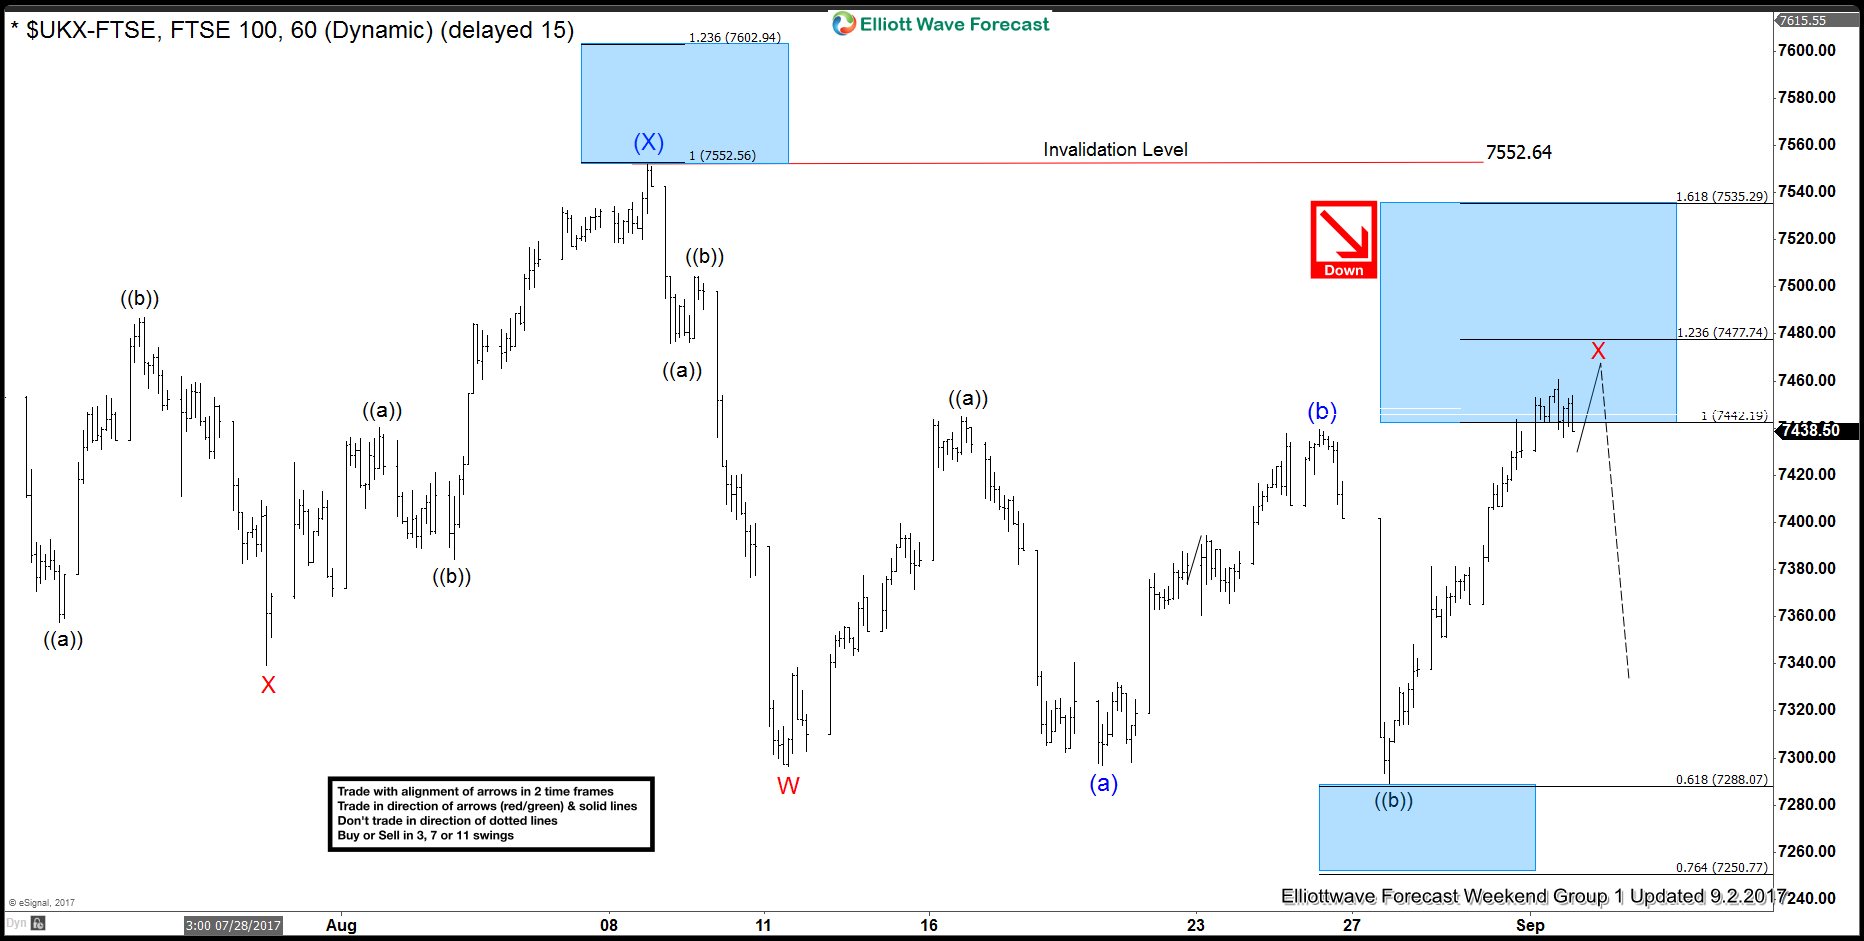
FTSE Elliott wave calling the decline
Read MoreIn this Technical blog we are going to take a quick look at the past 1 hour Elliott Wave performance of the FTSE cycle from June 02, 2017 peak. Which we presented to our clients at elliottwave-forecast.com. We are going to explain the structure from that peak. FTSE 4 Hour Elliott Wave Chart The Intermediate cycle from June 02 peak […]
-
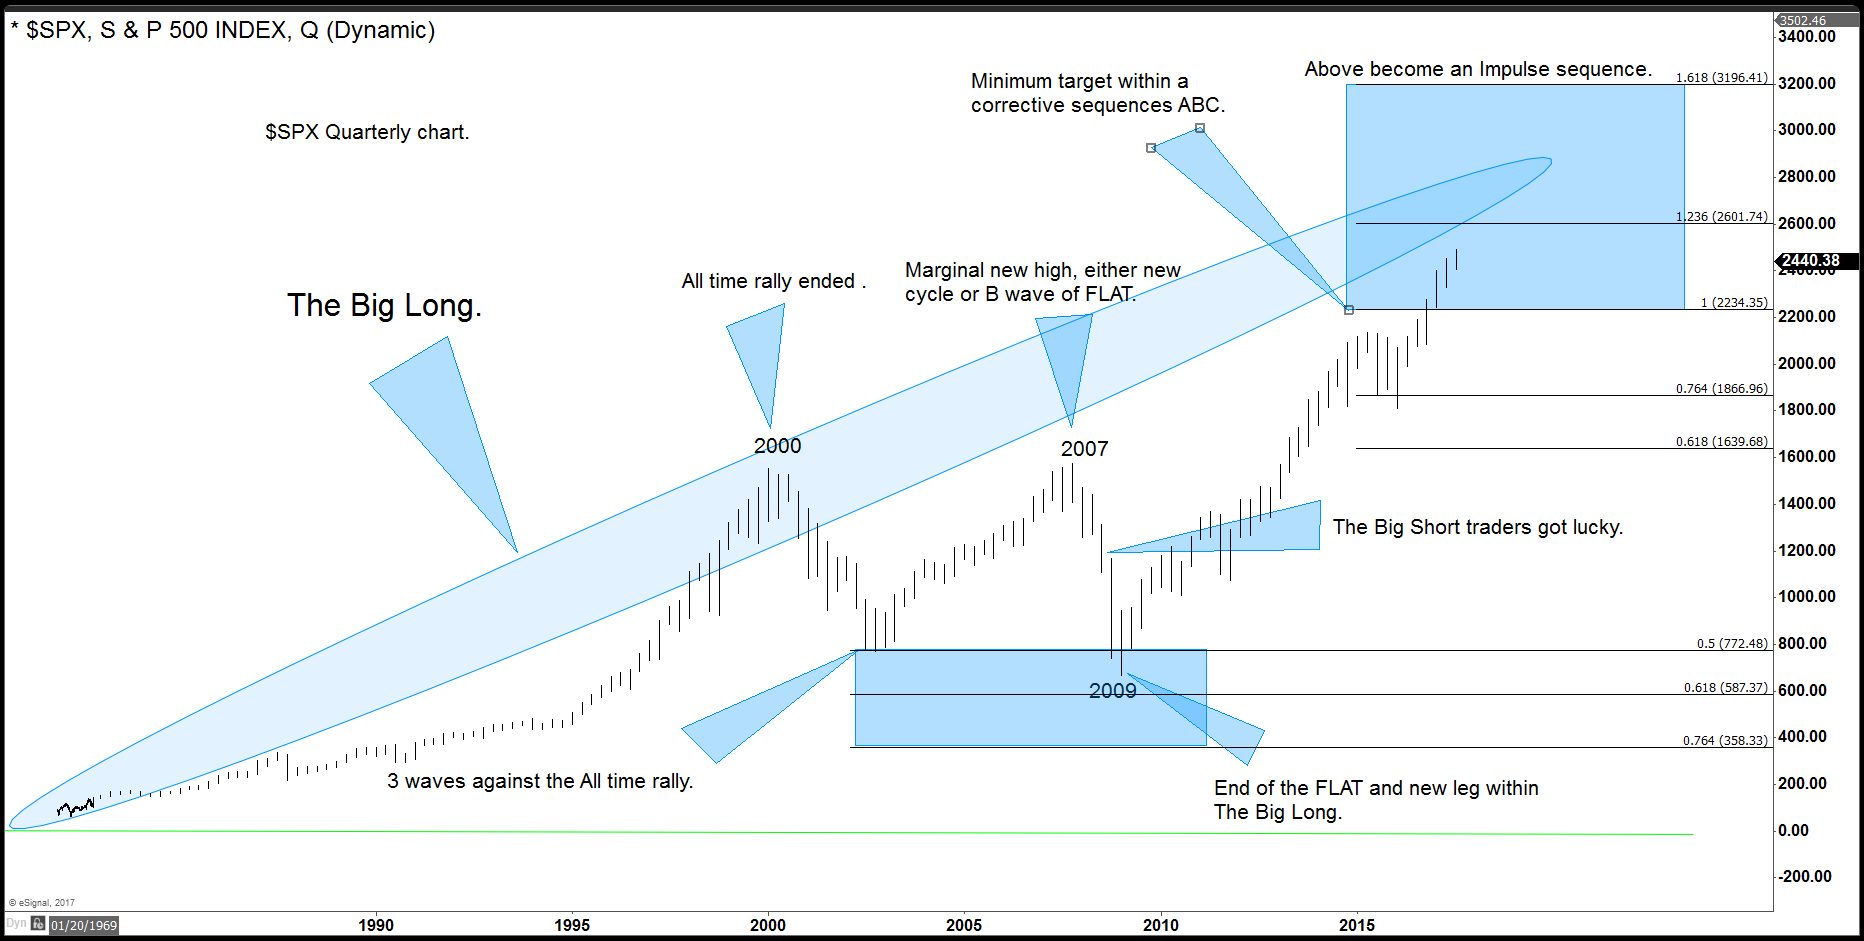
The Big Long in World Indices
Read MoreSince the decline starting from year 2000, the world has been calling for a huge crash in world indices. The world indices did in fact corrected nicely in the year 2000 and 2009. The correction took the form of a FLAT Elliott wave structure and reached 50%-61.8% of the all-time rally in most of the world […]
-
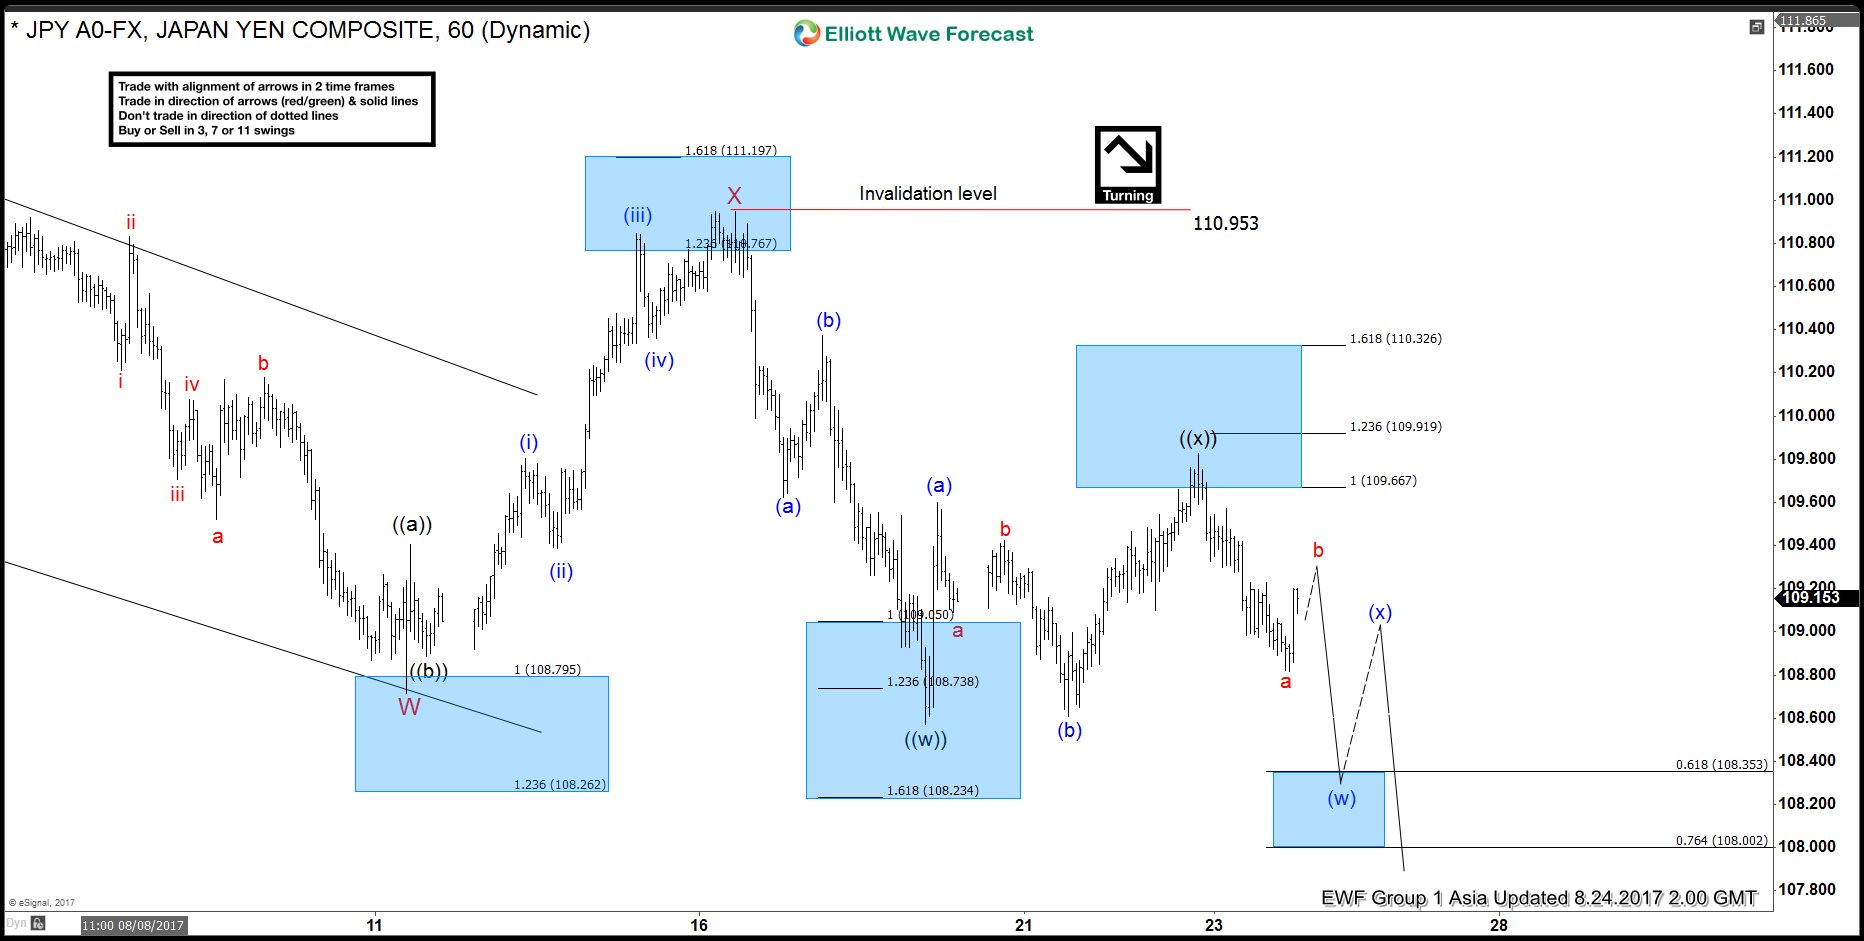
USDJPY Elliott Wave view: Resuming lower
Read MoreShort term USDJPY Elliott wave view suggest the decline from 7/11 peak is unfolding as a double three Elliott wave structure. Decline to 108.71 low ended Minor wave W and Minor wave X bounce ended at 110.95 peak. Subdivision of Minor wave Y is unfolding as a Zigzag structure. Minute wave ((w)) of ((Y) ended at 108.59 low […]
-
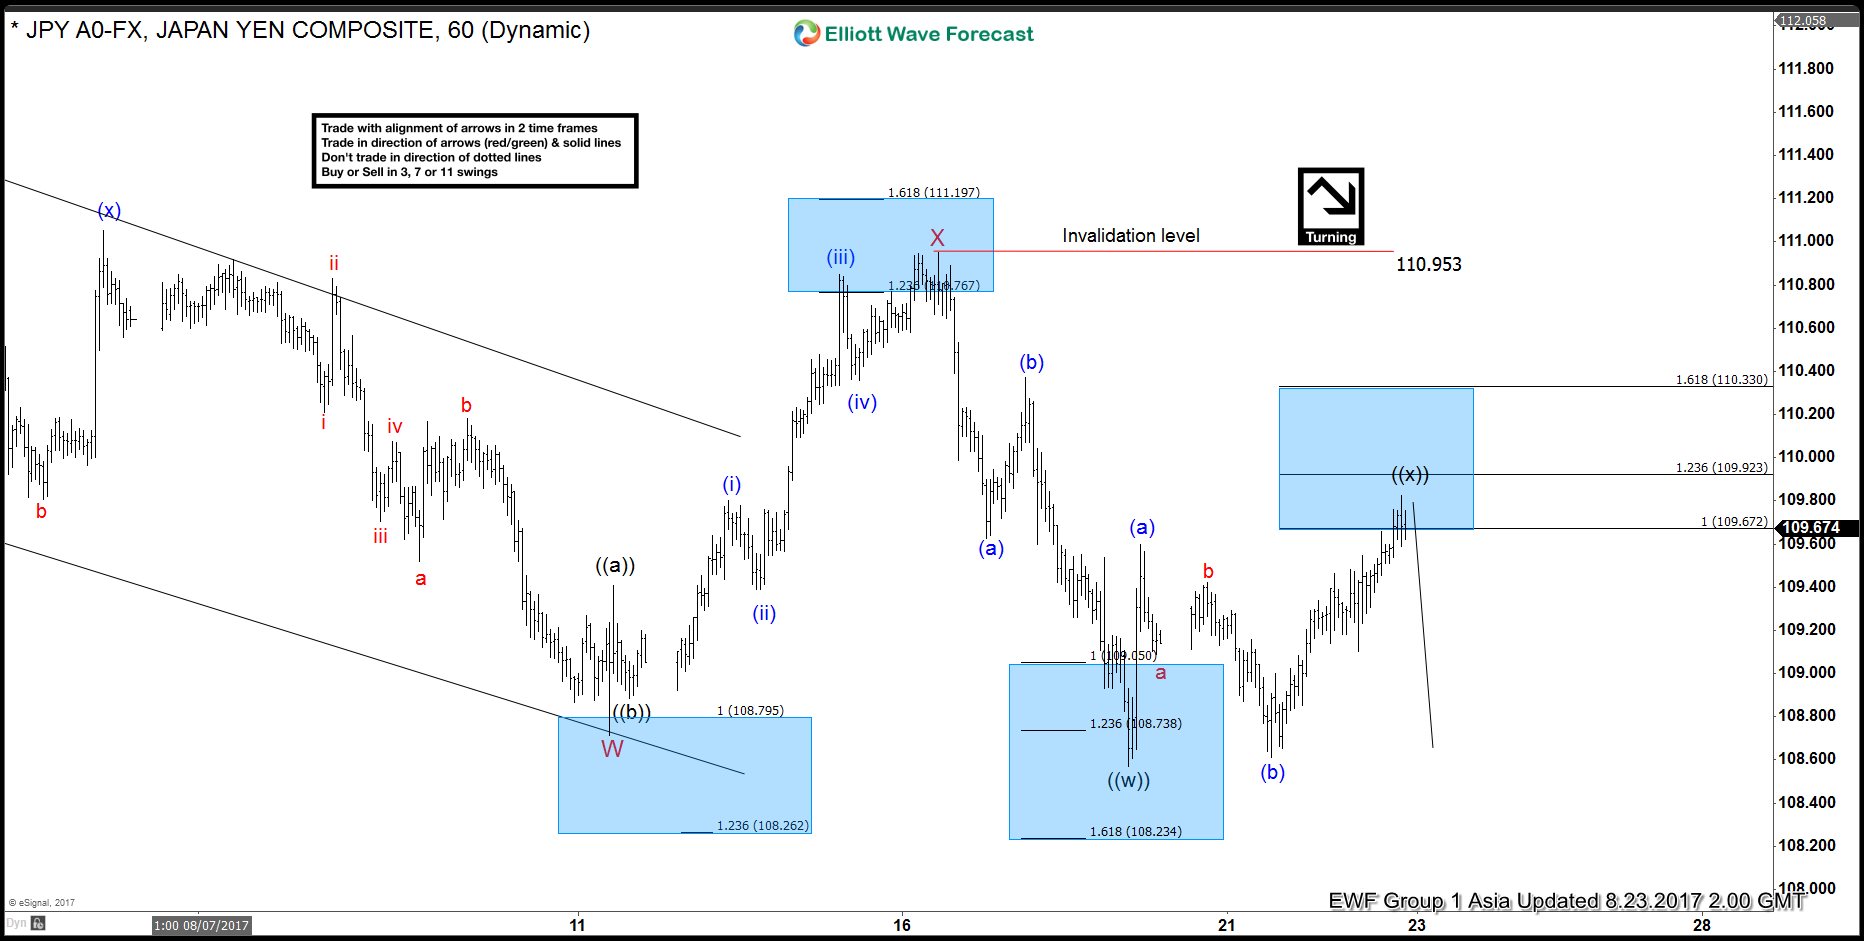
USDJPY Elliott Wave View: Turning Lower
Read MoreShort term USDJPY Elliott wave view suggest that the decline from 7/11 peak is unfolding as a double three Elliott wave structure. Decline to 108.71 low ended Minor wave W and Minor wave X bounce ended at 110.95 peak. Subdivision of Minor wave Y is unfolding as a Zigzag structure. Minute wave ((w)) of ((Y) ended at 108.59 […]