
-
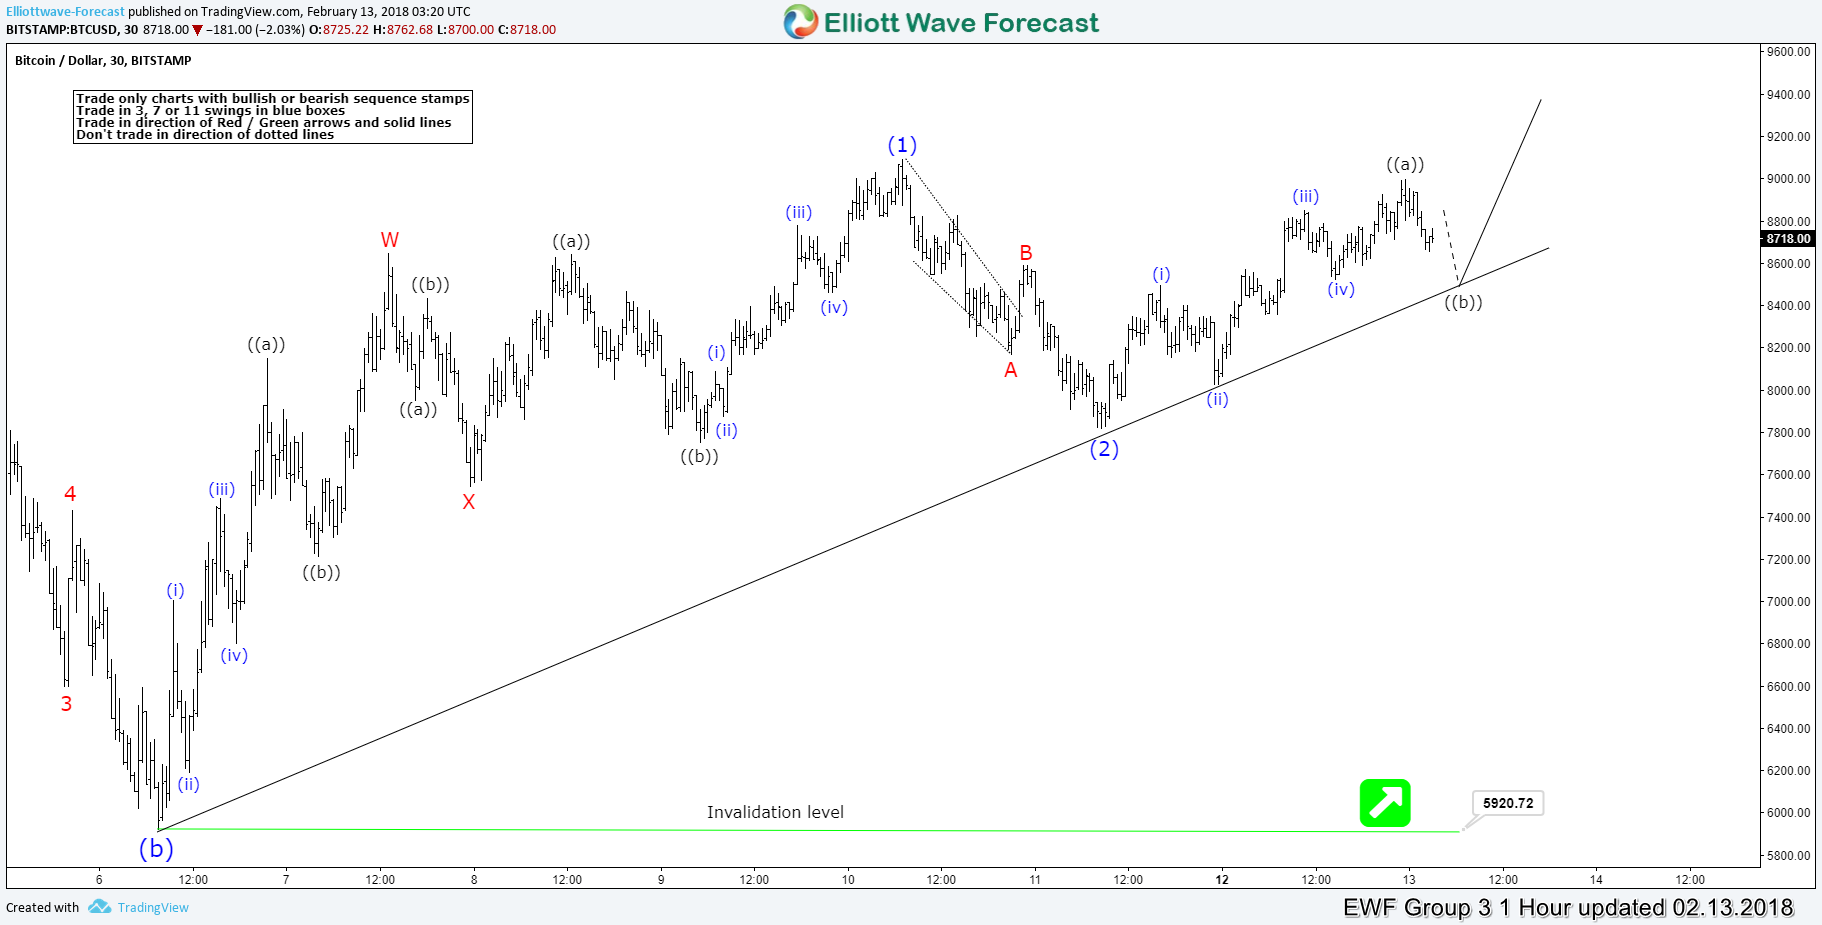
Elliott Wave Analysis: Calling the low in place in Bitcoin
Read MoreBitcoin ticker symbol: ( BTCUSD ) Short Term Elliott Wave view suggests that the decline from December 17.2017 peak to February 05.2018 low (5920.72) ended the Super Cycle wave “(b)” lower. Above from there, the rally is unfolding as a leading diagonal Elliott Wave structure. Where Intermediate wave (1) ended at 9090.8 high as Elliott Wave Double three structure. Where internals of Intermediate wave […]
-
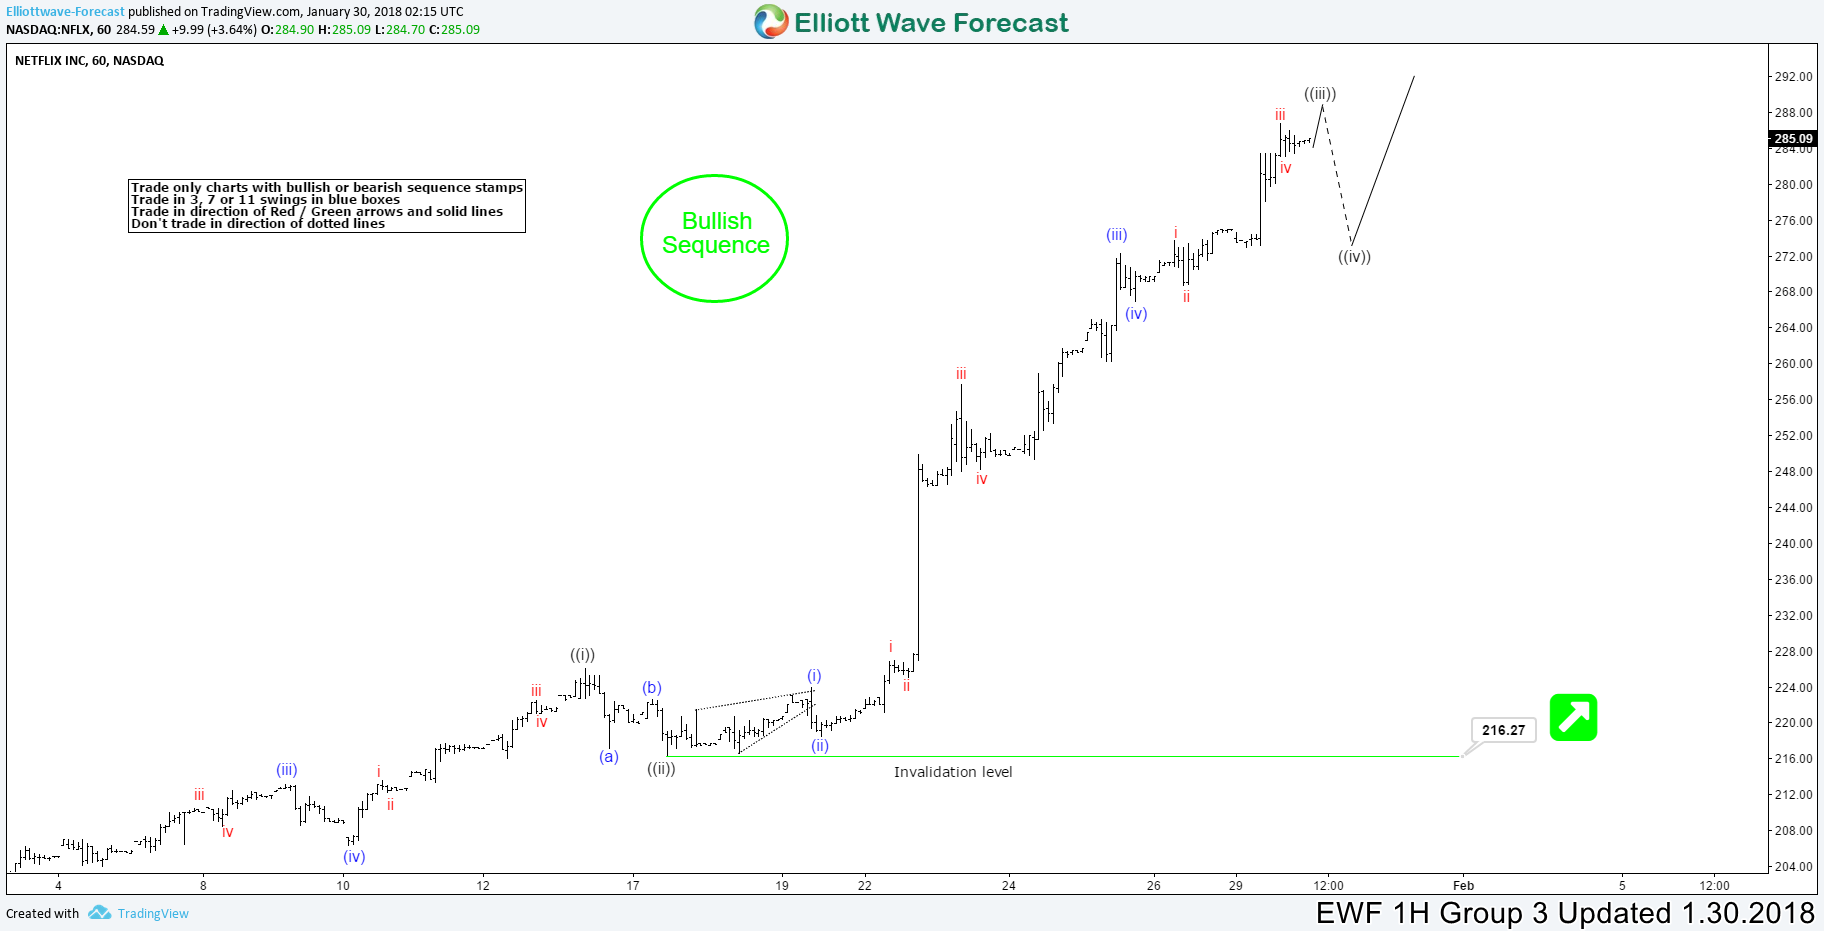
Netflix (NFLX) Extending higher as an Impulse
Read MoreNetflix stock symbol: (NFLX ) Short Term Elliott Wave view suggests that the cycle from December 06. 2017 low is extending higher as an Impulse sequence with extension in Minute wave ((iii)) higher. When each leg has an internal distribution of 5 waves thus favoring it to be an impulse. These 5 waves move higher should end either […]
-
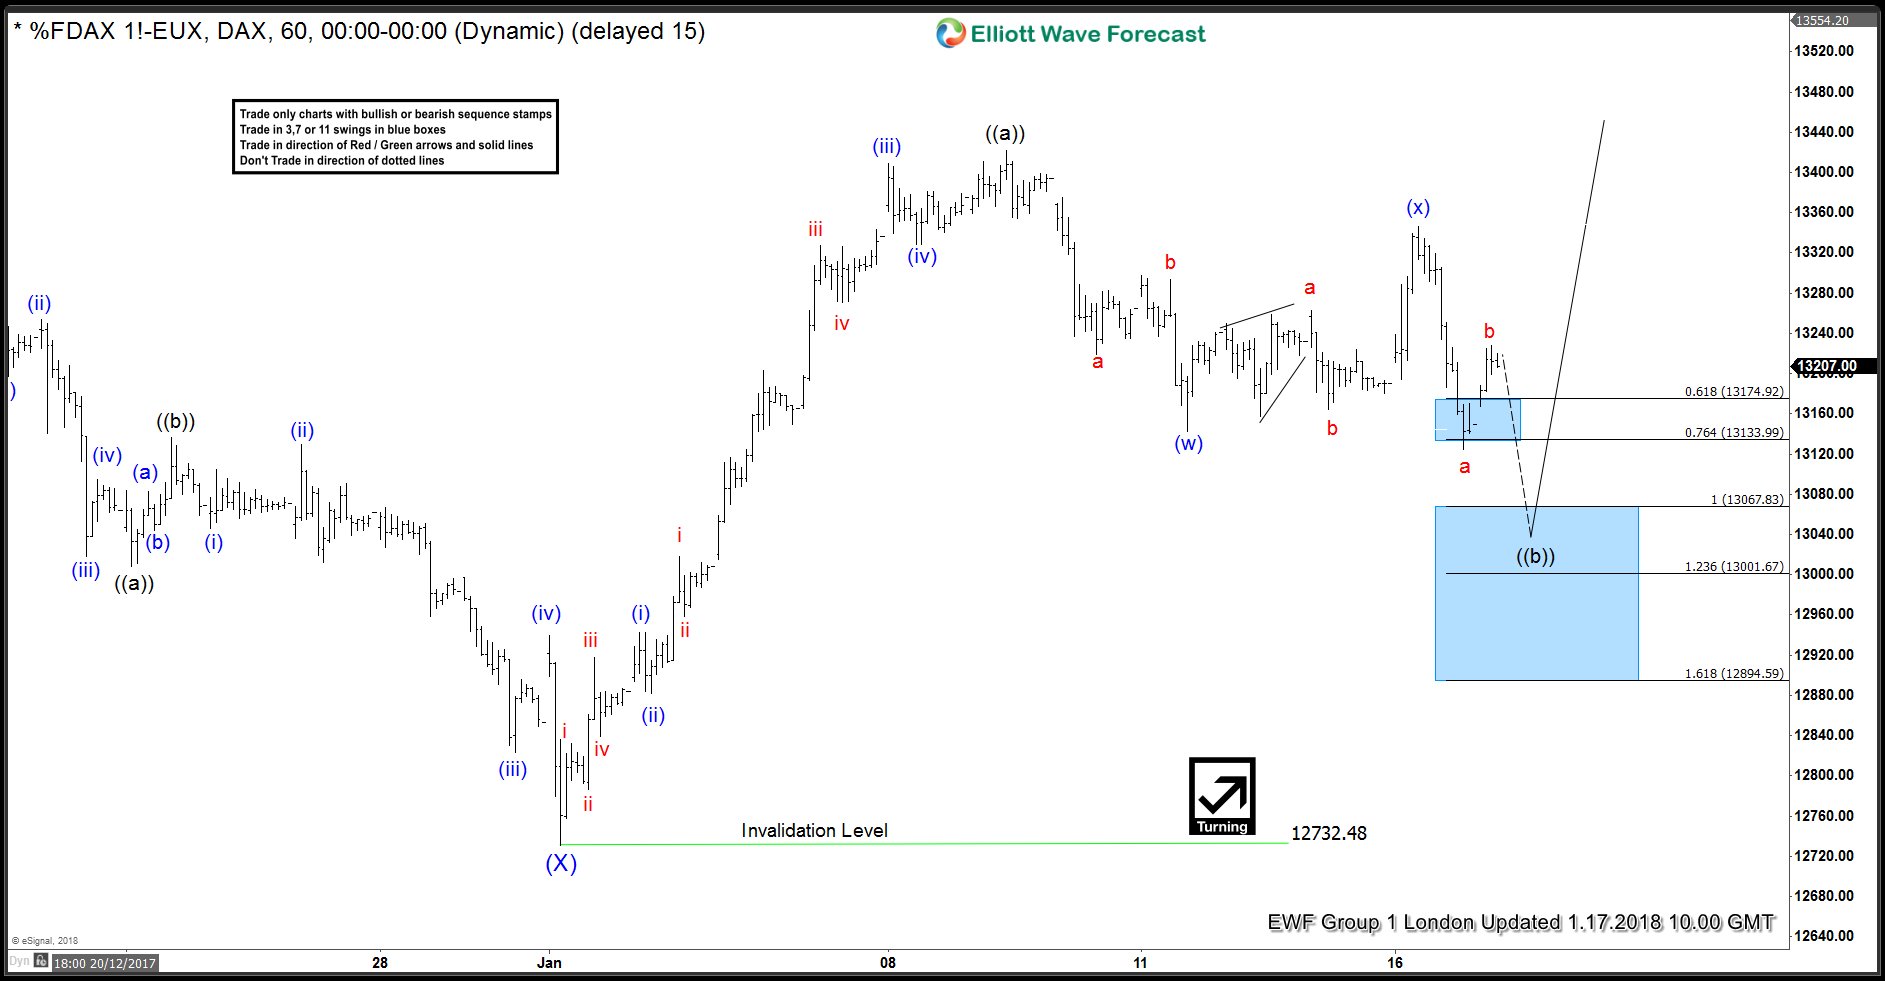
DAX Elliott Wave View: Doing Double Correction
Read MoreDAX Short Term Elliott Wave view suggests that Intermediate wave (X) ended at 12732.48 on 1/02 low. A rally from there is unfolding as a 5 waves impulsive Elliott Wave structure where Minutte wave (i) ended at 12943. Minutte wave (ii) ended at 12881.5, Minutte wave (iii) ended at 13408.5. Minutte wave (iv) ended at 13328.5, and Minutte wave (v) of […]
-
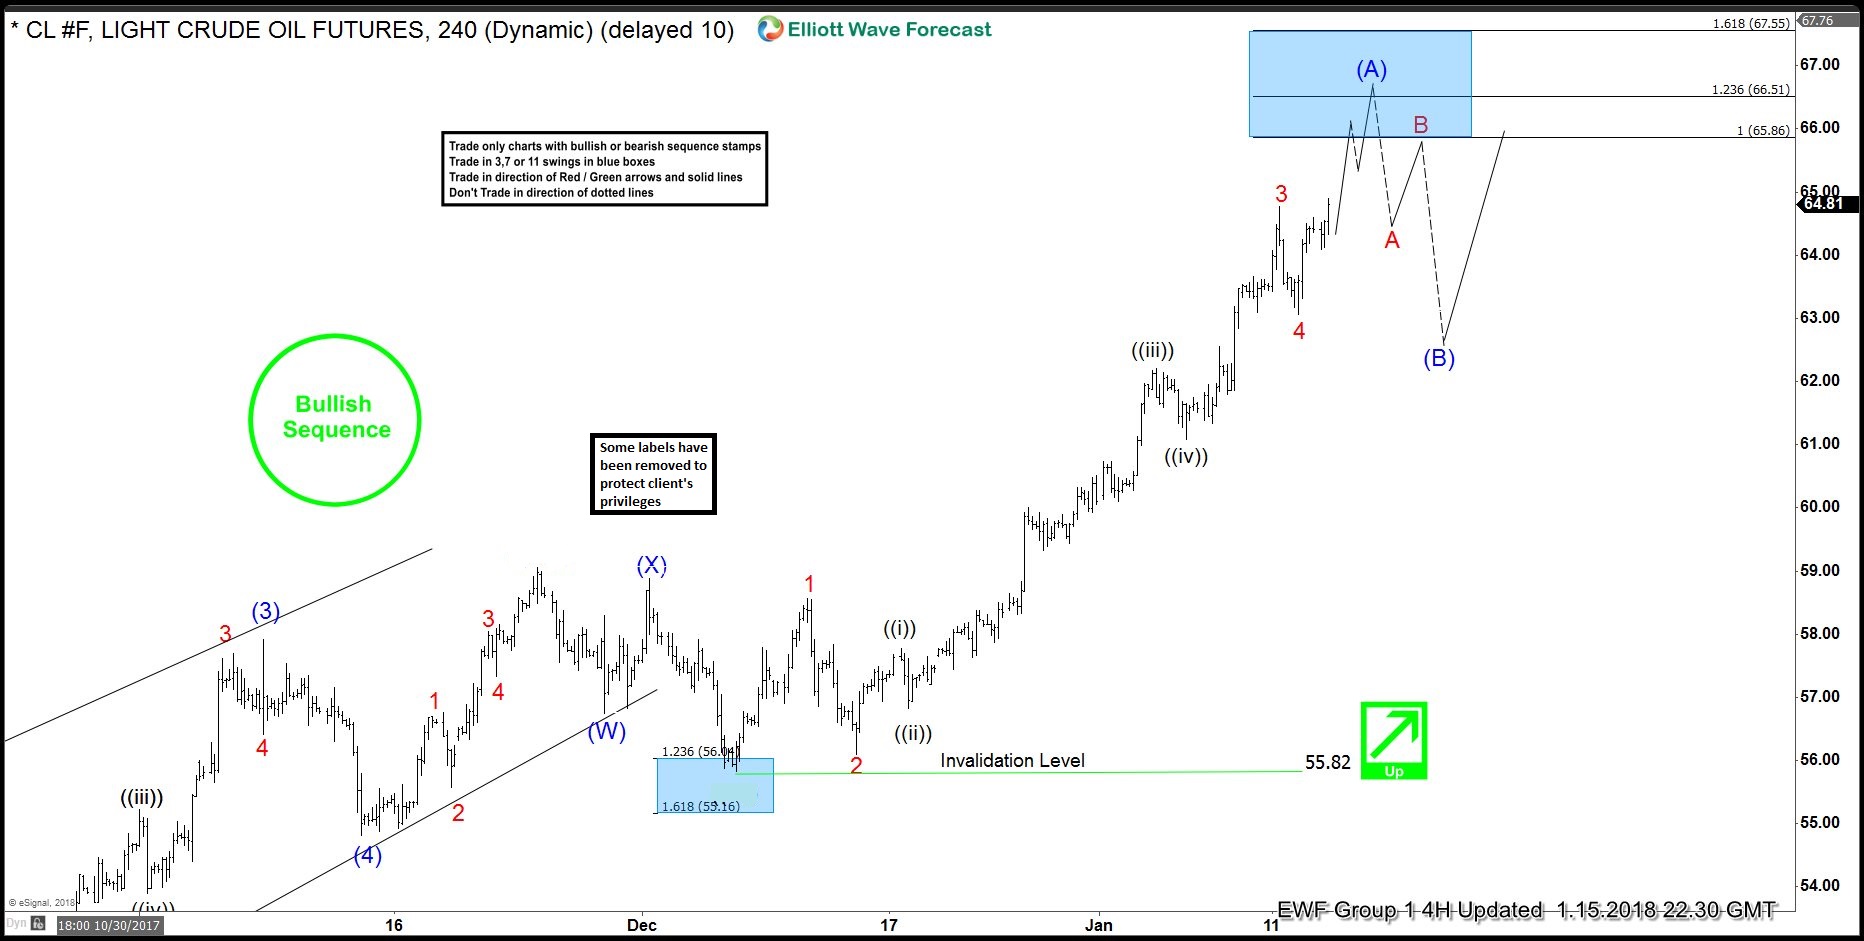
OIL (CL #F) Showing Impulsive Sequence
Read MoreOIL (CL #F) Short-term Elliott Wave view suggests that the rally from 55.82 December 07 low is unfolding as an impulse Elliott Wave structure with extension in 3rd swing higher, where each leg has internal oscillations of 5 waves thus favoring it to be an impulse. These 5 waves move higher should end the Intermediate wave (A) higher in an Impulse sequence. Afterwards, the […]
-
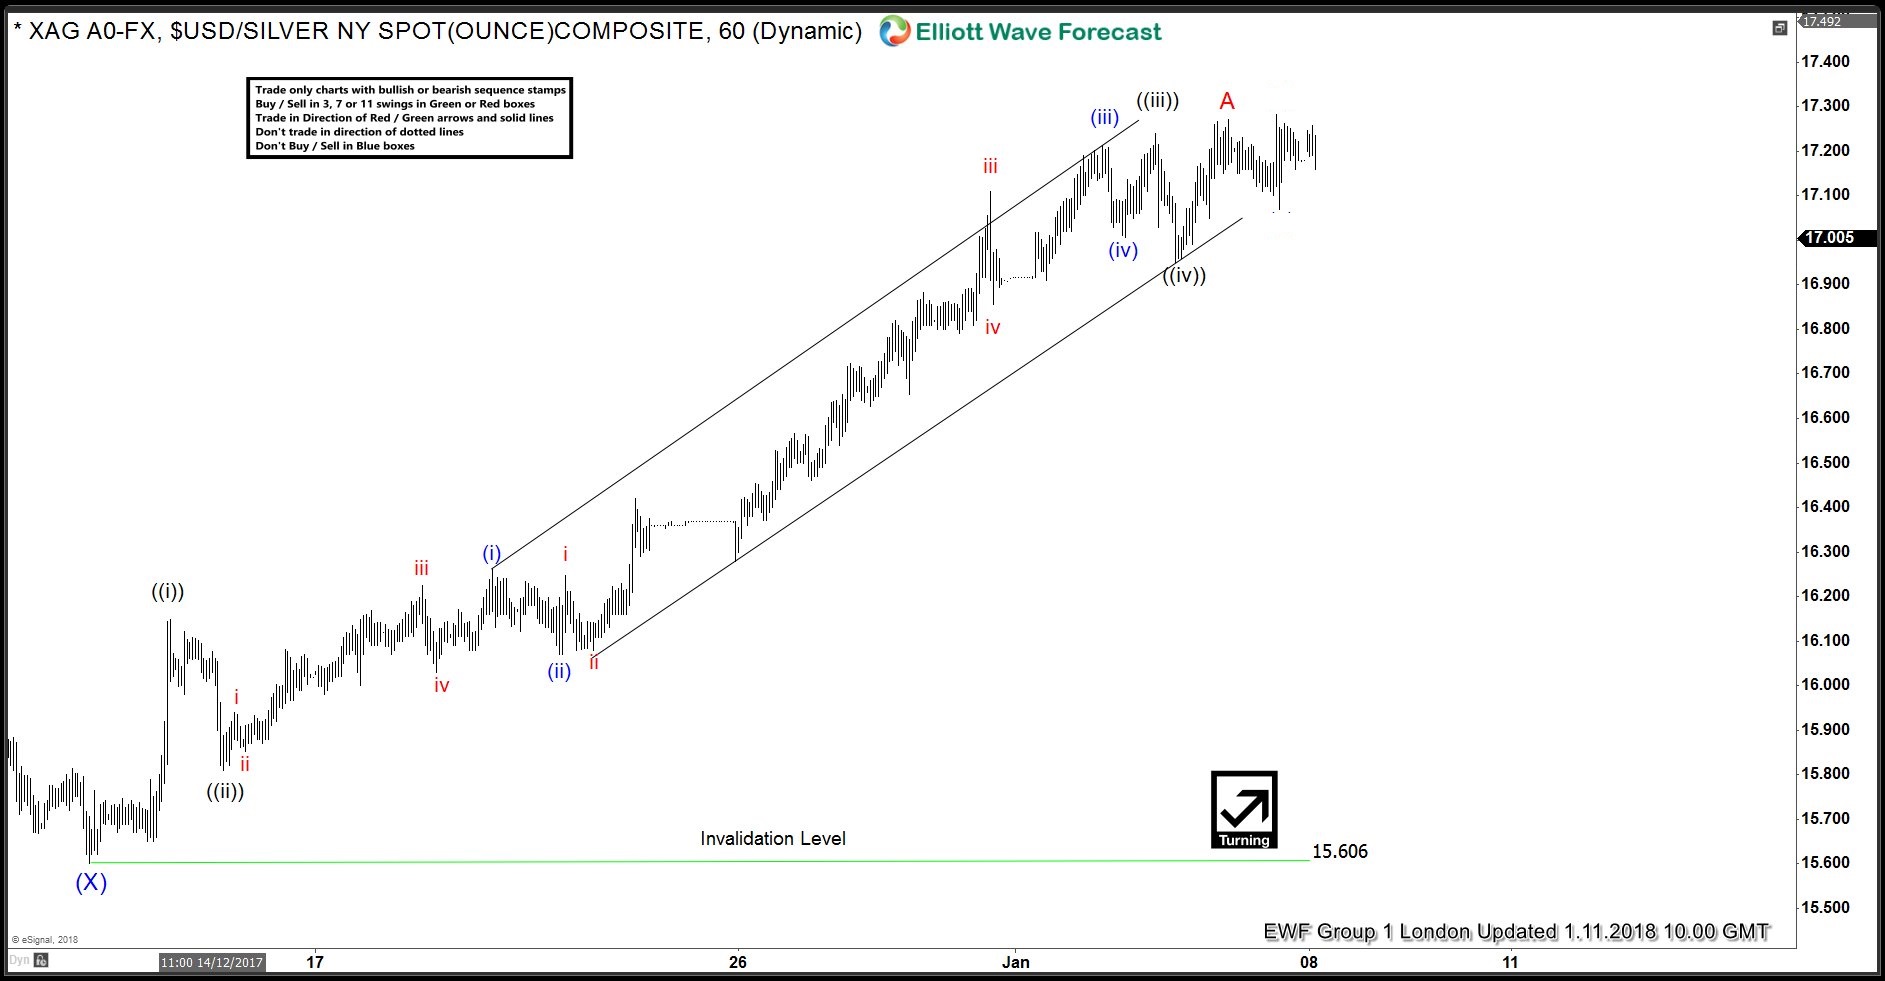
Silver: Impulsive Elliott Wave Rally
Read MoreSilver Short term Elliott Wave view suggests that the decline to December 12.2017 low 15.60 ended Intermediate wave (X). A rally from there is unfolding as an impulse Elliott Wave structure with extension in 3rd swing higher, where each leg has internal oscillations of 5 waves thus favoring it to be an impulse. These 5 waves move higher, either ended Minor wave A in […]
-
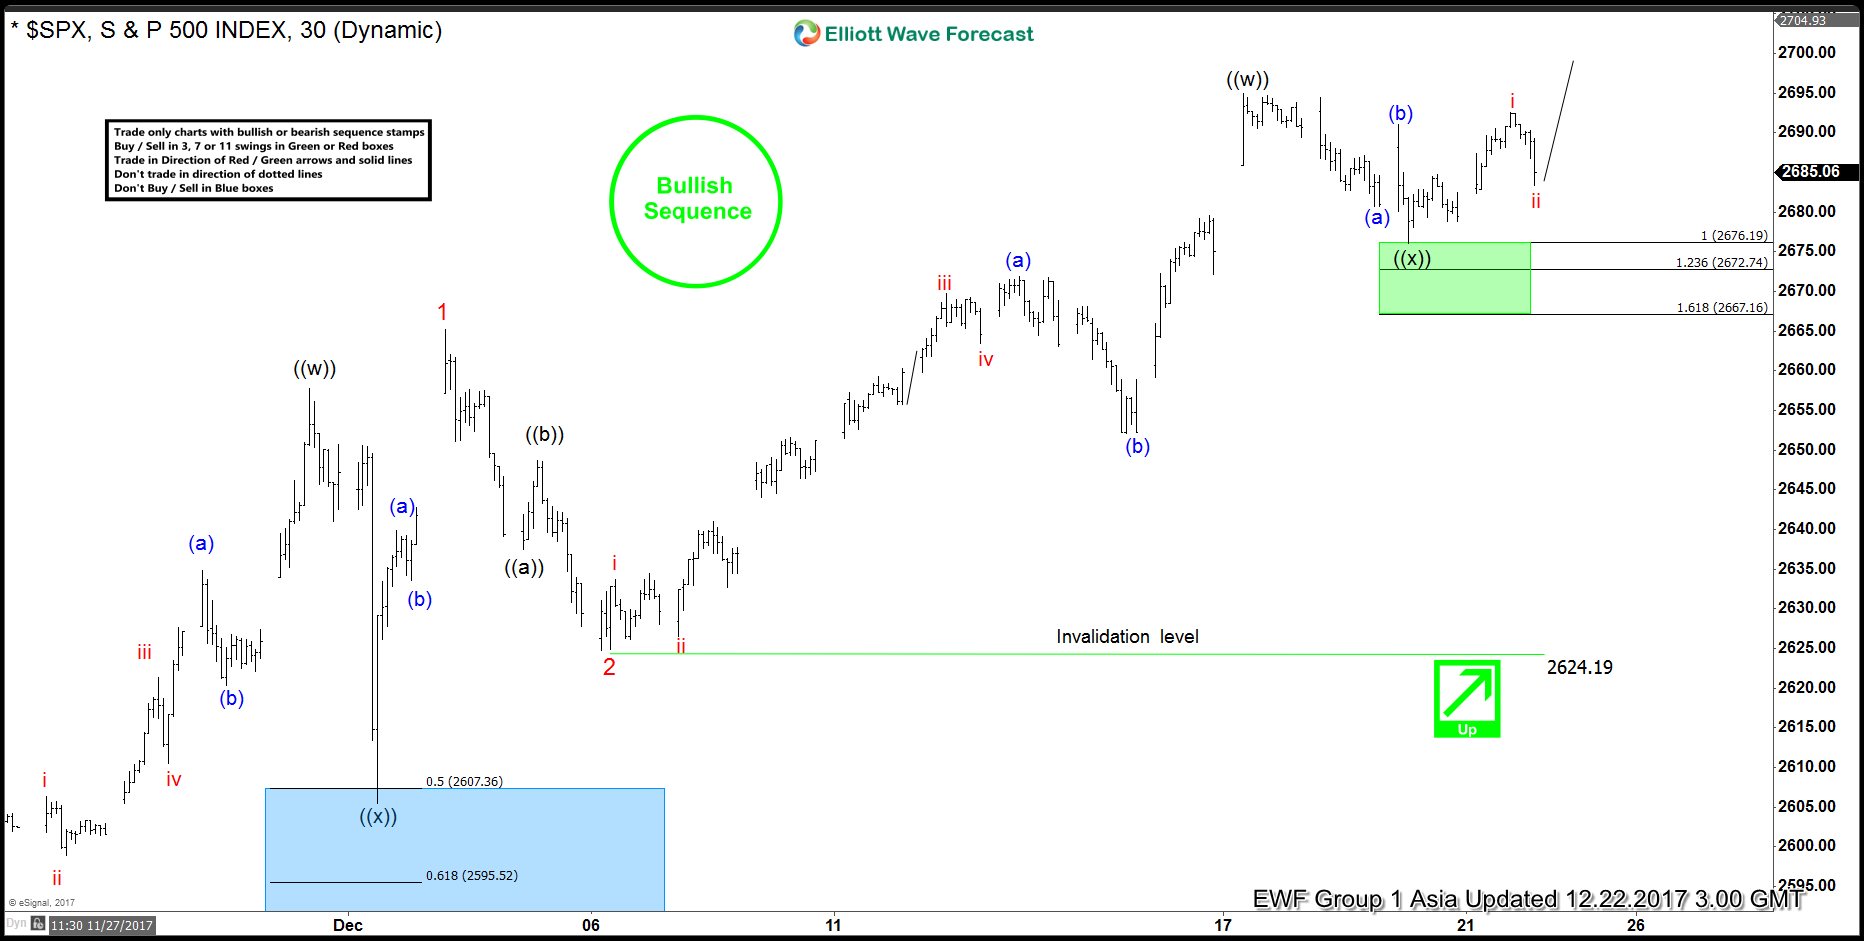
SPX Elliott Wave View: 12.22.2017
Read MoreSPX Short term Elliott Wave view suggests that the rally to 2664.58 ended Minor wave 1 as a Leading diagonal. Below from there Minor wave 2 ended as a zigzag correction at 2624.19 low, above from there Minor wave 3 remains in progress as a double structure. And showing the incomplete bullish sequence to the upside. The Minutte wave (a) of […]