
-
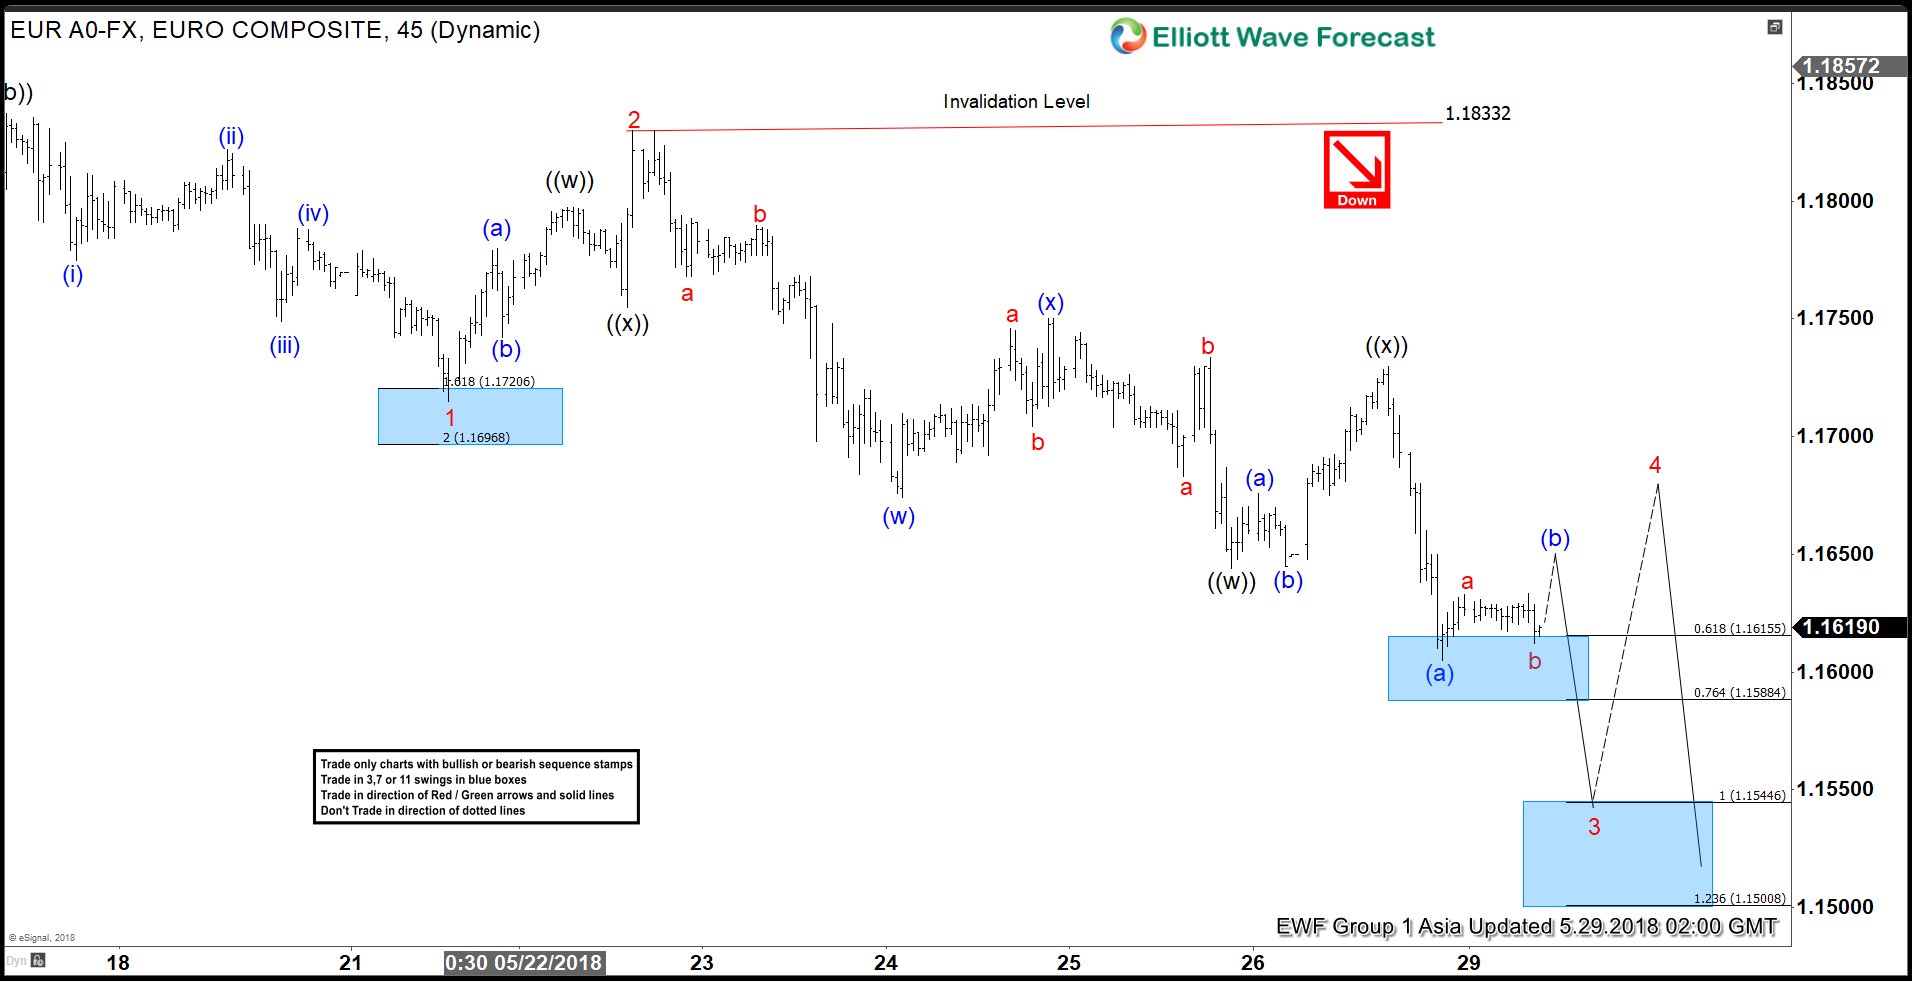
EURUSD Elliott Wave View: Bounces Are Expected To Fail
Read MoreEURUSD short-term Elliott wave view suggests that the decline from ( 1.1996 ) 5/14/2018 peak is unfolding as ending diagonal structure in Intermediate wave (5) lower as mentioned in the previous post here. The internals of each of leg in ending diagonal structure is the combination of a 3 waves corrective structure i.e the internal of wave […]
-
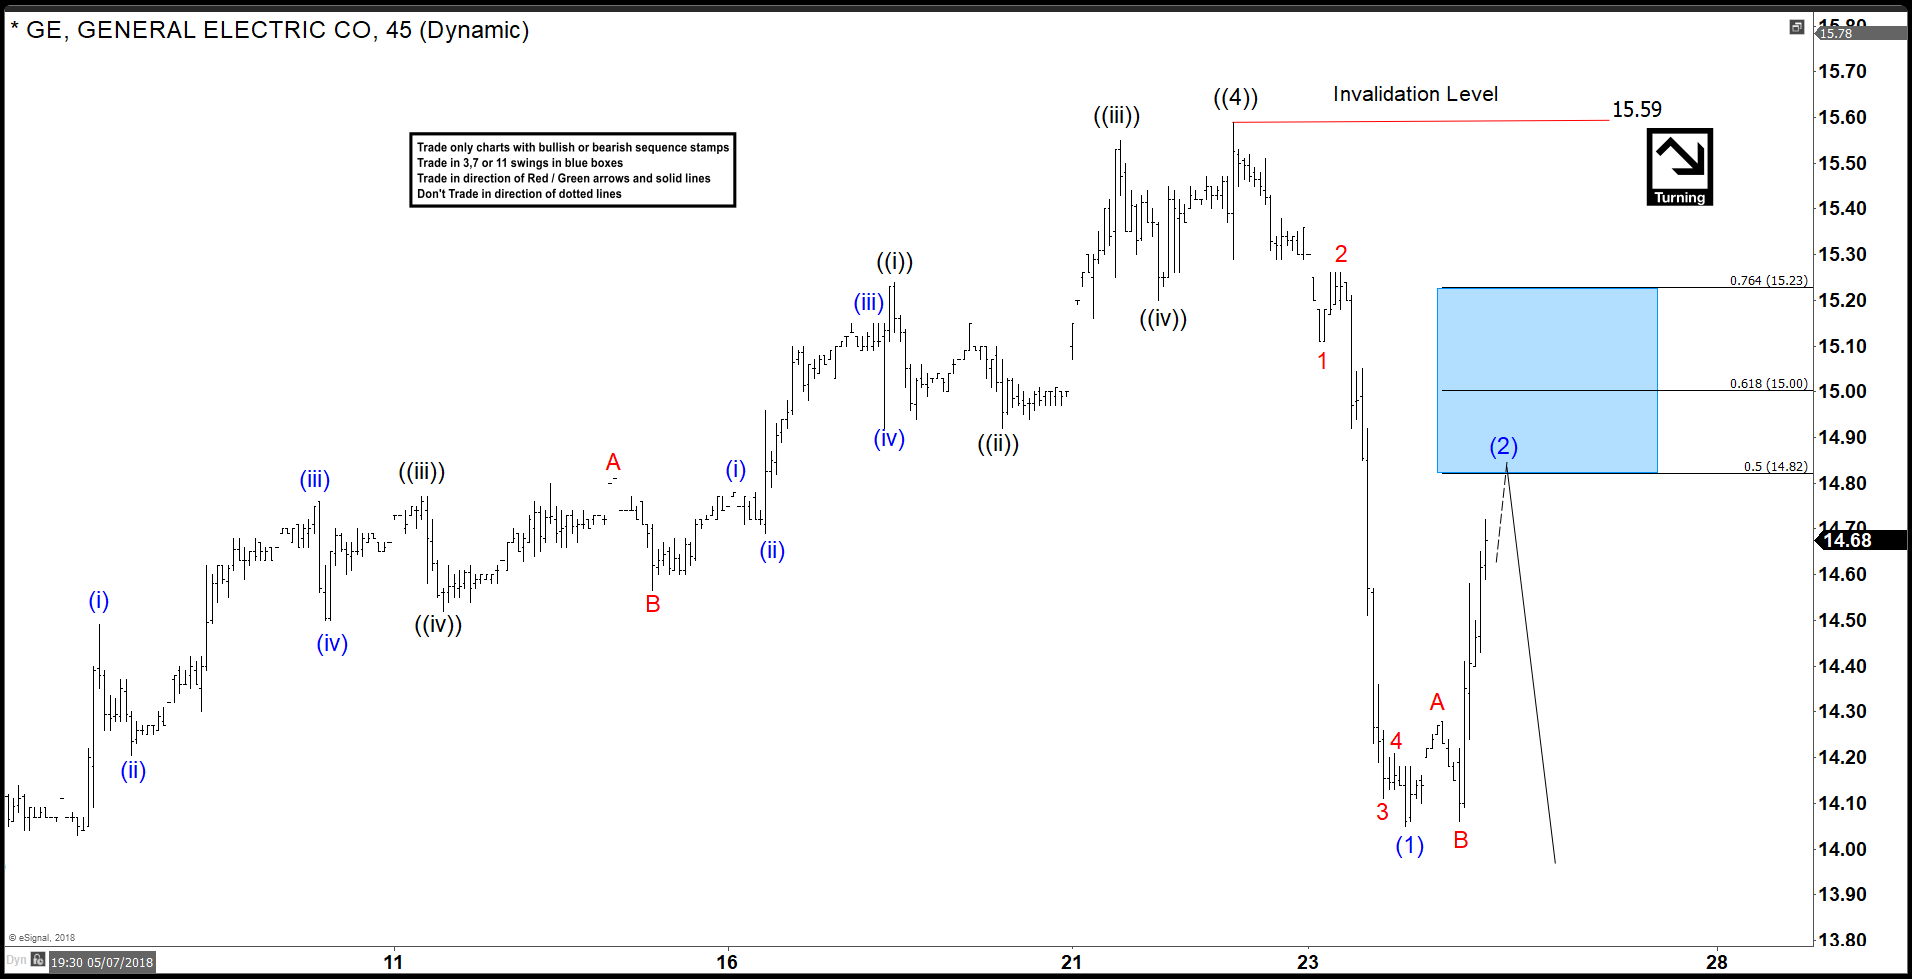
General Electric (GE) Ending Elliott Wave Impulse Soon
Read MoreGeneral Electric ticker symbol: GE short-term Elliott Wave view suggests that the rally to 5/22/2018 high 15.59 ended primary wave ((4)). When intermediate degree wave (Y) of ((4)) ended as a Zigzag correction with Minor wave A ended at 14.79 and Minor wave B ended at 14.58 low. Down from 15.59 high, the decline unfolded […]
-
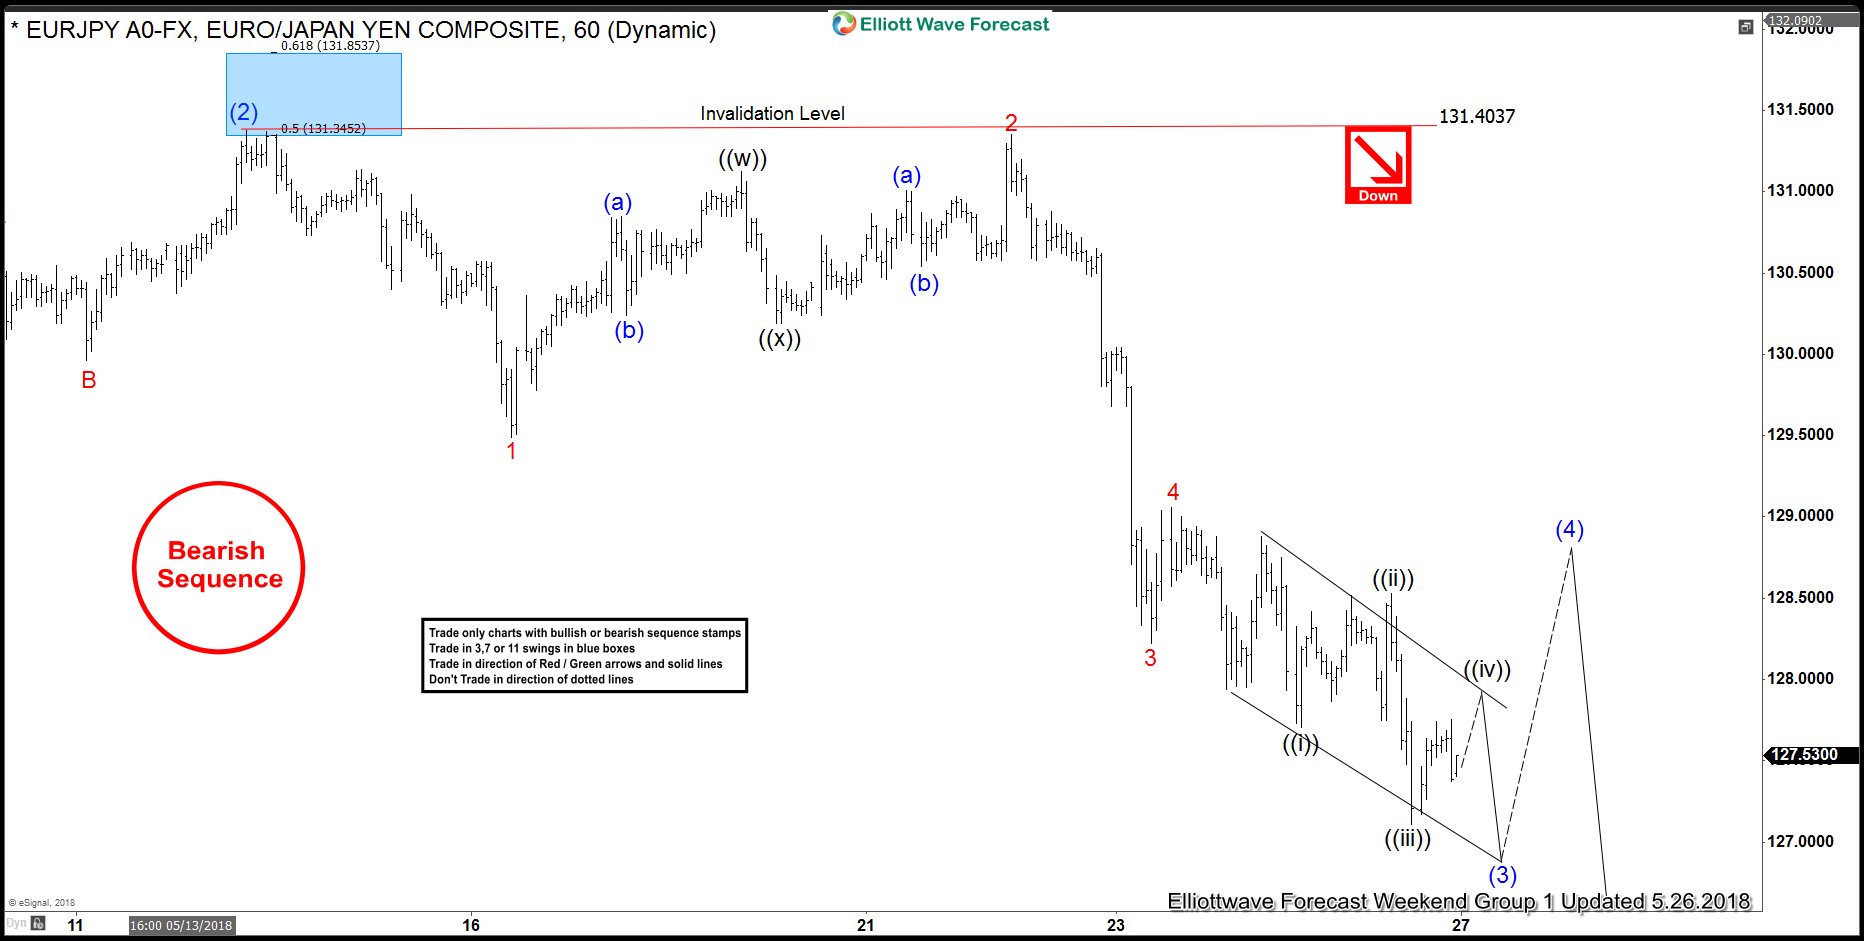
Elliott Wave Analysis: EURJPY Has a Bearish Sequence
Read MoreEURJPY short-term Elliott Wave view suggests that the bounce to 5/14 high at 131.38 ended wave (2). Down from there, the decline is unfolding as Elliott wave impulsive structure as expected and should complete wave (3). The internal sub-division of each leg lower is showing 5 waves structure in lesser degree cycles, which is characteristic of […]
-
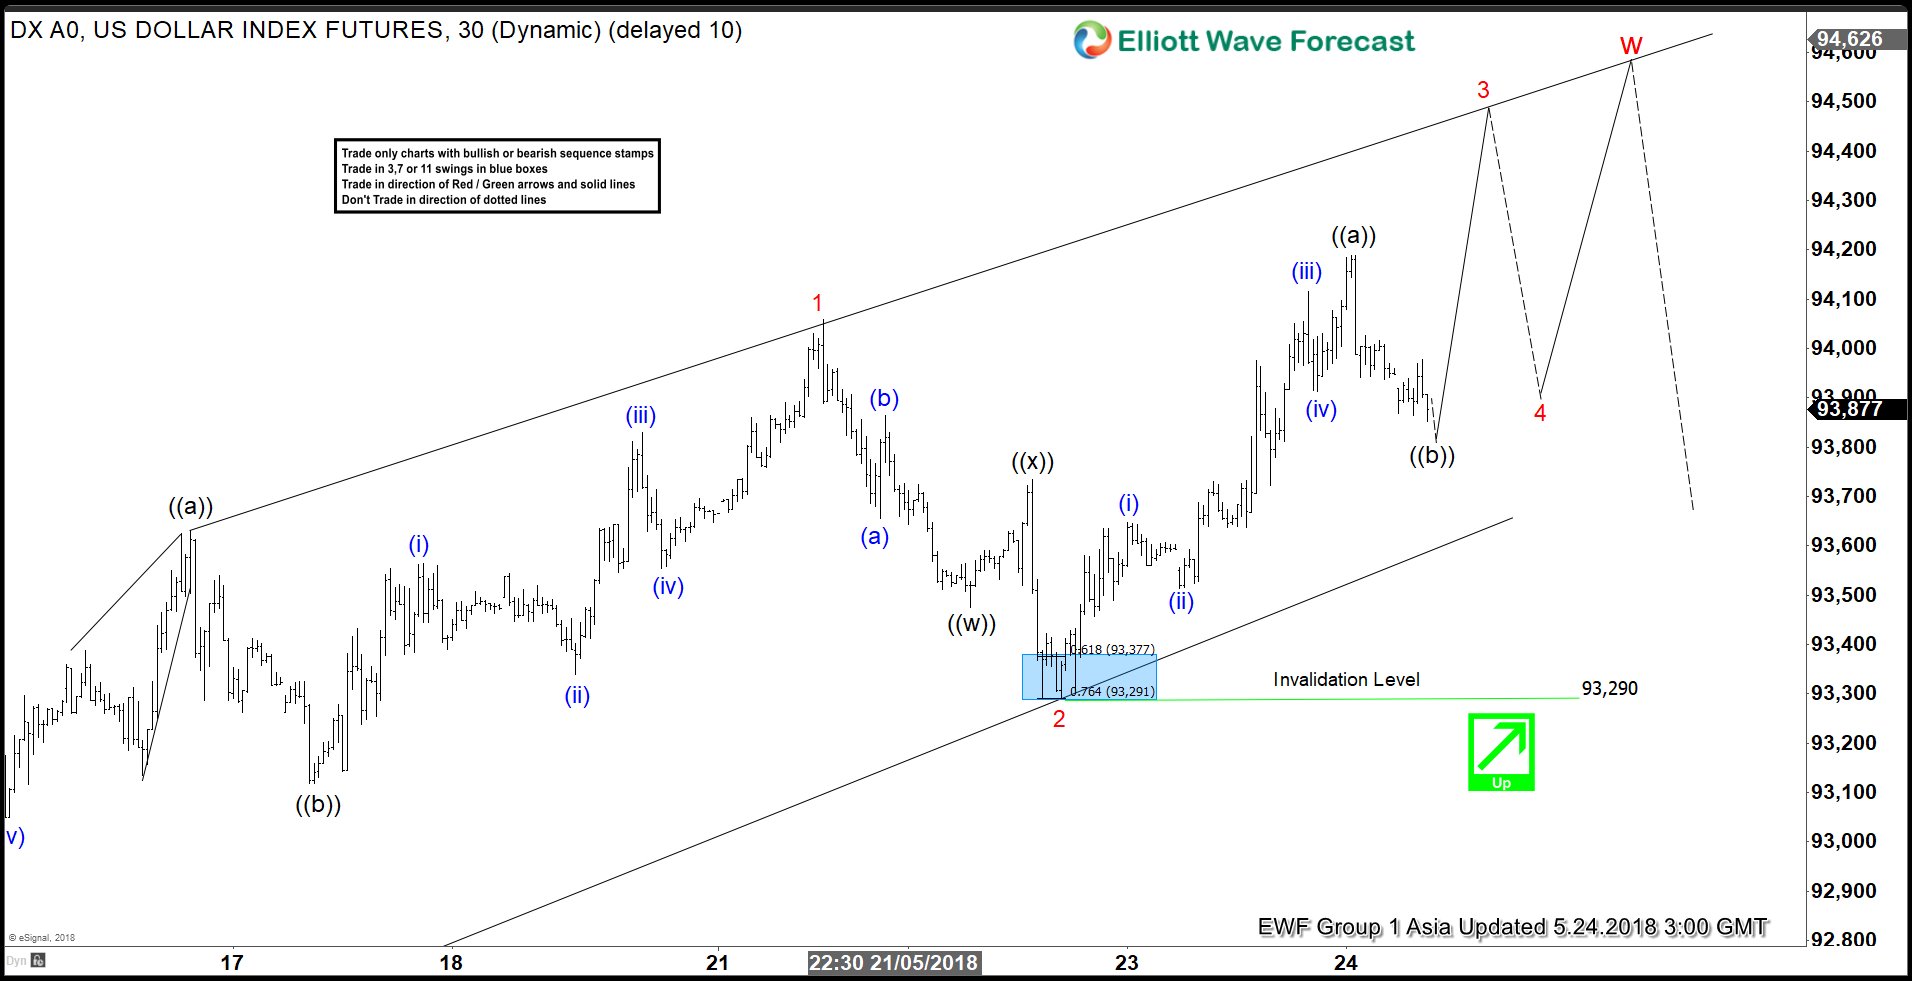
USDX Elliott Wave View: Ending Diagonal In Progress
Read MoreUSDX short-term Elliott Wave view suggests that the rally from 5/14 low 92.24 is extending higher as Elliott Wave Ending diagonal structure within Intermediate wave (5). Keep in mind that Ending Diagonal usually appears in sub-division of wave (5) of impulse or wave C of Zigzag or Flat. In Ending Diagonal, the internal distribution of […]
-
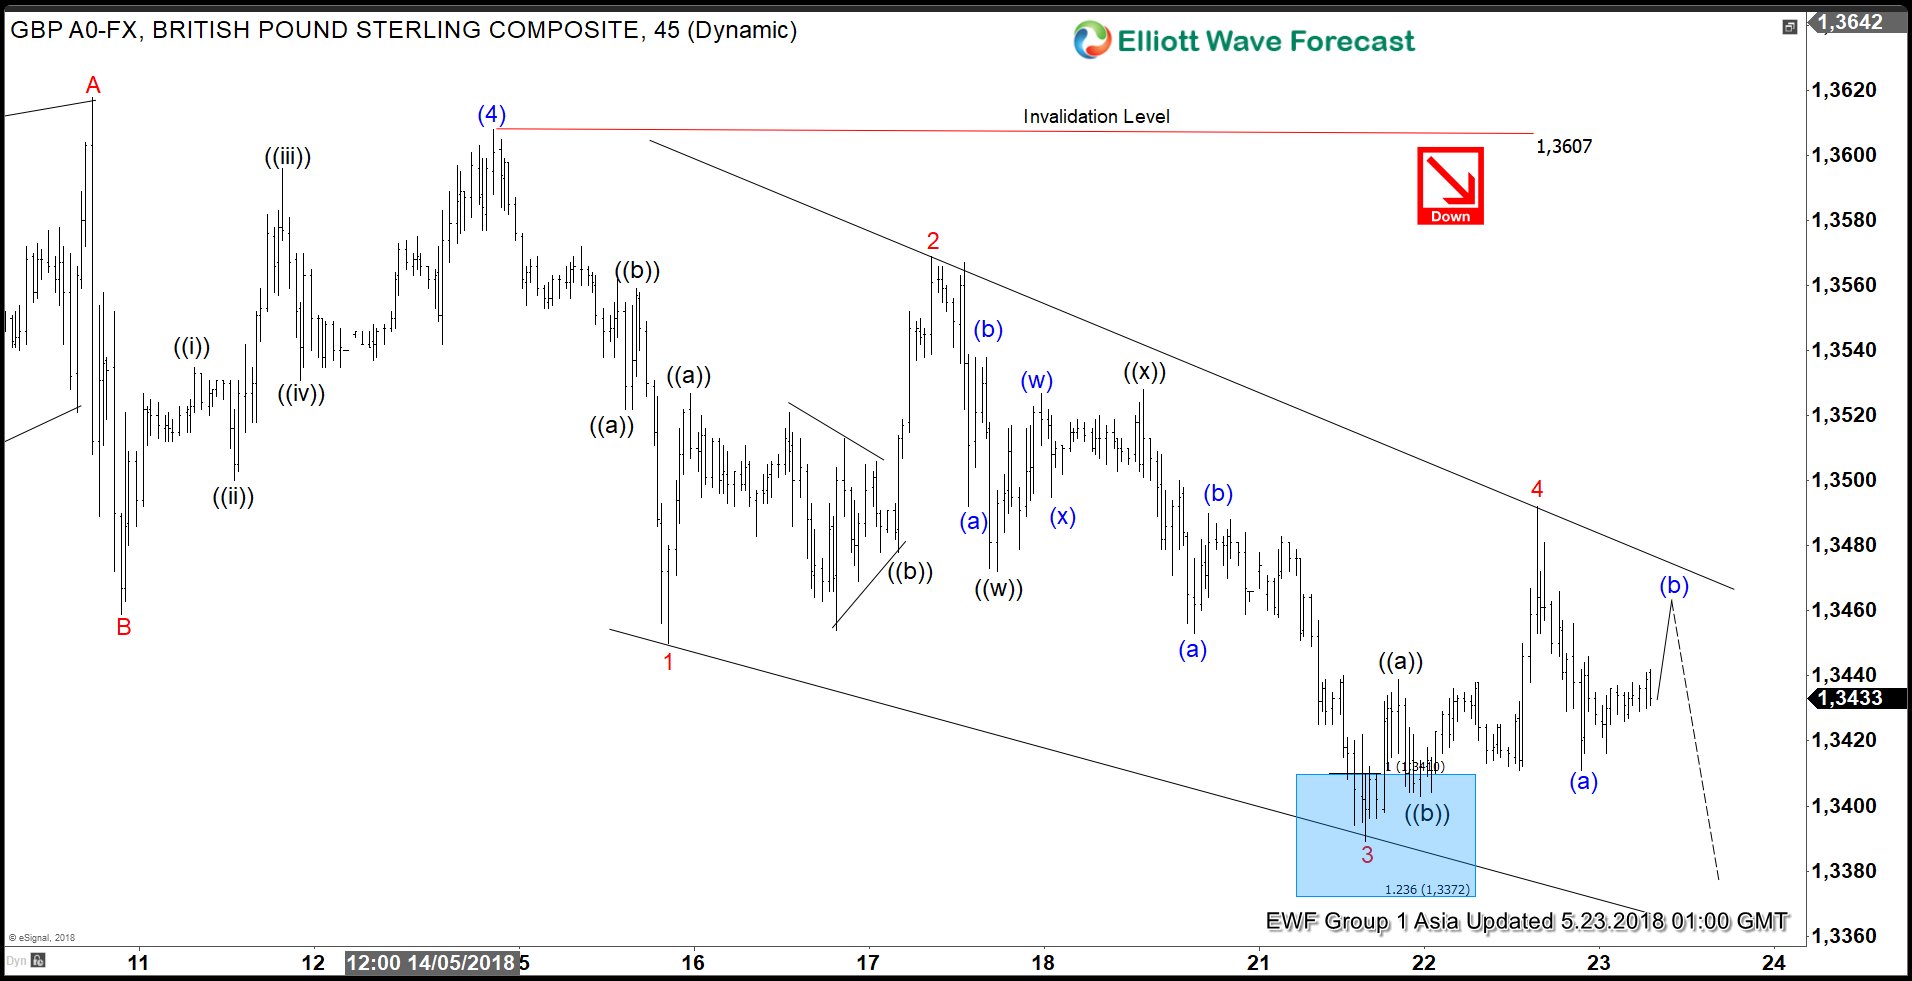
GBPUSD Elliott Wave View: Showing Impulse Structure
Read MoreGBPUSD Elliott wave view in short-term cycle suggests that the decline from 4/17/2018 high (1.4377) is unfolding as an impulse Elliott wave structure where bounce to 1.3607 high ended Intermediate wave (4). Down from there, intermediate wave (5) remains in progress as Elliott Wave ending diagonal structure. Ending diagonal usually appears in the sub-division of wave (5) of […]
-
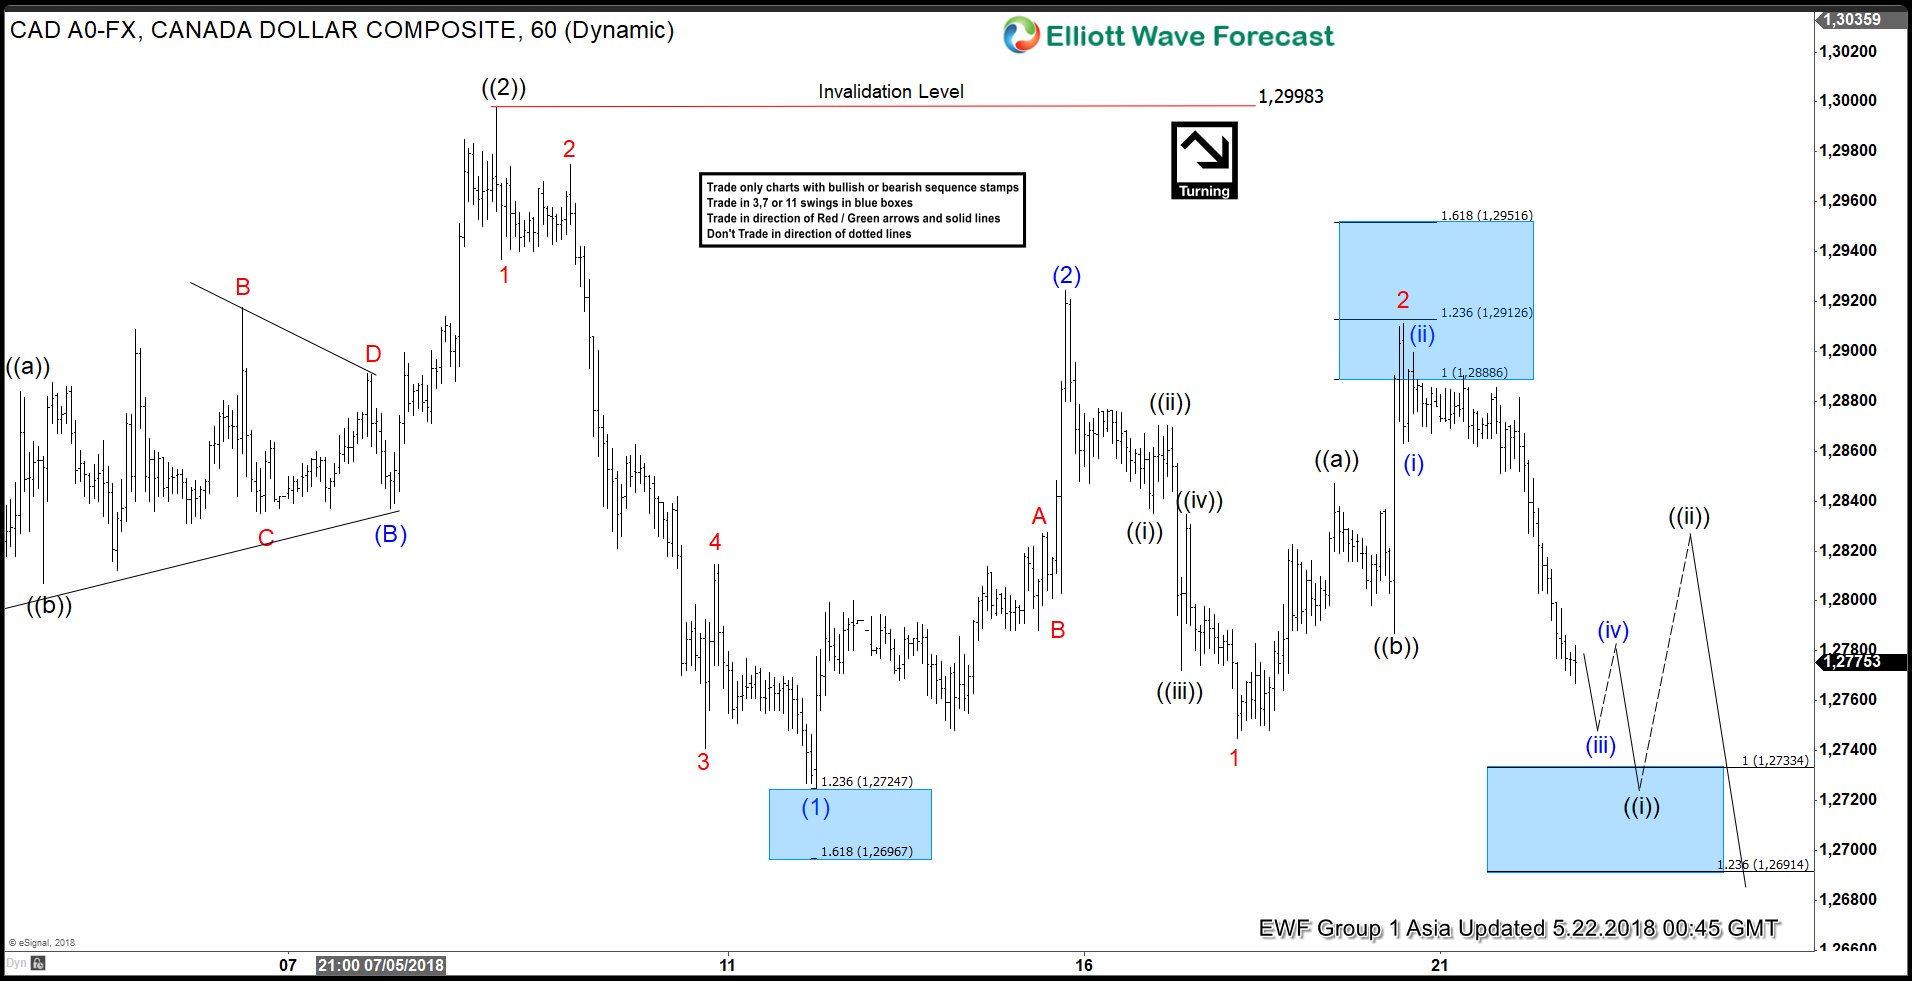
USDCAD Extending Lower As Elliott Wave Impulse
Read MoreUSDCAD short-term Elliott Wave view suggests that the bounce to 1.2998 on 5/08 high ended primary wave ((2)). Below from there, primary wave ((3)) remains in progress as an Impulse Elliott Wave structure looking for more downside extension. In Impulse wave, the subdivision of wave 1, 3, and 5 is also an impulse structure of […]