
-
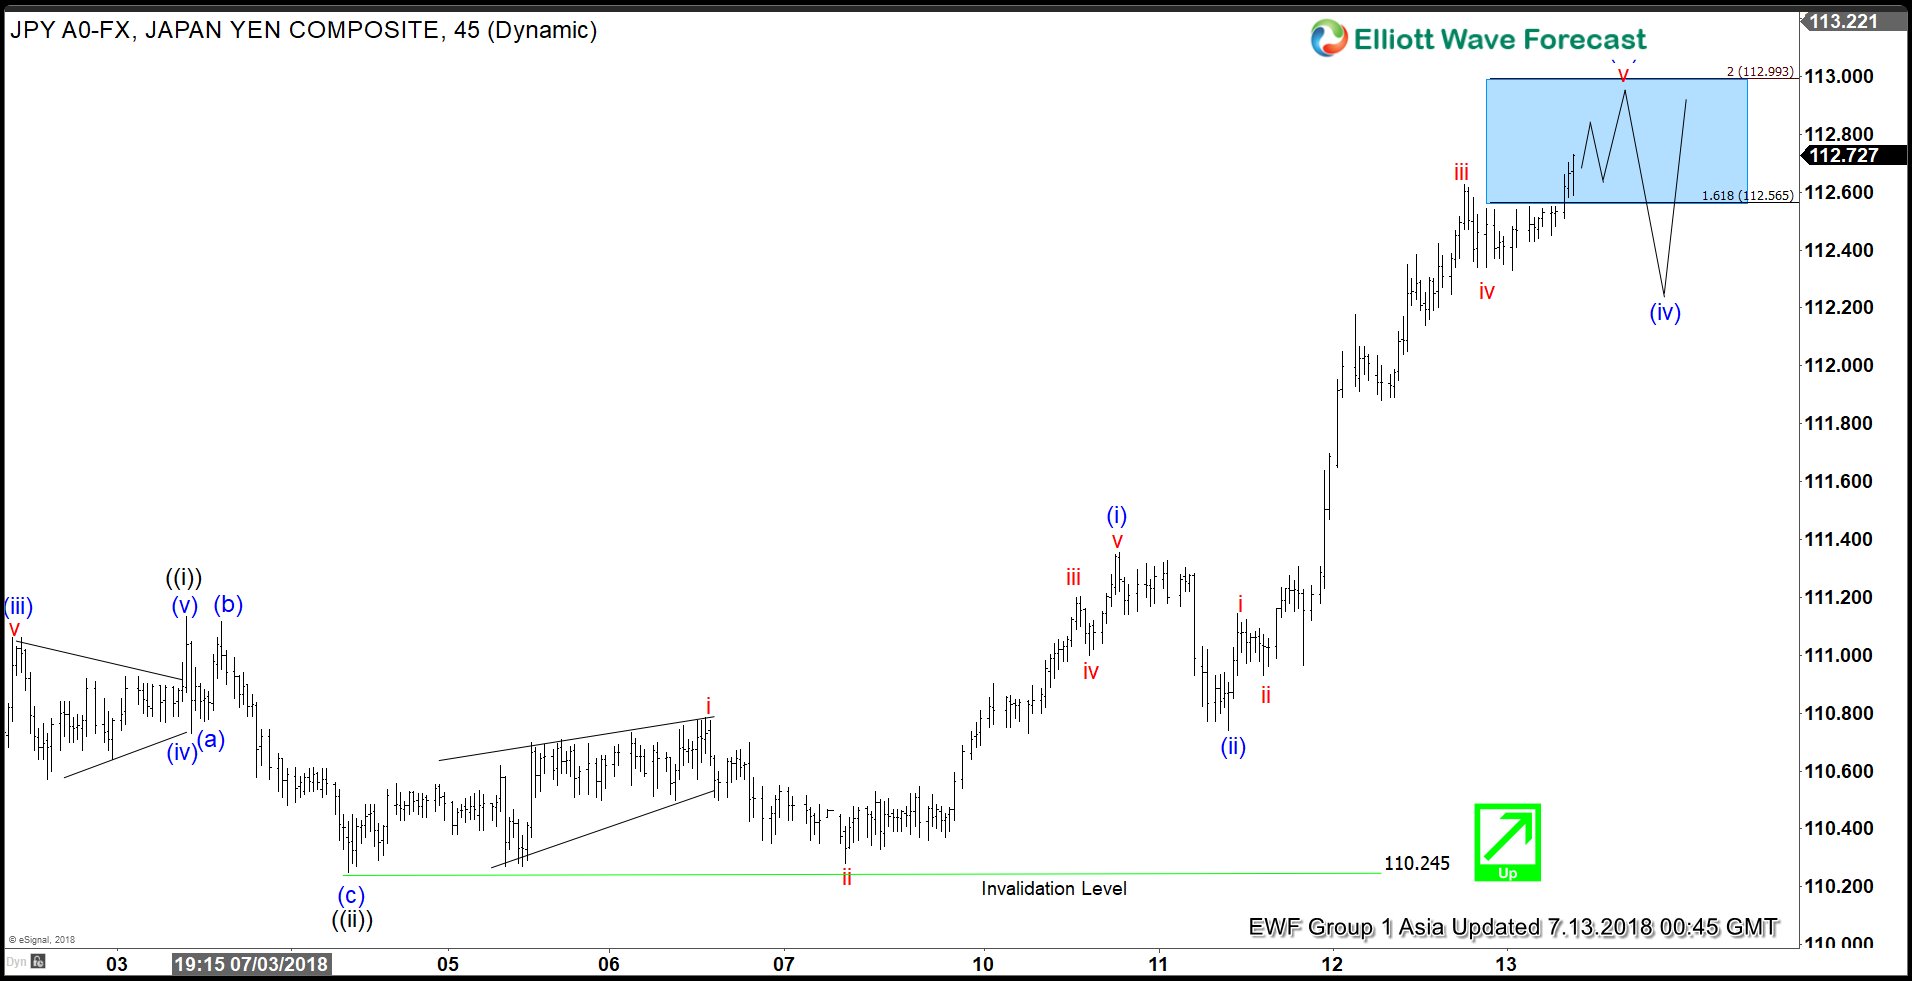
Elliott Wave Analysis: USDJPY Extending Higher As Impulse
Read MoreUSDJPY short-term Elliott Wave view suggests that the rally to 111.13 high ended Minute wave ((i)). Down from there, the pullback to 110.24 low ended Minute wave ((ii)). The internals of that pullback unfolded as a Flat Elliott Wave structure where Minutte wave (a) ended in lesser degree 3 swings at 110.77. Then bounce to […]
-
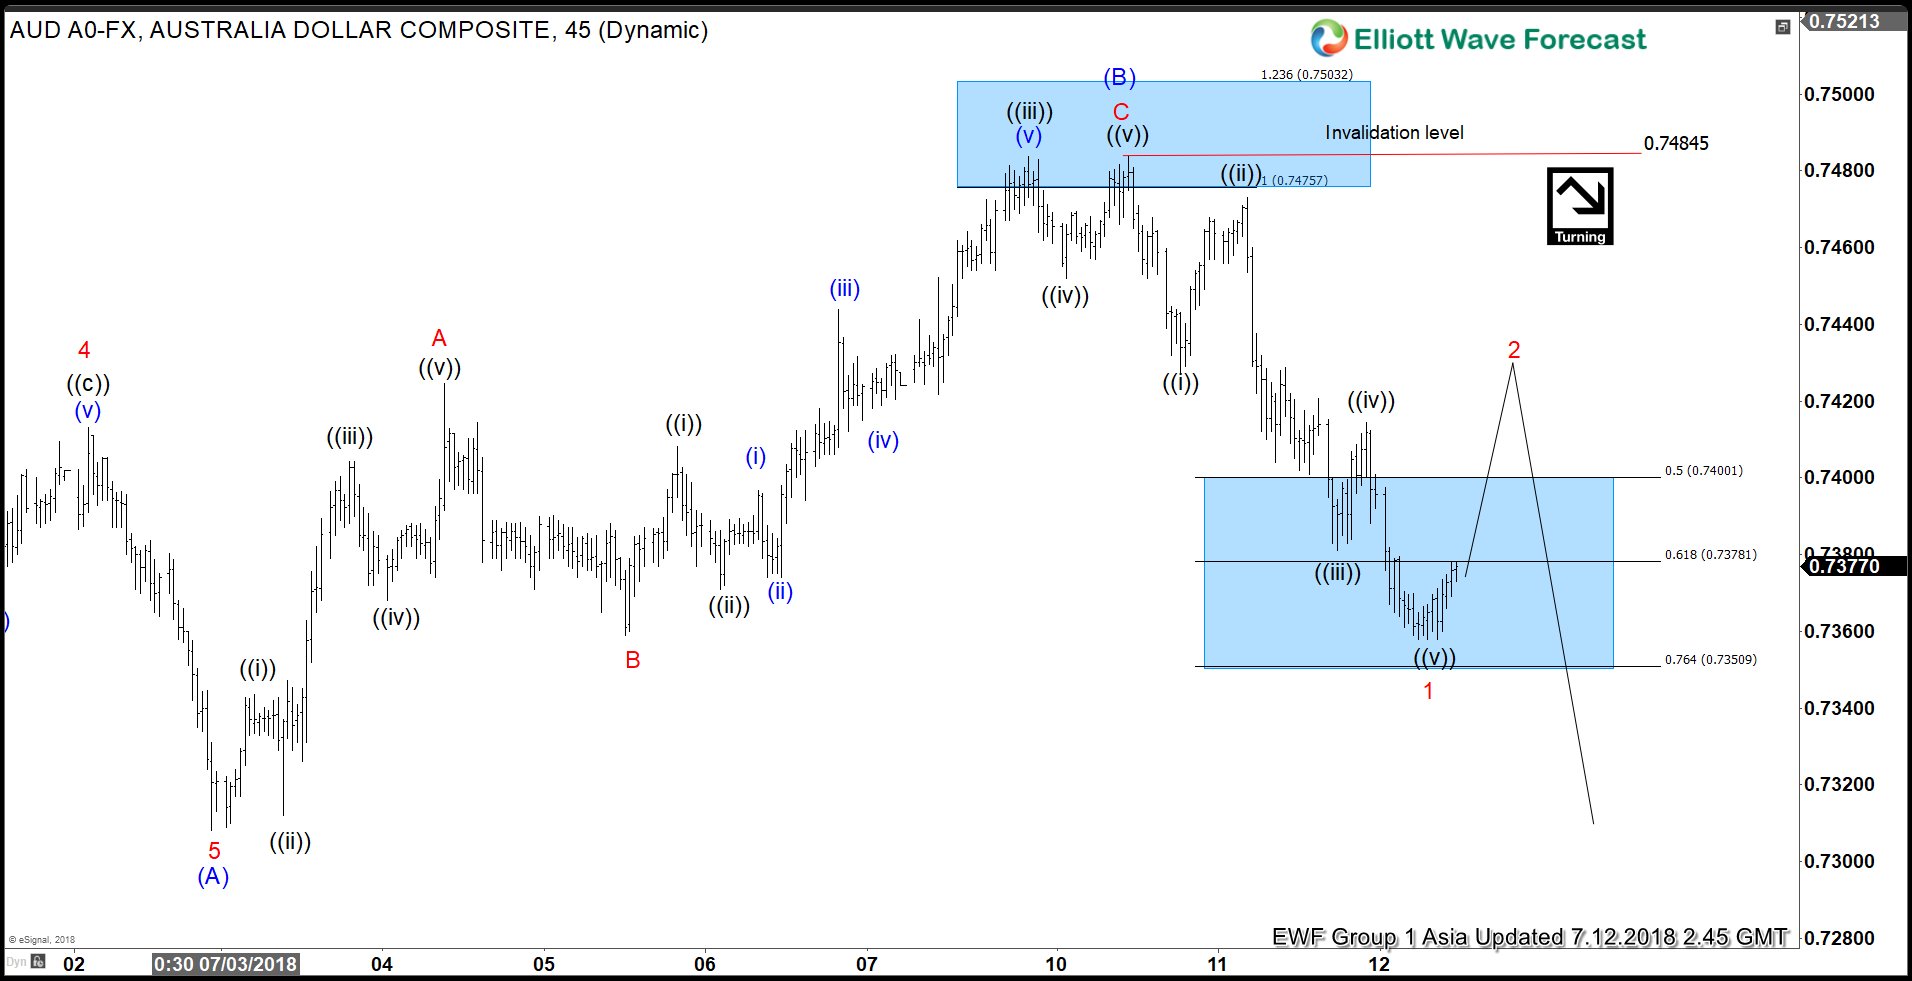
Elliott Wave Analysis: Is AUDUSD Ready to Resume Lower?
Read MoreAUDUSD short-term Elliott Wave view suggests that the decline to $0.7308 low ended Intermediate wave (A) of a possible Zigzag structure coming from 6/06/2018 peak ($0.7676). Above from there, the 3 waves recovery to $0.7484 high ended Intermediate wave (B) bounce. The internals of that Intermediate wave (B) unfolded as Elliott Wave Zigzag correction where […]
-
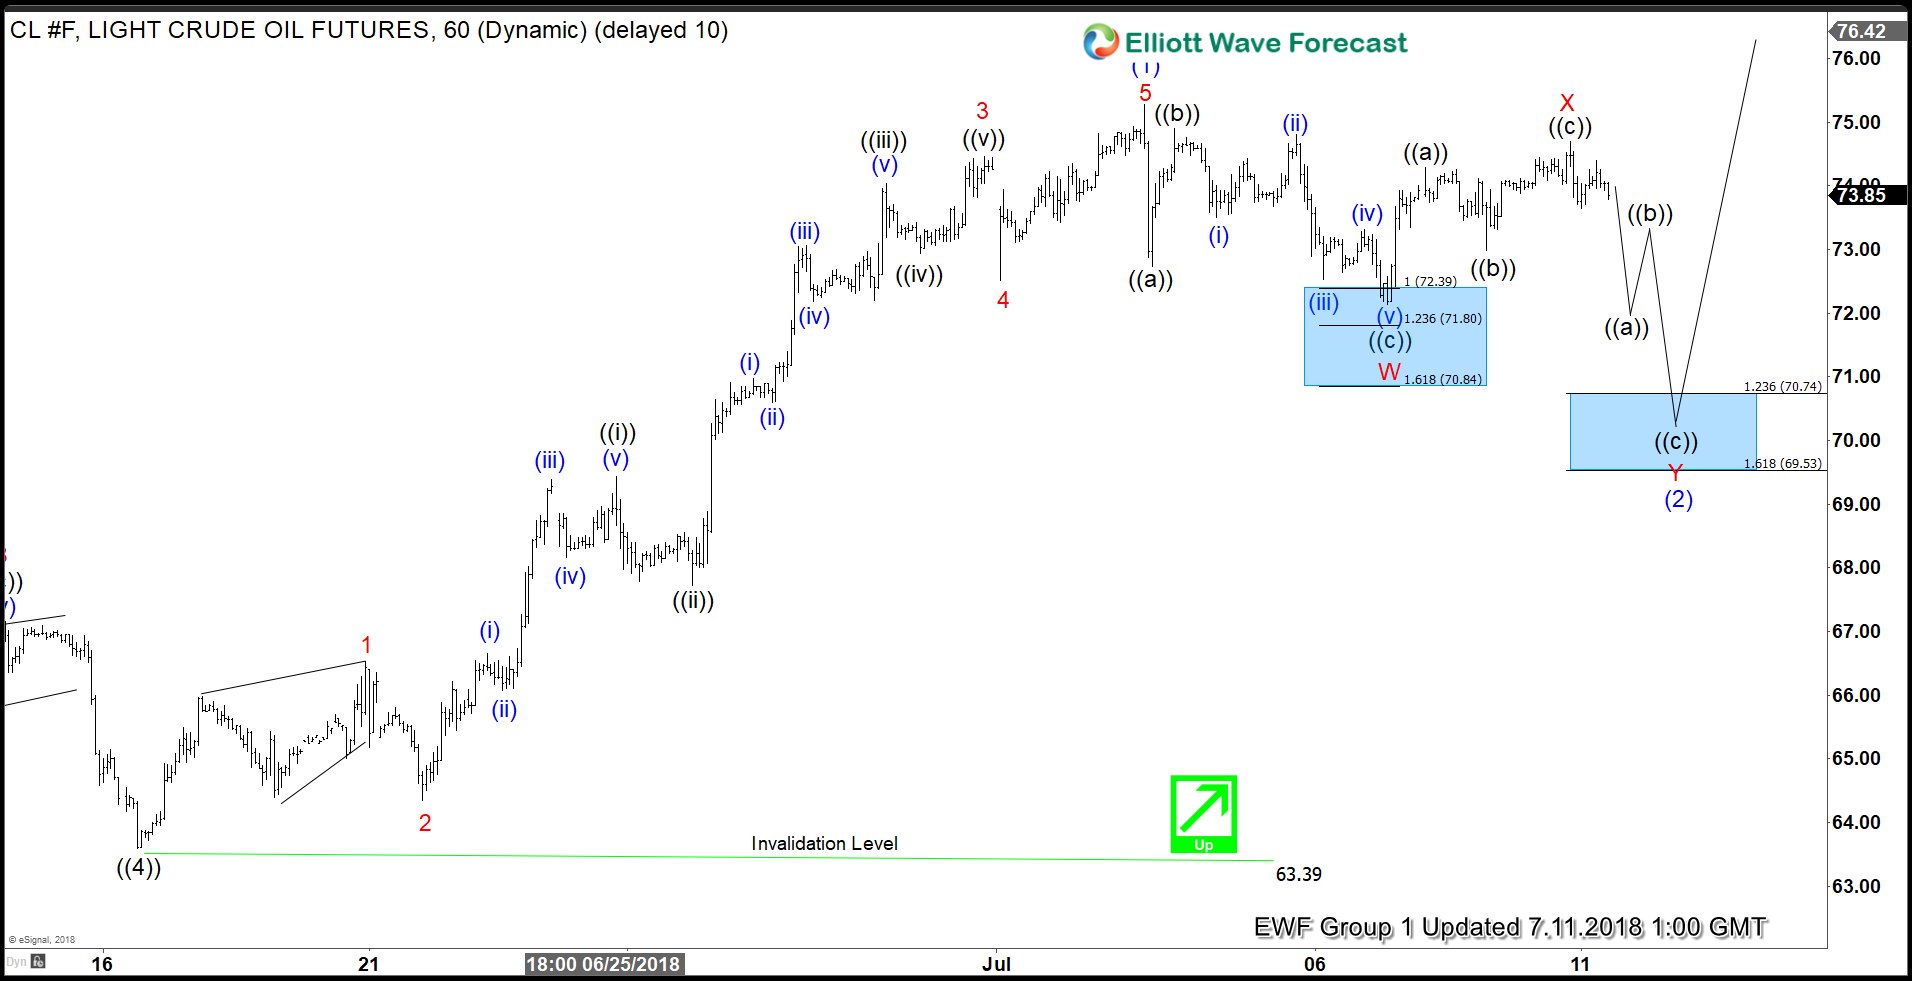
OIL Elliott Wave View: Providing Buying Opportunity Soon
Read MoreOIL short-term Elliott Wave view suggests that the pullback to $63.39 on 6/18/2018 low ended primary wave ((4)). Up from there, the instrument rallied strongly to the upside and went on to make new high for the year. A rally from there took place in the form of an Impulse Elliott wave structure with extension with lesser degree […]
-
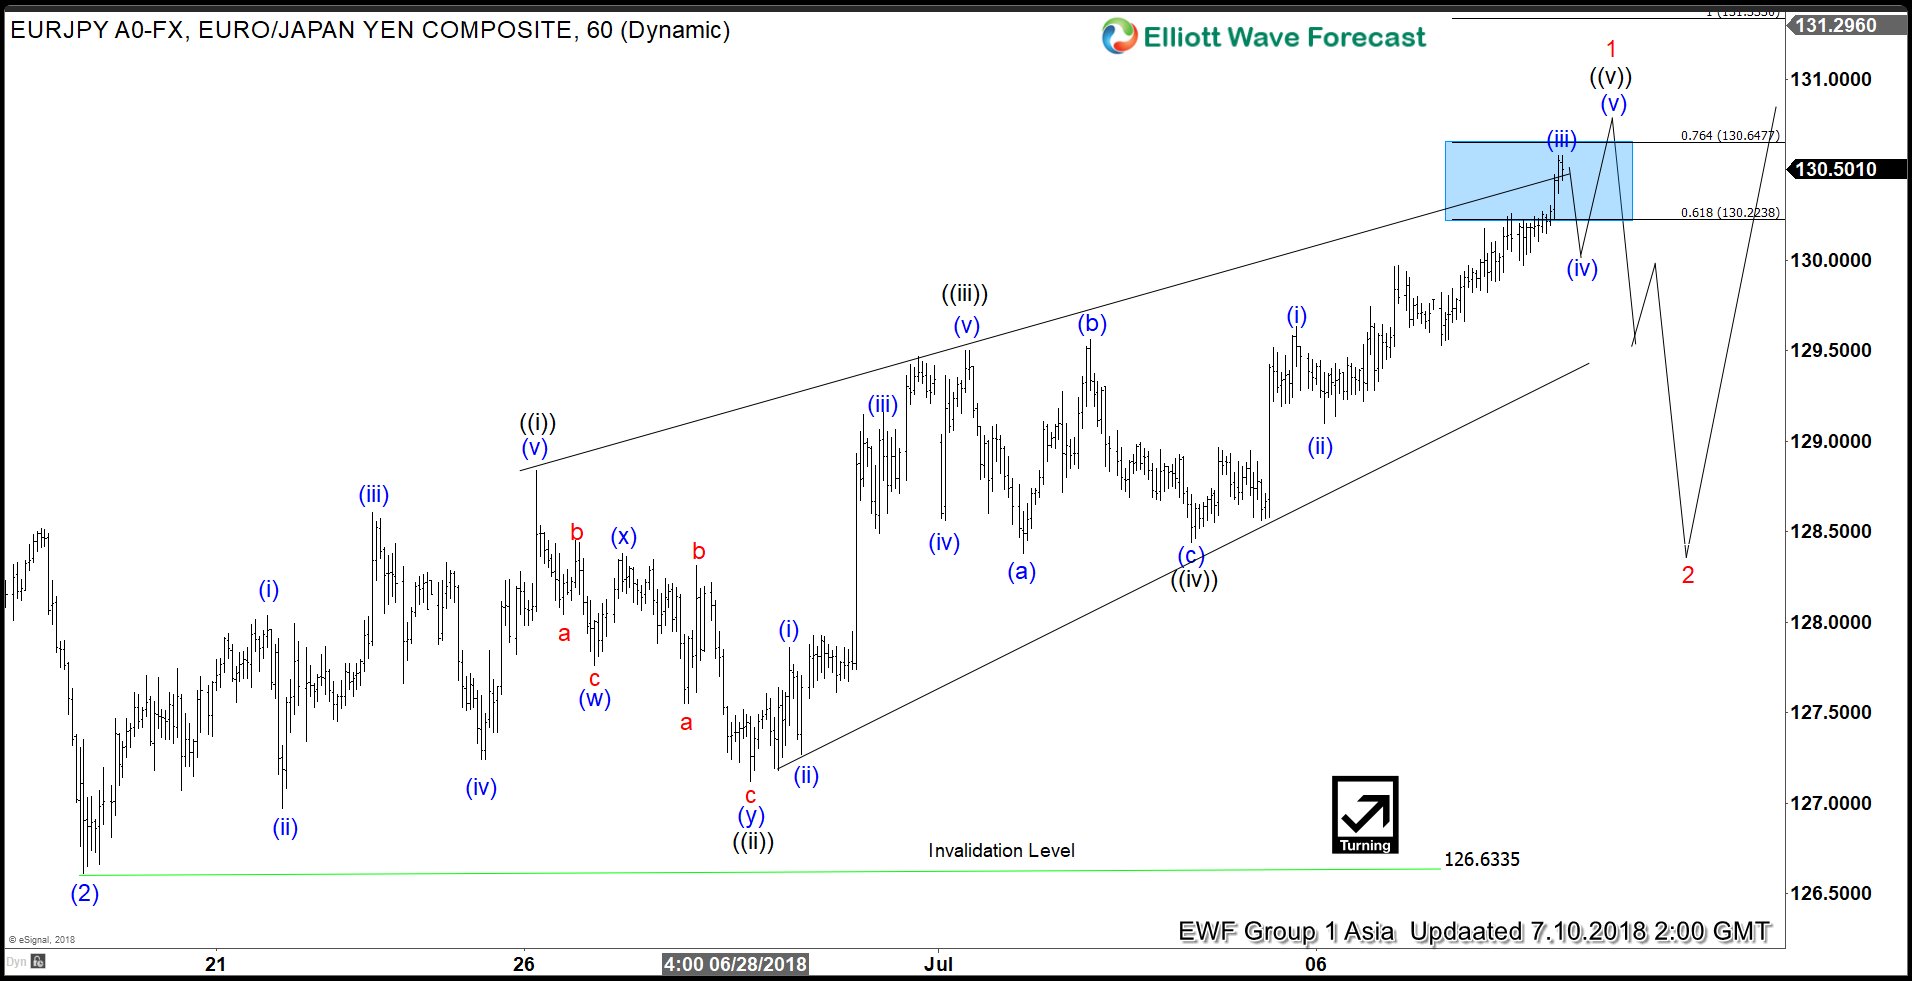
EURJPY Elliott Wave Analysis: Pullback can Provide Buying Opportunity
Read MoreEURJPY short-term Elliott wave analysis suggests that the decline to $126.63 on 6/19 low ended intermediate wave (2) pullback. Up from there, intermediate wave (3) remains in progress as Elliott wave impulse. The internals of Minor wave 1 is unfolding as a leading diagonal with sub-division of 5-3-5-3-5. Up from $126.63 low, Minute wave ((i)) […]
-
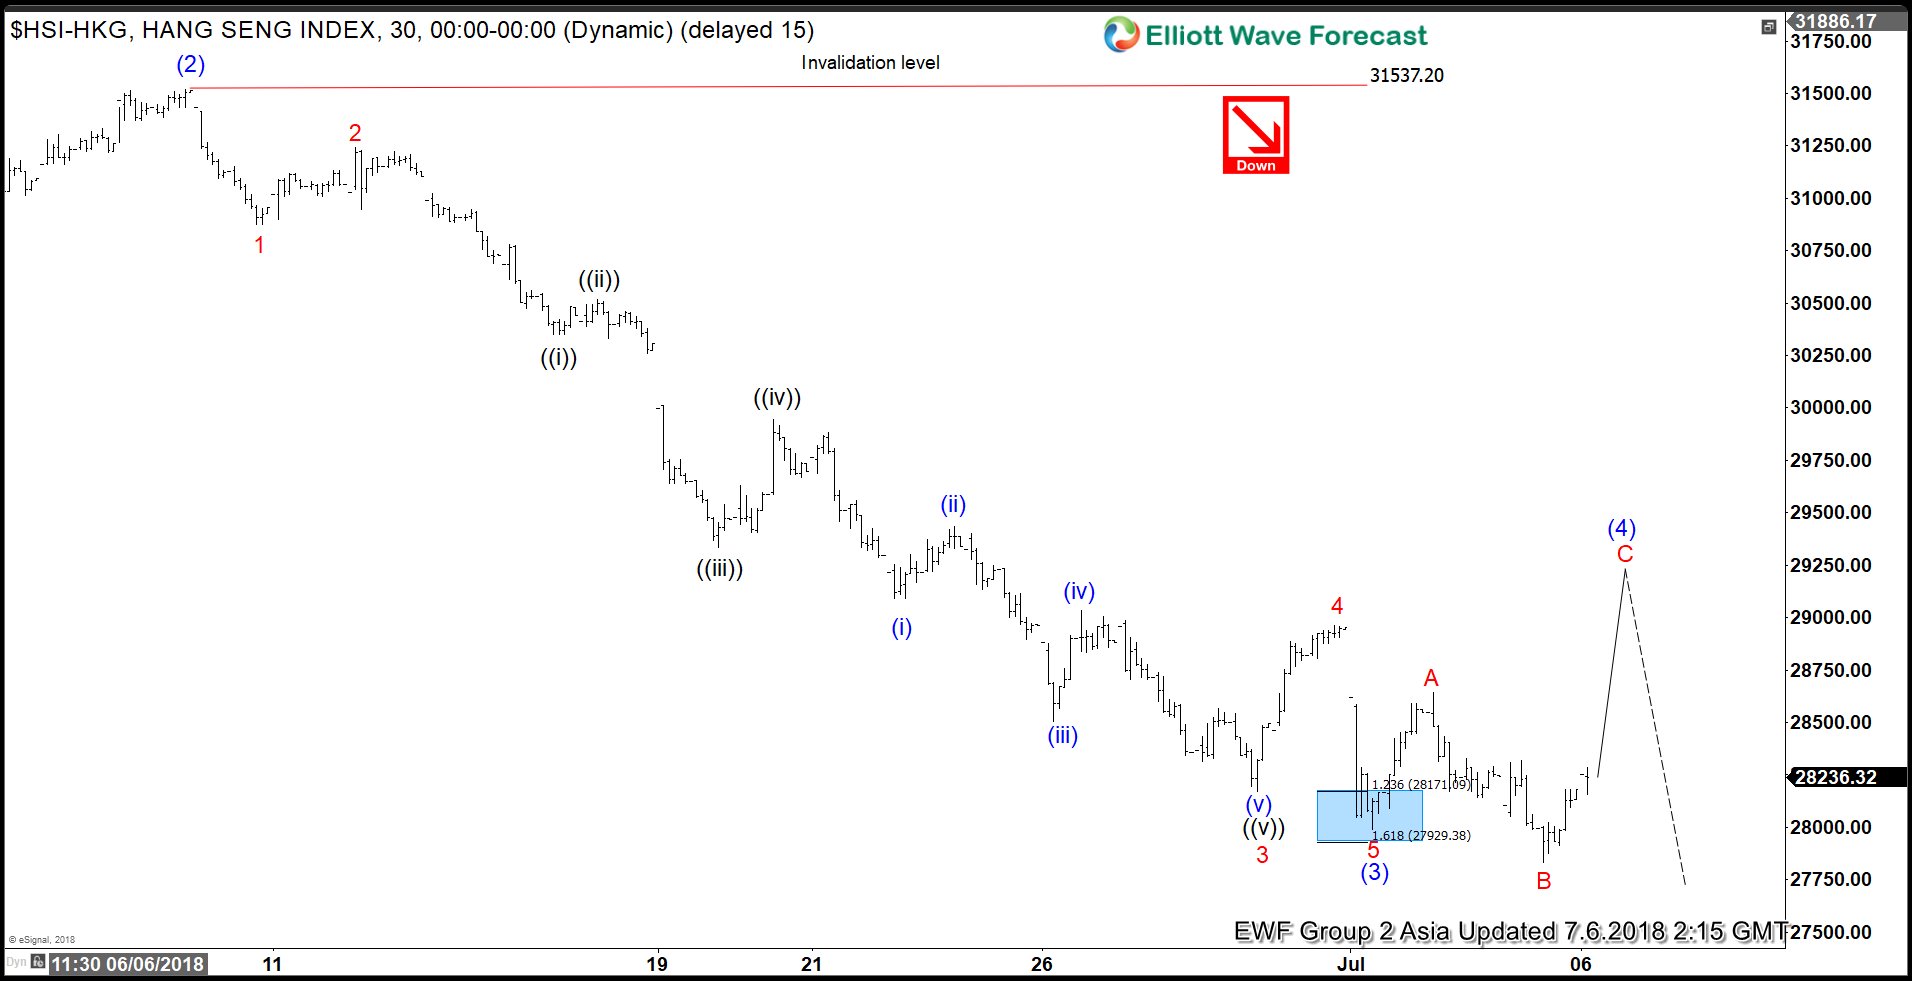
Hang Seng Elliott Wave Analysis: Correction Happening
Read MoreHang Seng short-term Elliott wave view suggests that the rally to 31521.13 high on 6/07/2018 peak ended Intermediate wave (2). Down from there, the decline to 27990.45 low is proposed to have completed Intermediate wave (3). The internals of Intermediate wave (3) unfolded as Elliott Wave Impulse structure with extension. This suggests the sub-division of […]
-
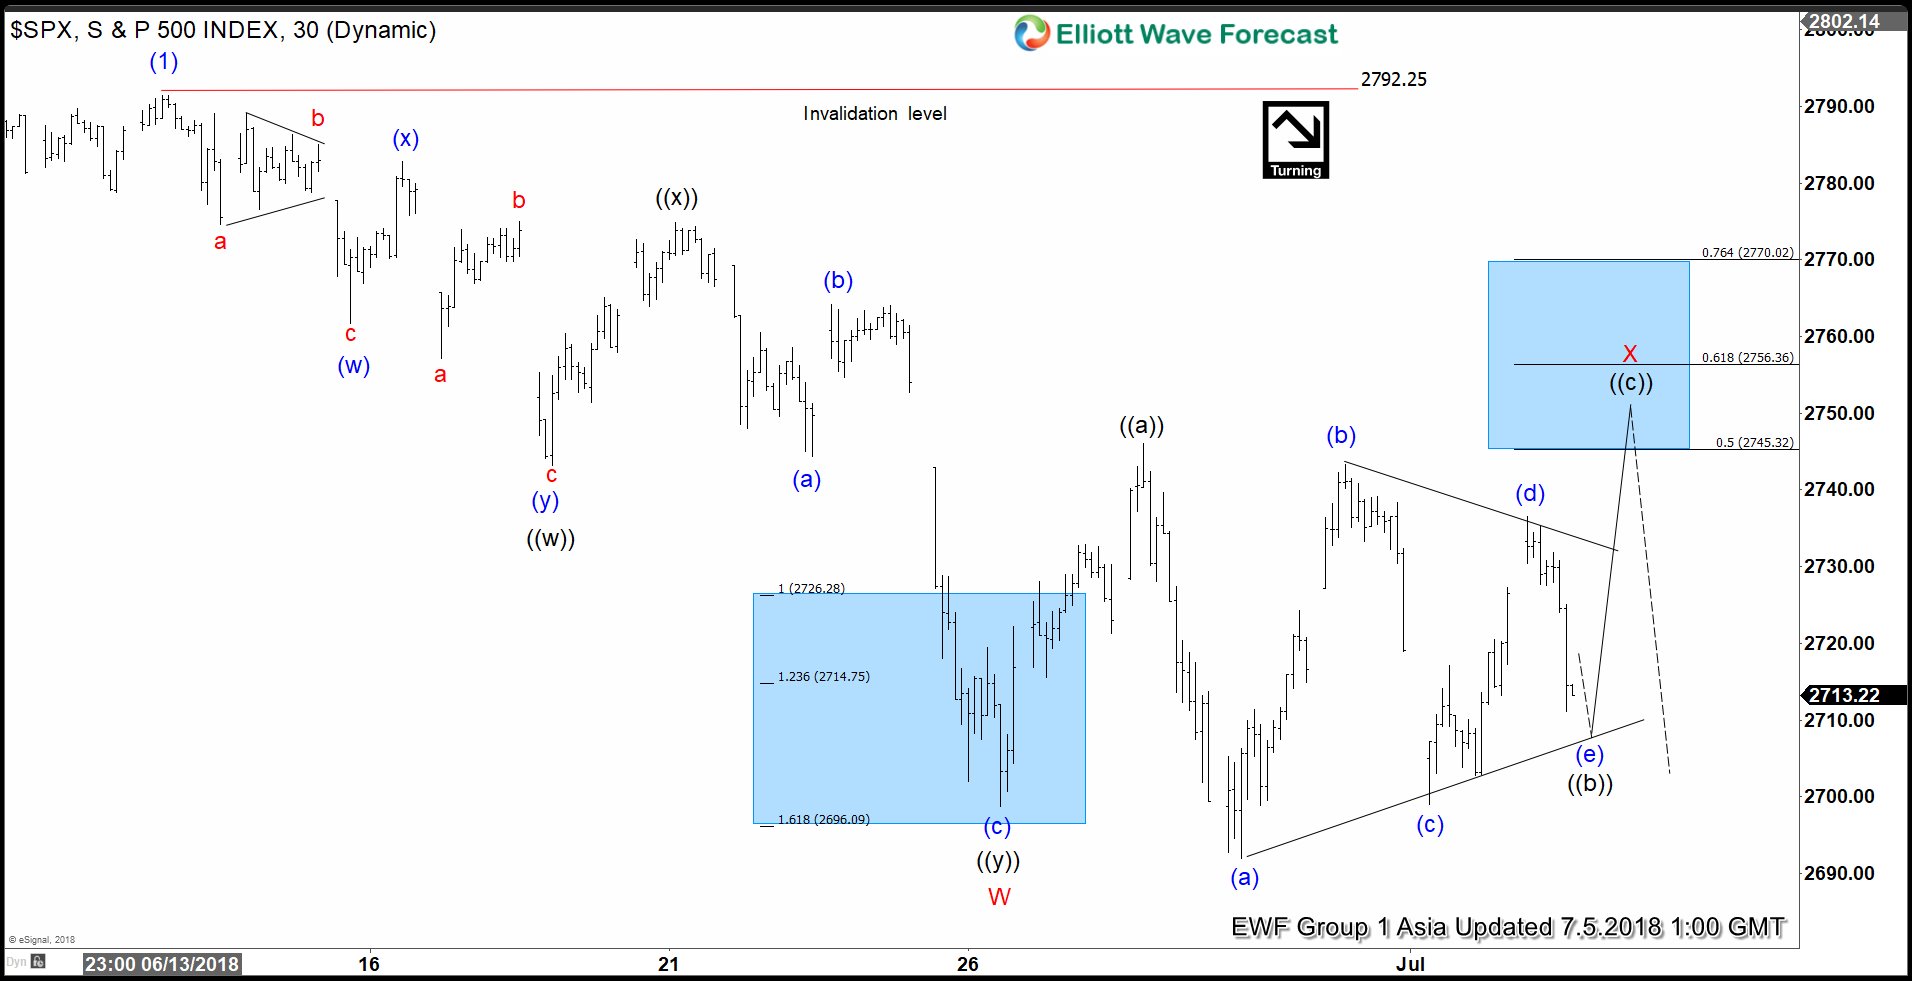
SPX Elliott Wave Analysis: Calling Correction Lower
Read MoreSPX short-term Elliott wave analysis suggests that the rally from 4/02/2018 low to $2792.25 ended the intermediate wave (1). Down from there, correction against that cycle remains in progress in 3, 7 or 11 swing structure. Also, it’s important to note here that the decline from $2792.25 peak shows an overlapping price action thus suggesting that […]