
-
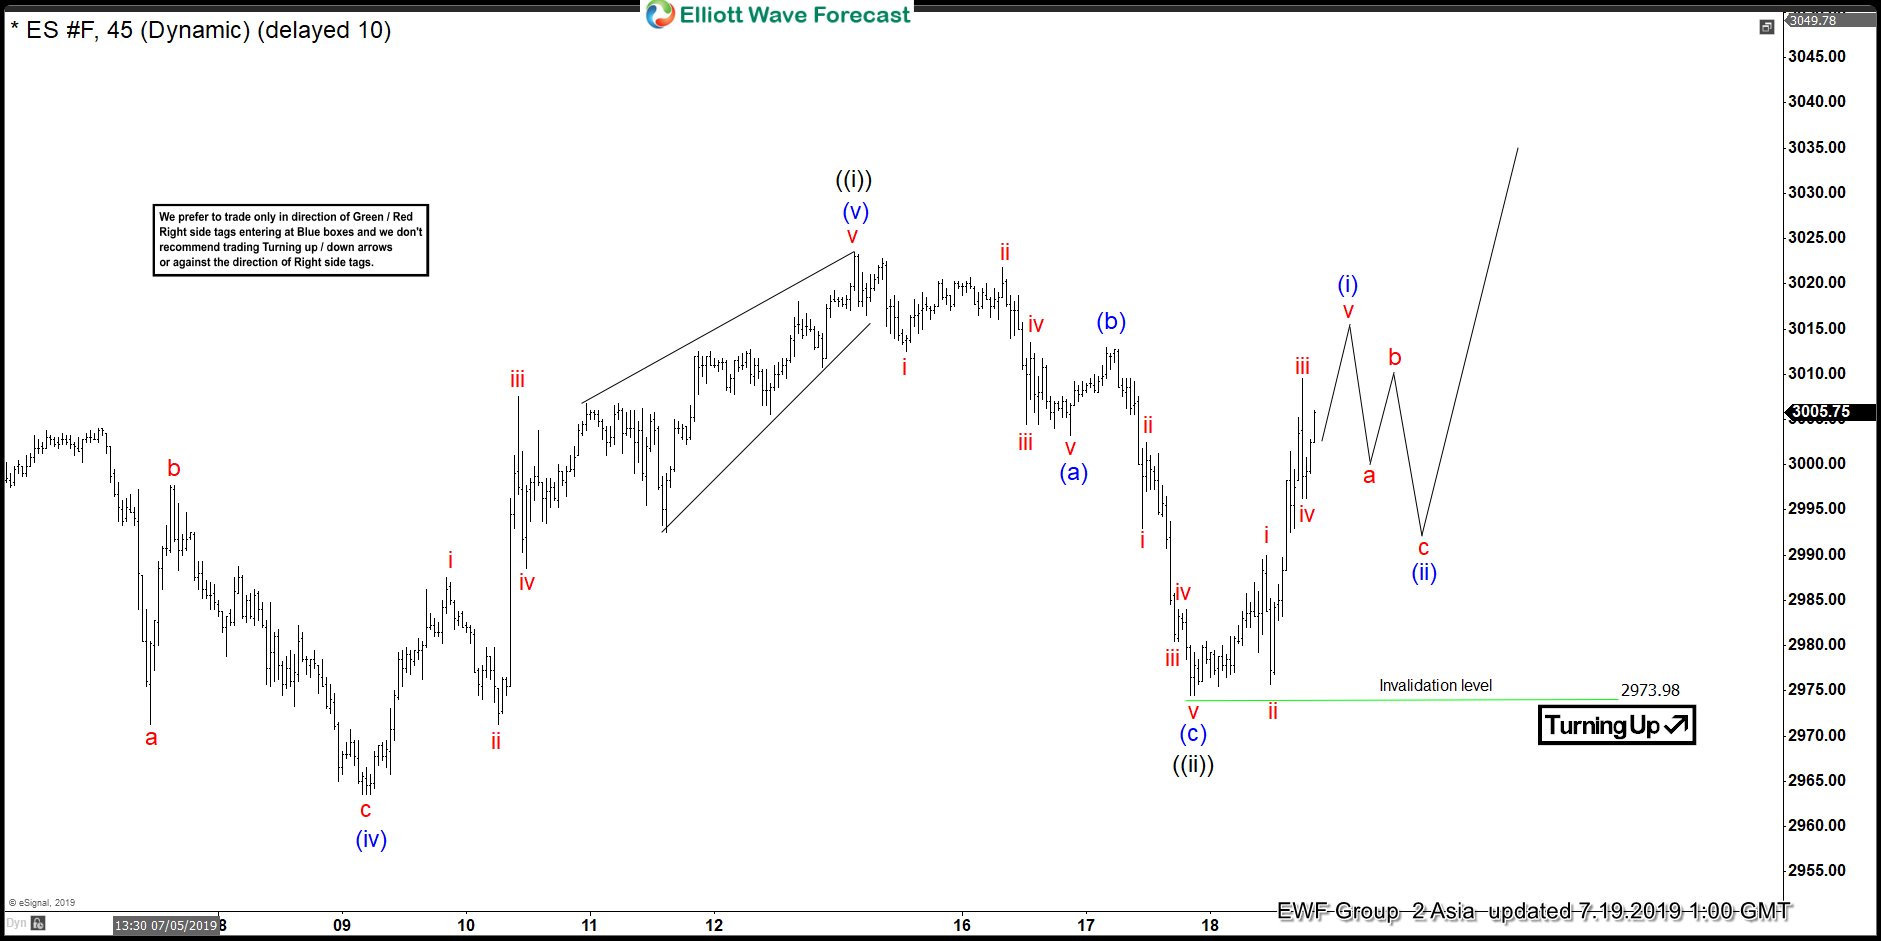
S&P 500 Futures (ES_F) Elliott Wave View: Correction Ended
Read MoreElliott wave view in S&P 500 Futures (ES_F) shows a bullish sequence from December 26, 2018 low favoring the further upside. In the short-term chart below, the index ended the 5 waves rally from 6/13/2019 low within wave ((i)) at $3023.50 high. Down from there, the index corrected the rally from 6/13/2019 low in wave […]
-
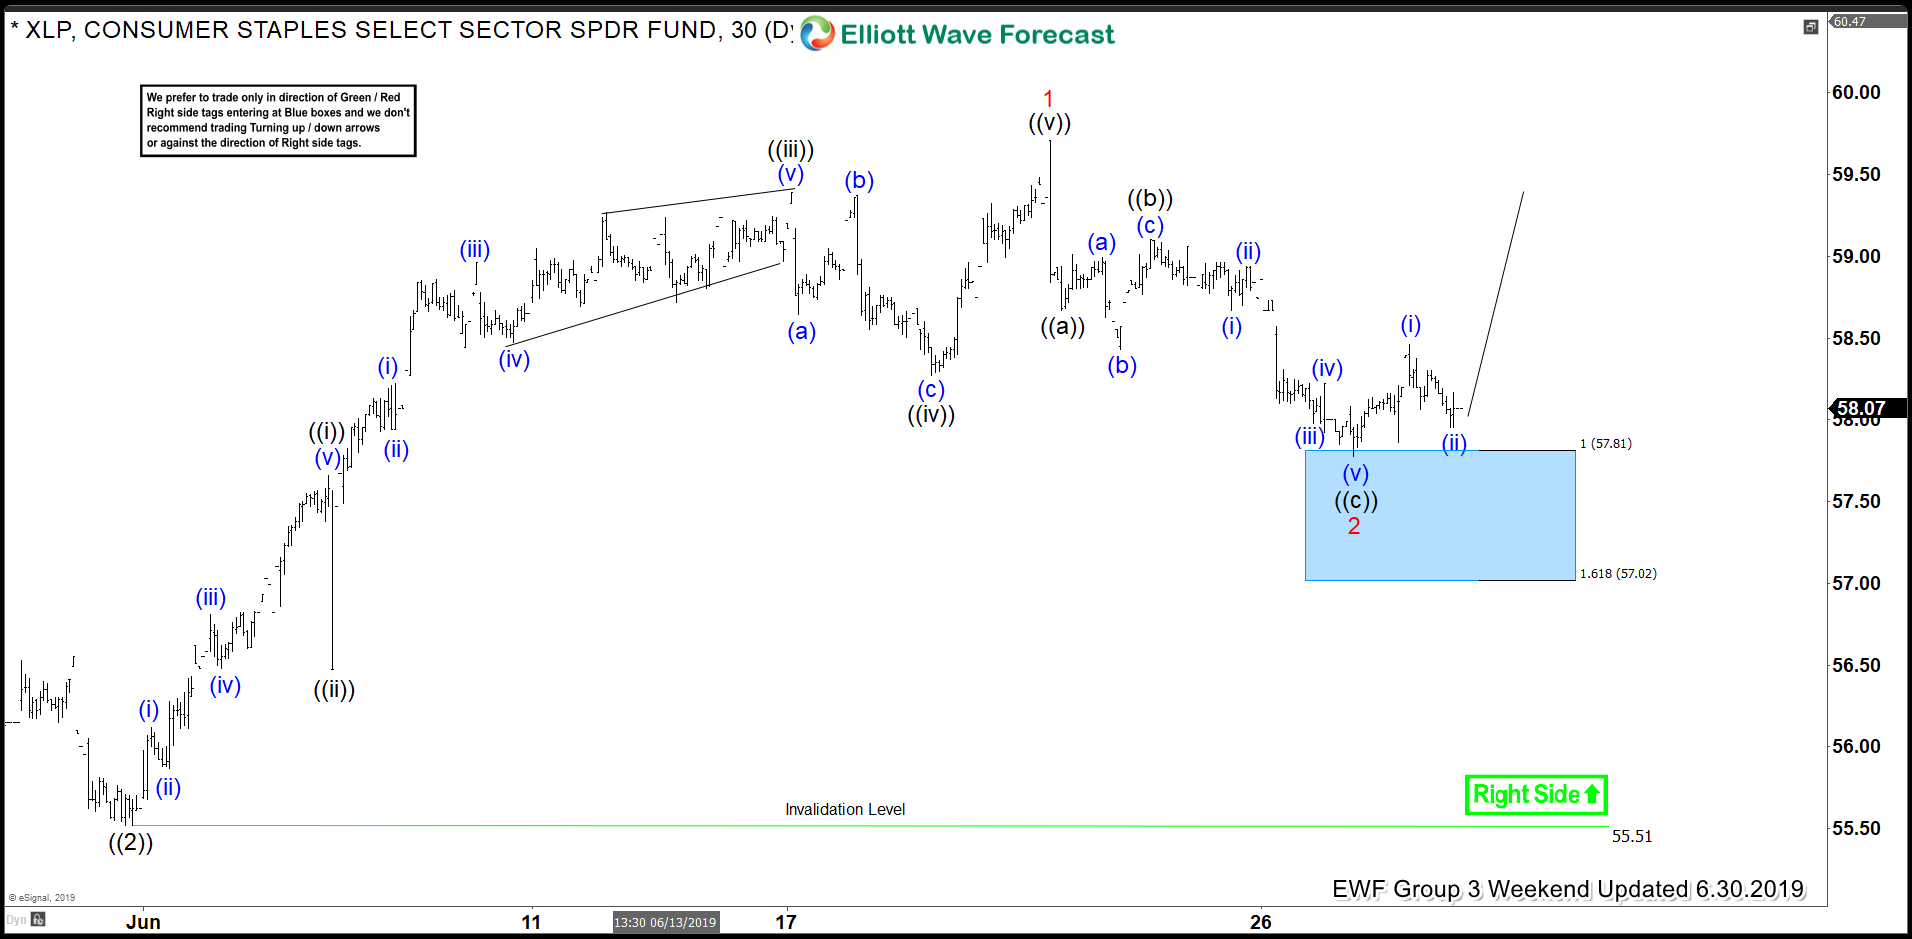
XLP Buying The Elliott Wave Dips At Blue Box Areas
Read MoreIn this blog, we take a look at the past performance of 1 hour Elliott Wave charts of XLP. In which our members took advantage of the blue box areas.
-
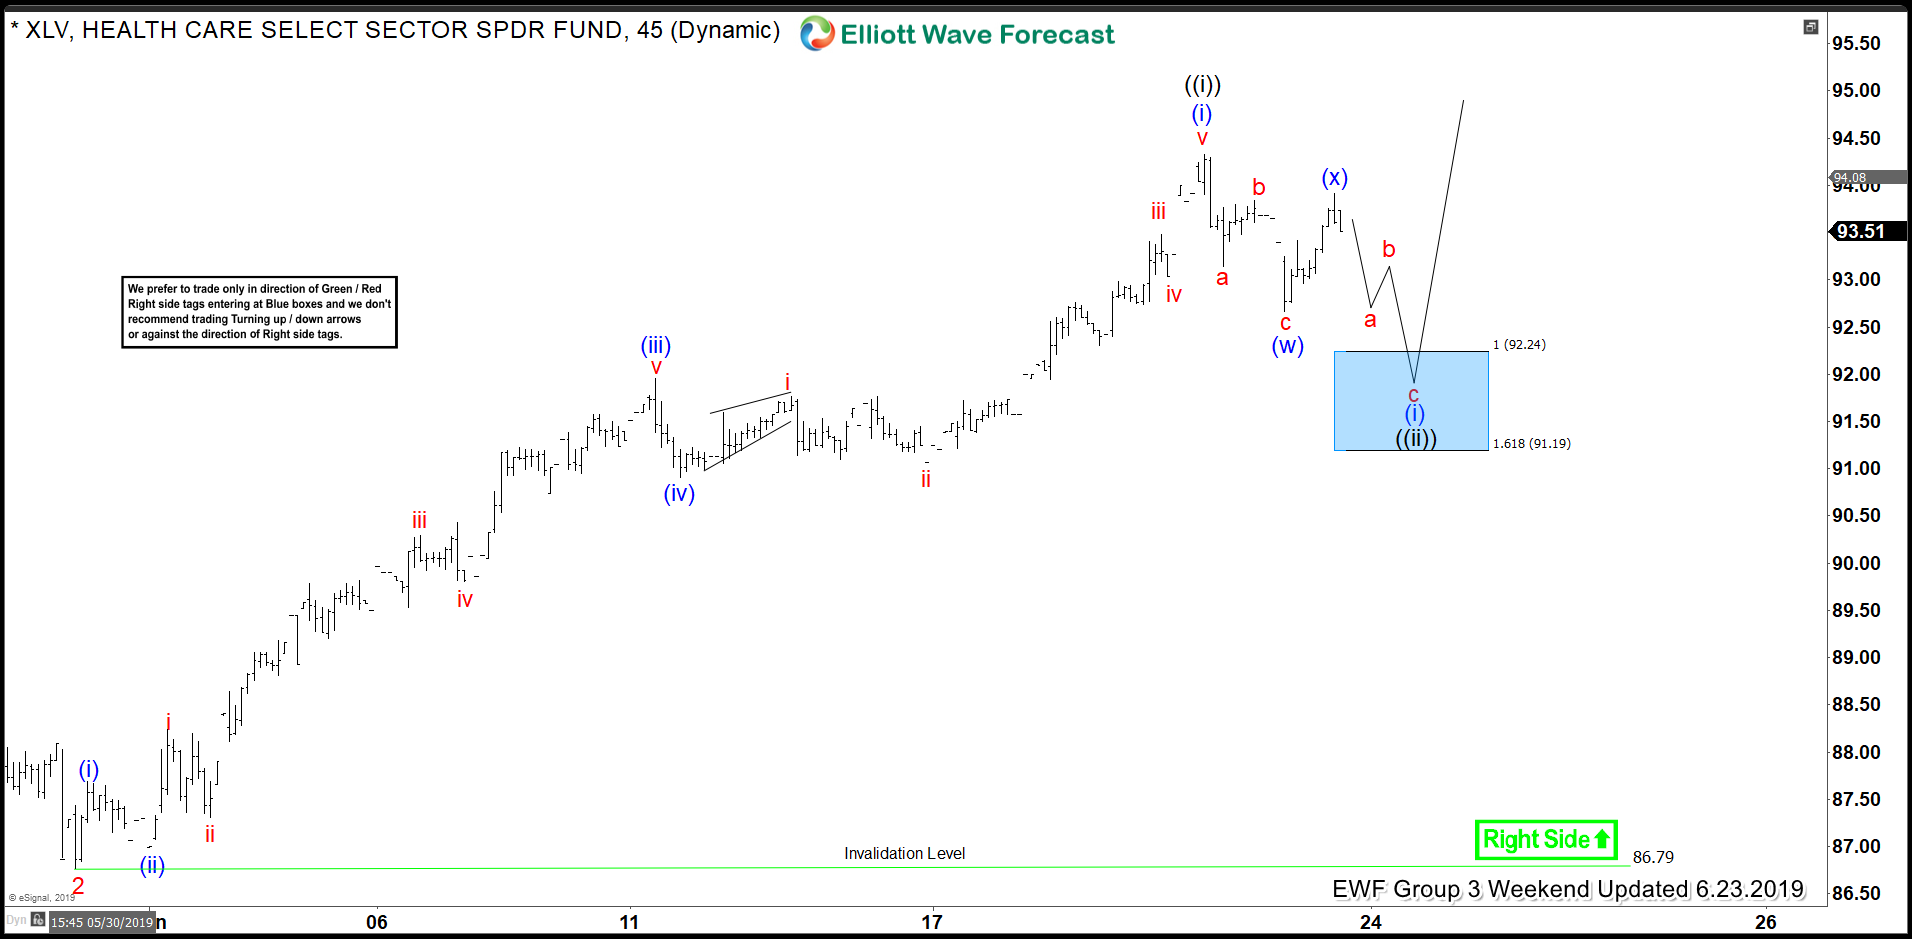
XLV Buying The Elliott Wave Dips Into The Direction Of Right Side Tags
Read MoreIn this blog, we take a look at the past performance of 1 hour Elliott Wave charts of XLV. In which our members took advantage of the blue box areas.
-
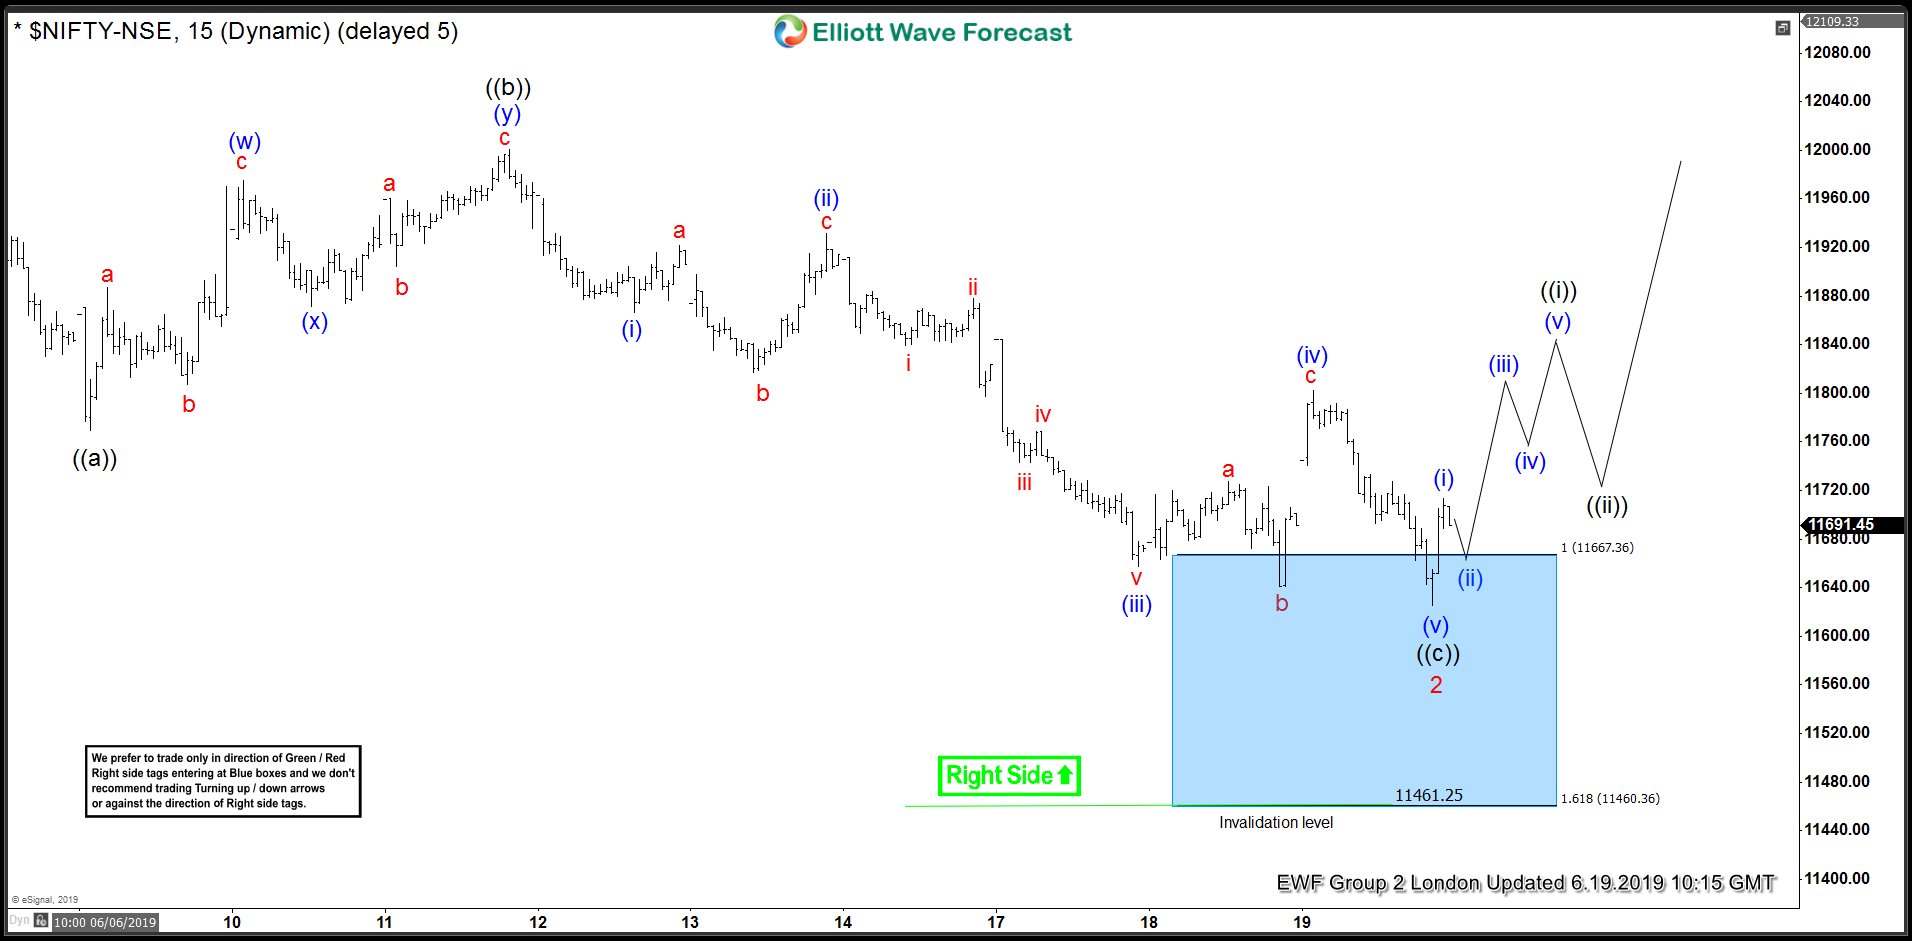
Nifty Elliott Wave View: Buying The Dips At Blue Box Areas
Read MoreIn this blog, we take a look at the past performance of 1 & 4 hour Elliott Wave charts of Nifty. In which our members took advantage of the blue box area
-

Nike Forecasting The Elliott Wave Path
Read MoreIn this technical blog, we take a look at the past performance of 1 hour Elliott Wave charts of Nike, in which our members took the advantage of blue boxes
-
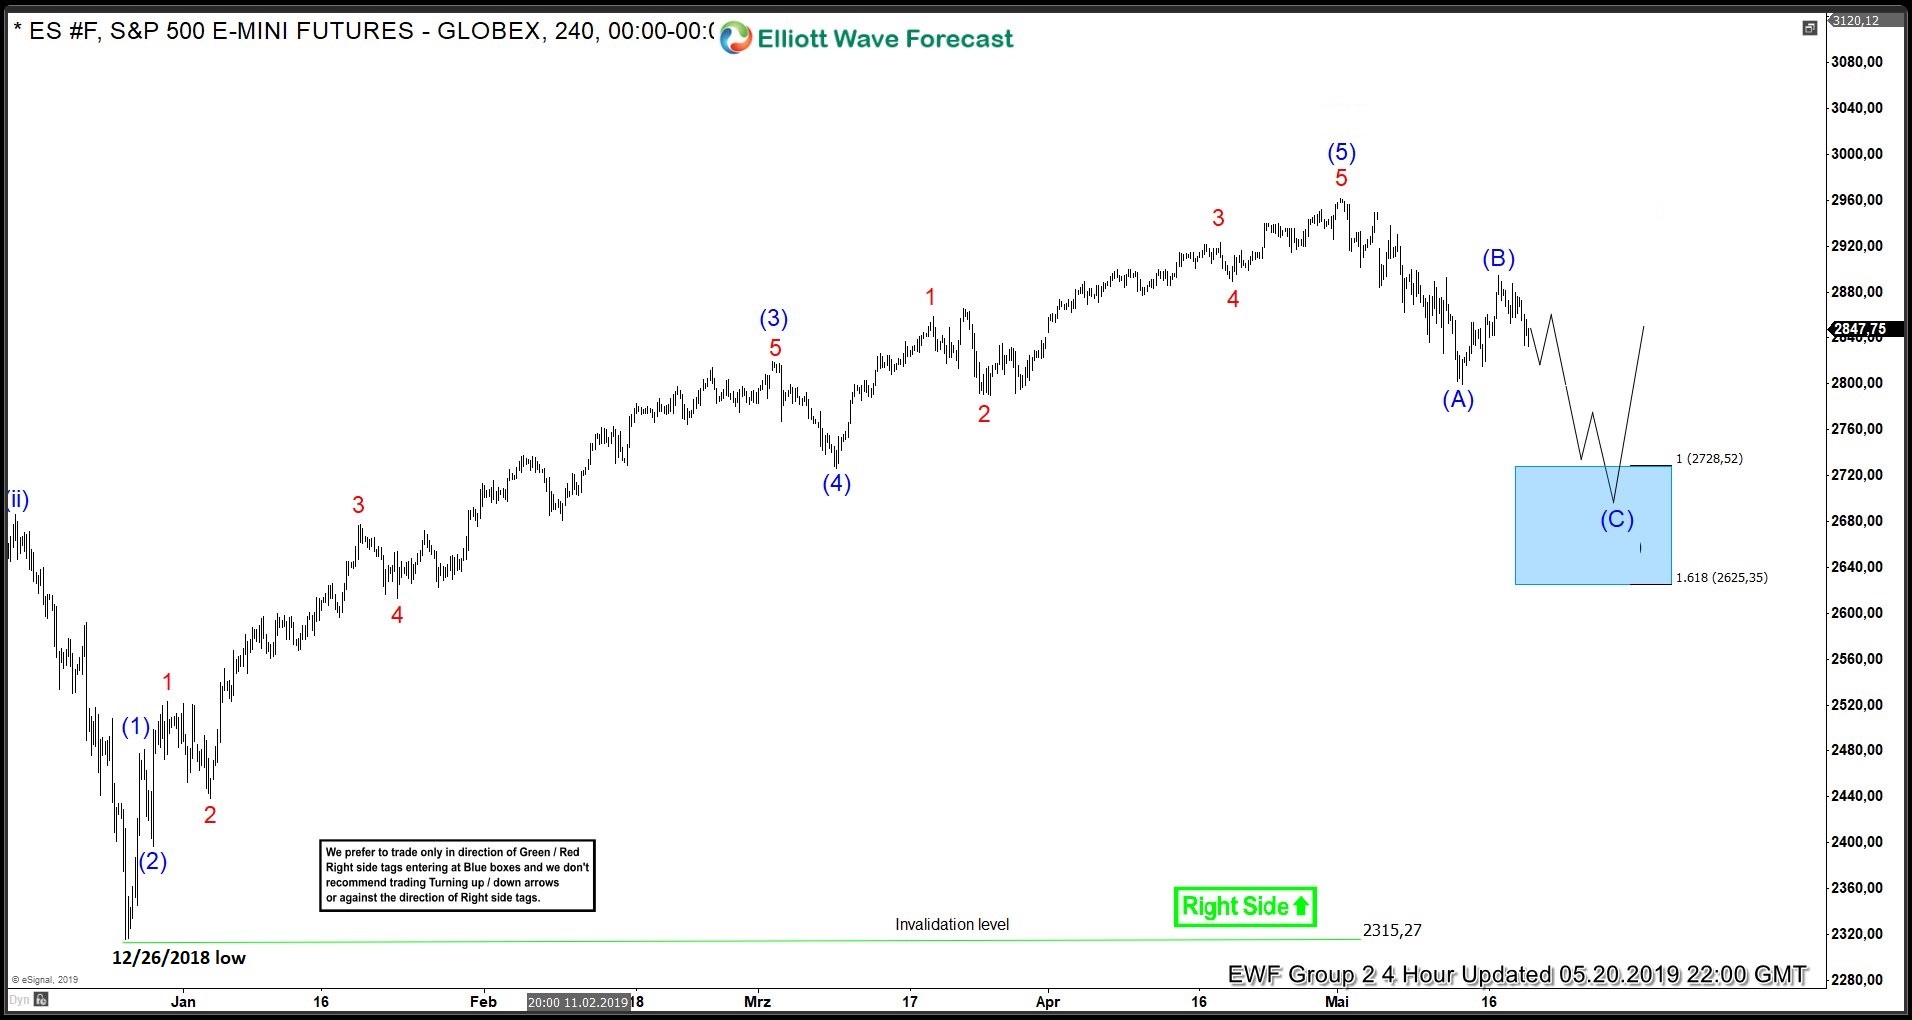
S&P 500 Futures (ES_F) Buying The Elliott Wave Dips
Read MoreIn this technical blog, we take a look at the past performance of 4 hour Elliott Wave charts of ES_F, in which our members took the advantage of blue boxes