
-
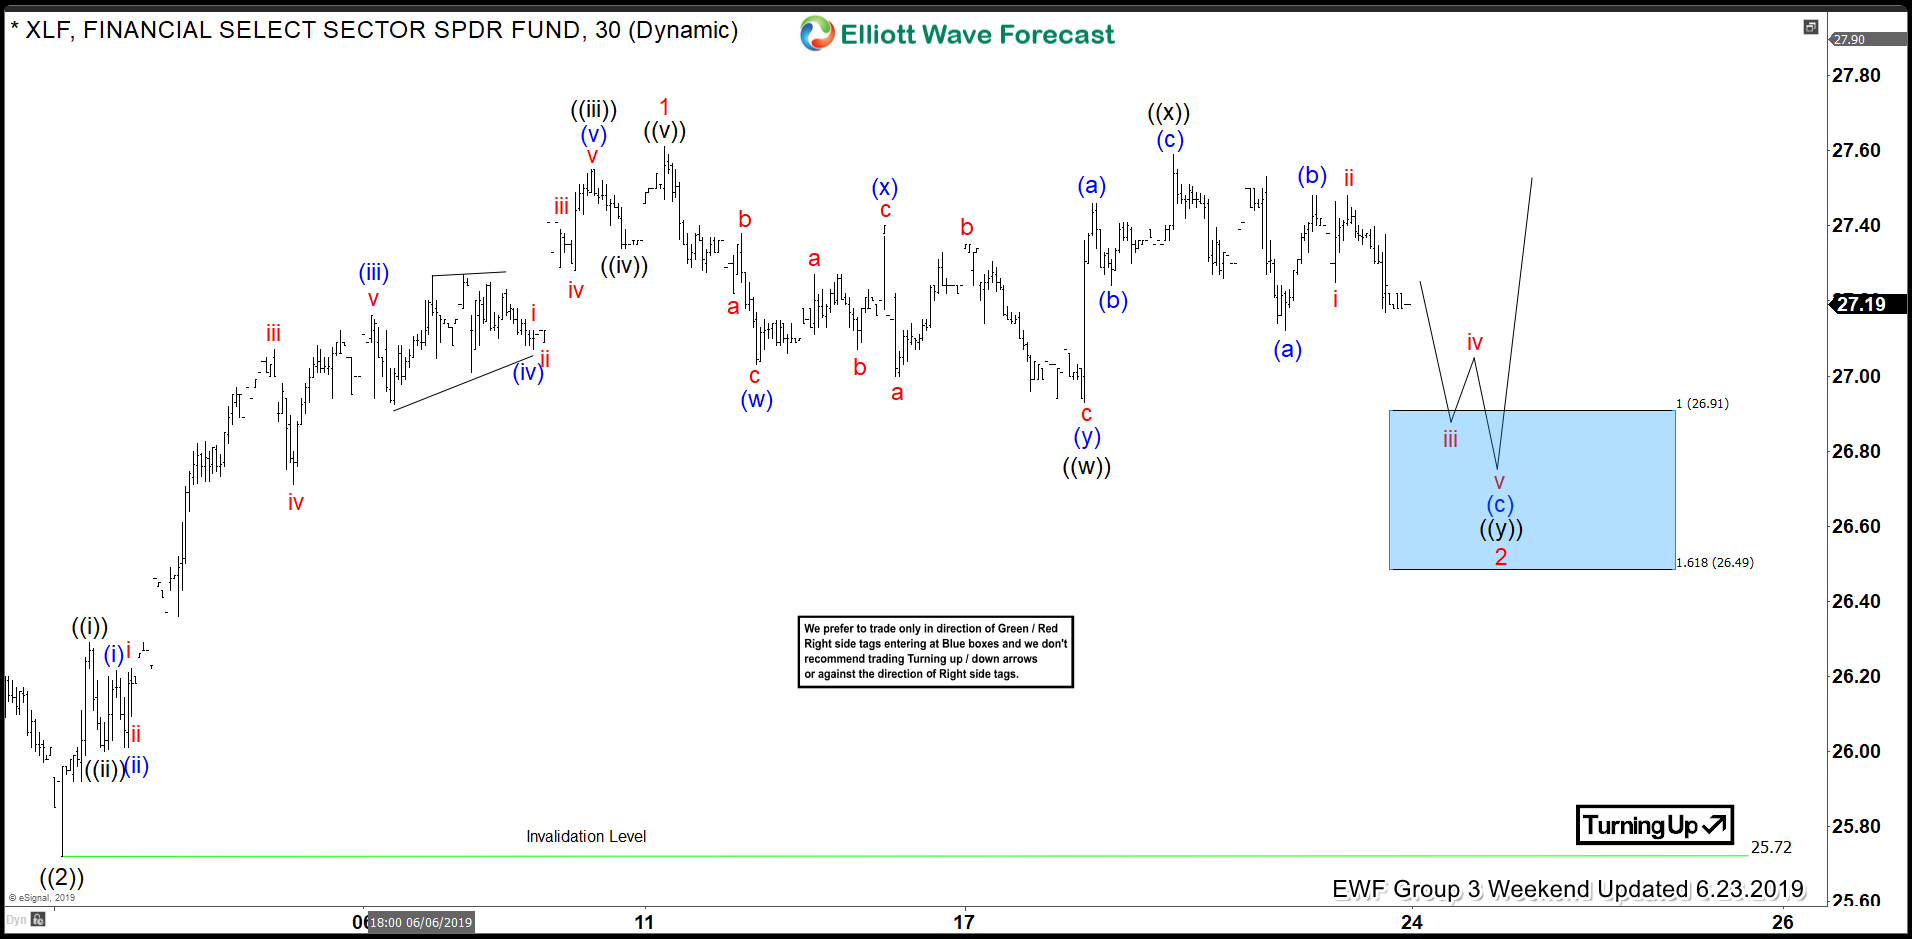
Elliott Wave Analysis: XLF Sector Rallying from Blue Box Target
Read MoreWelcome traders. In this technical analysis we will look at a couple of XLF sector charts. This will show you how profitable and efficient it can be to trade with our philosophy and basic Elliott Wave application. We start on June 23rd with a 30-minute chart presented to our members. At the time, we maintain […]
-
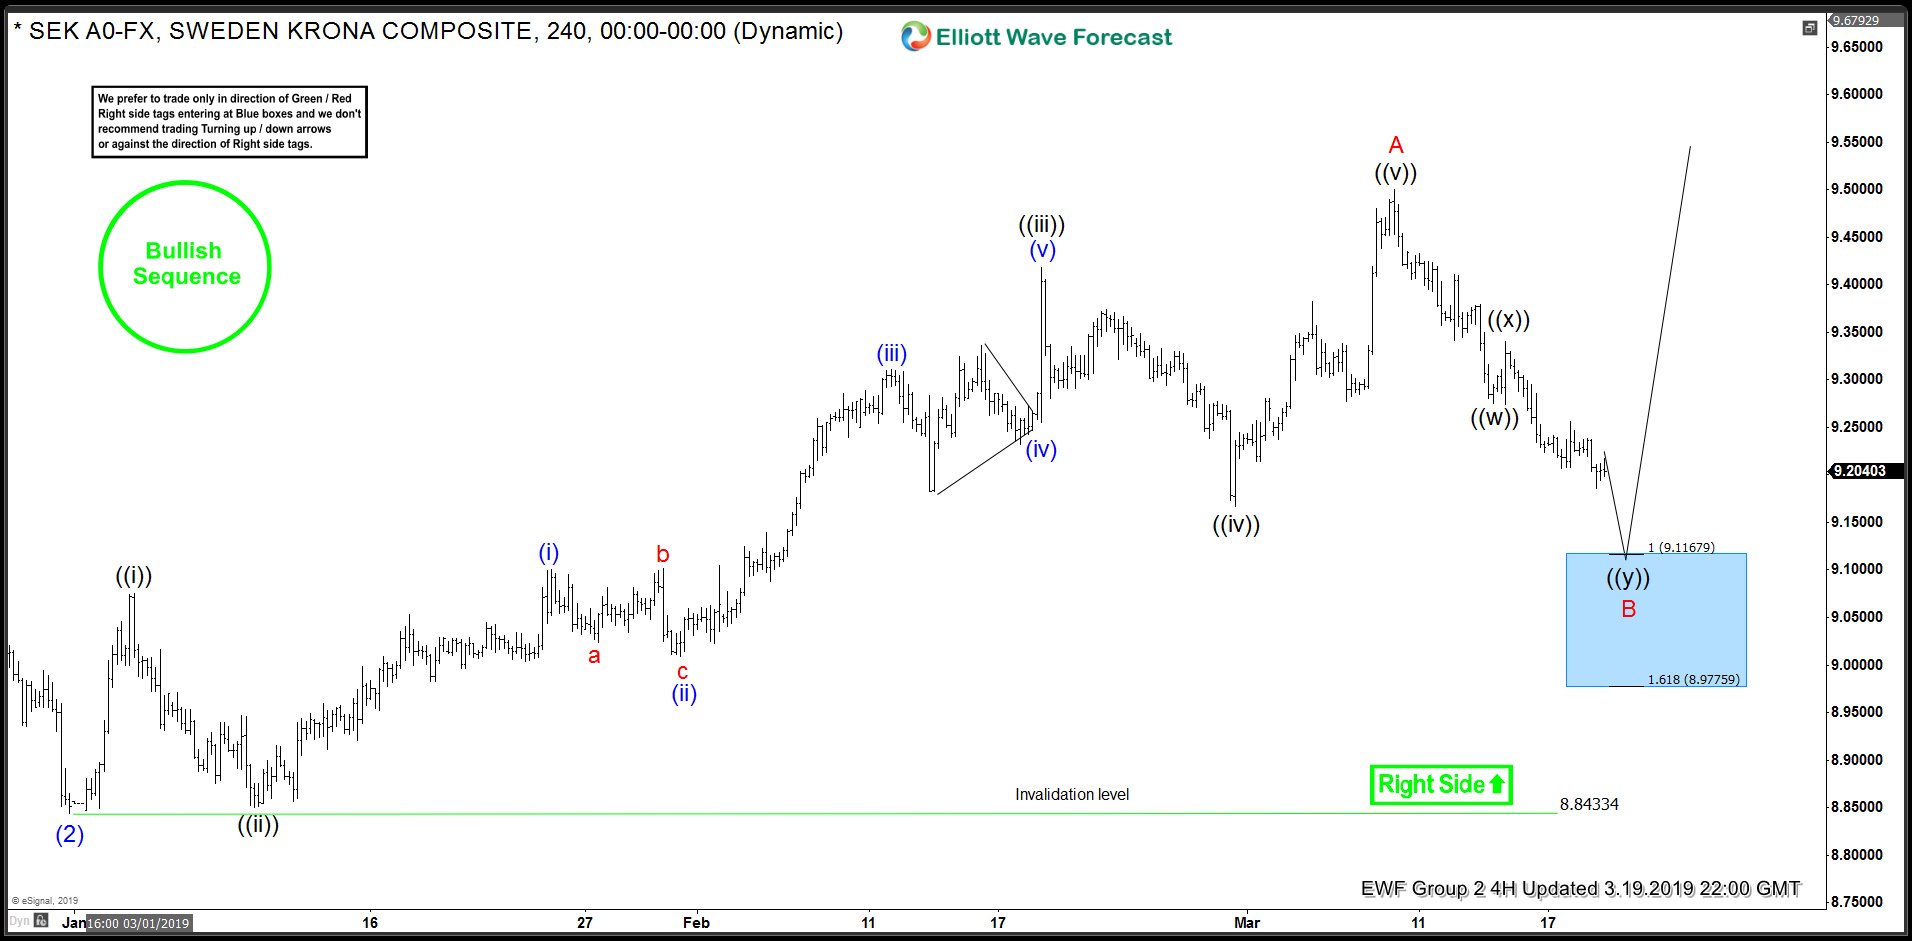
Elliott Wave Analysis: USDSEK Rally From Blue Box
Read MoreWelcome traders, today we will look at a couple of USDSEK pair charts.The following analysis will show how profitable and efficient it can be to trade with our philosophy and basic Elliott Wave analysis. First of all, we start on March 19 2019 with a 4-hr chart presented to our members. At the time, we maintained a […]
-
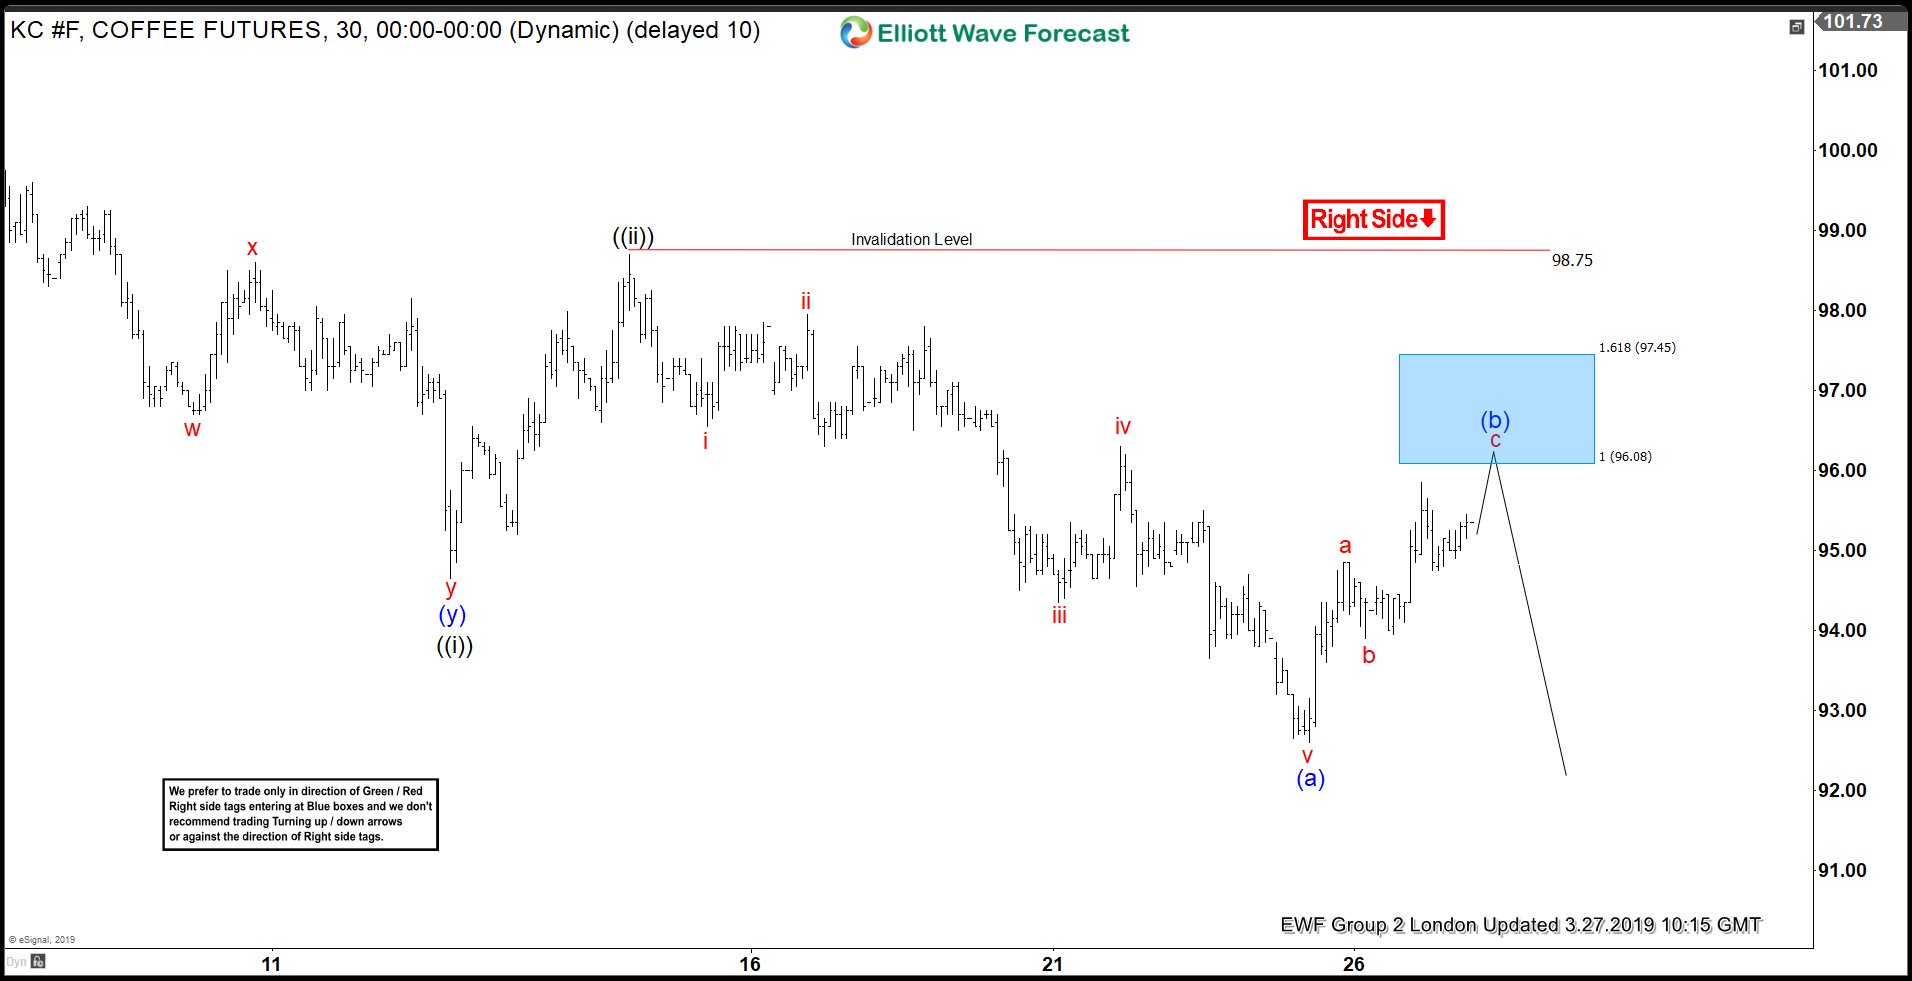
Elliott Wave Analysis: Selling Coffee Rally in Blue Box
Read MoreWelcome traders, today we look at a couple of 30-min Coffee futures (KC_F) charts and its price action within hours. The following analysis will show how profitable and efficient it can be to trade with our philosophy and basic Elliott Wave analysis. First of all, we start on March 27th with a 30-minute chart presented to […]
-
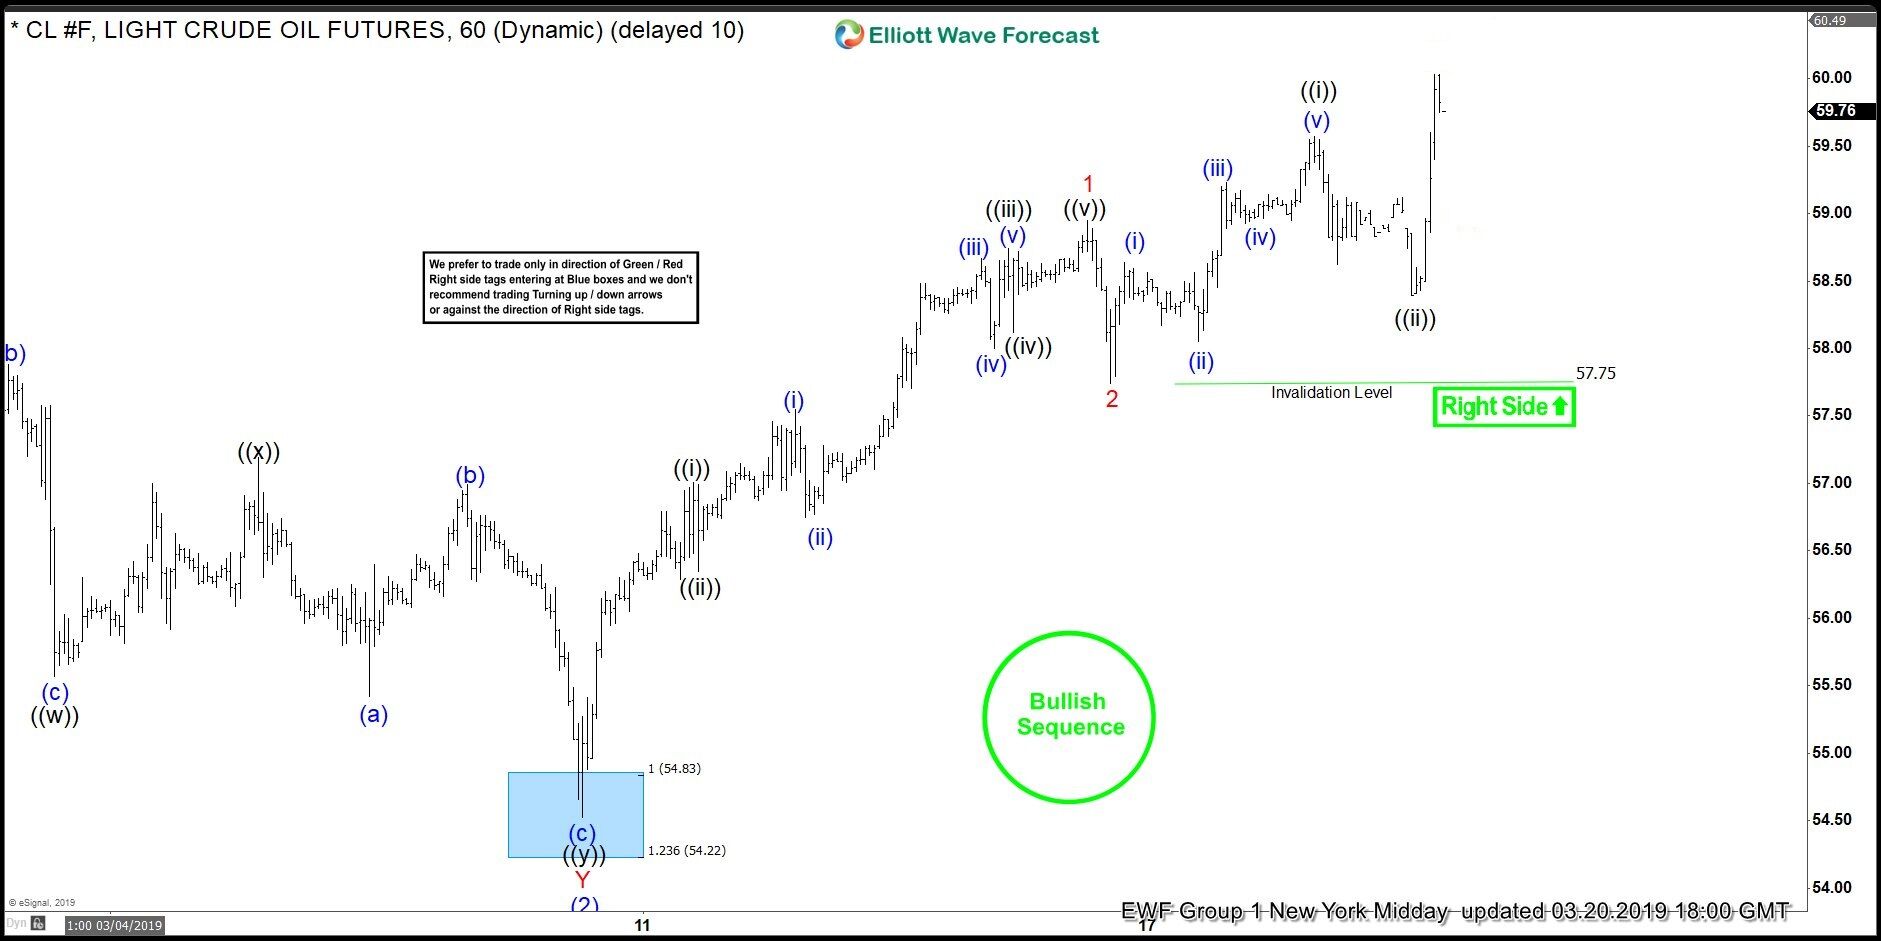
Elliott Wave Analysis: Bullish Sequence Pushing for Higher Prices in Oil
Read MoreWelcome traders, today we will look at a couple of Oil futures (CL_F) charts given to our members. The following short Elliott wave analysis will give you a brief understanding on how our bullish/bearish sequence stamps work and how we act on them. First of all, we start on March 18 where the right side of the markert favored […]
-

Elliott Wave Analysis: Wait for the Setup and Bet on Oil
Read MoreWelcome traders, today we will look at a couple of Oil futures (CL #F) charts. After reaching a short term top, patience leads us to a trading opportunity. See how profitable and efficient it can be to trade with basic Elliott Wave analysis and our defined blue box target areas. First of all, we start […]
-
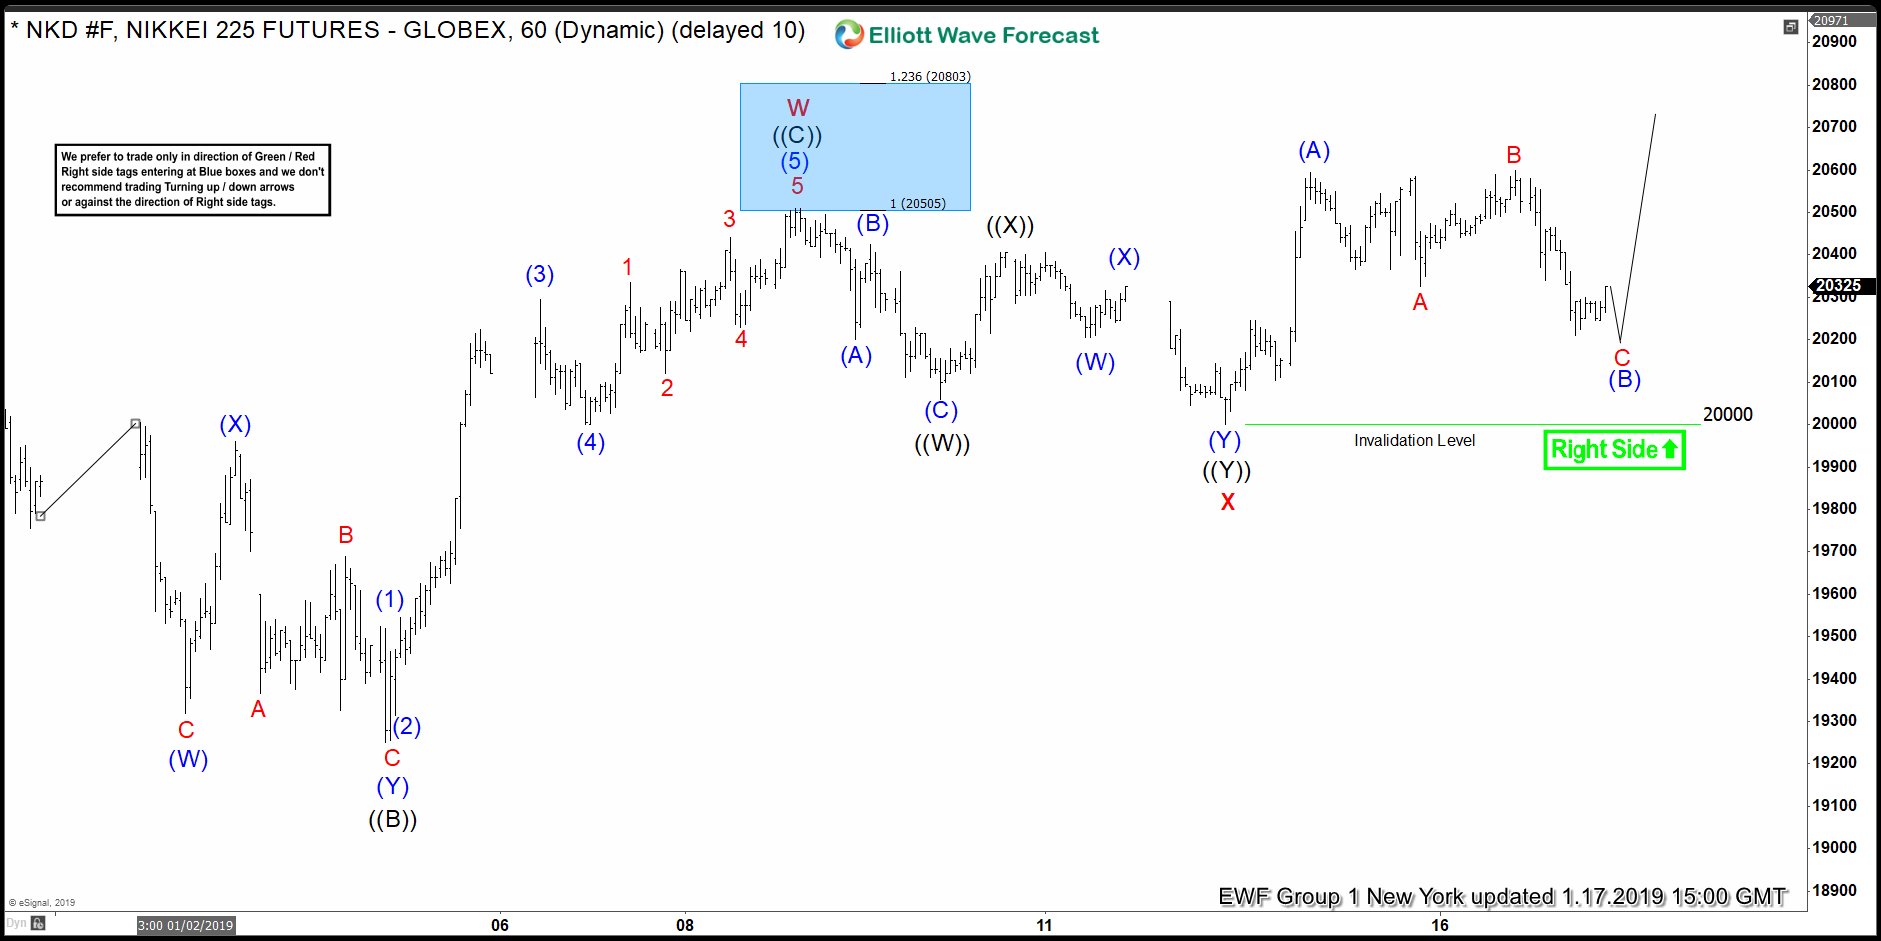
Elliott Wave Analysis: NIKKEI Rallies With The Right Side
Read MoreWelcome traders, today we look at a couple of 1 hour NIKKEI charts and its price action within 3 consecutive days. The following analysis will show how profitable and efficient it can be to trade with our philosophy and basic Elliott Wave analysis. First of all, we start on January 14 where the right side of […]