
-
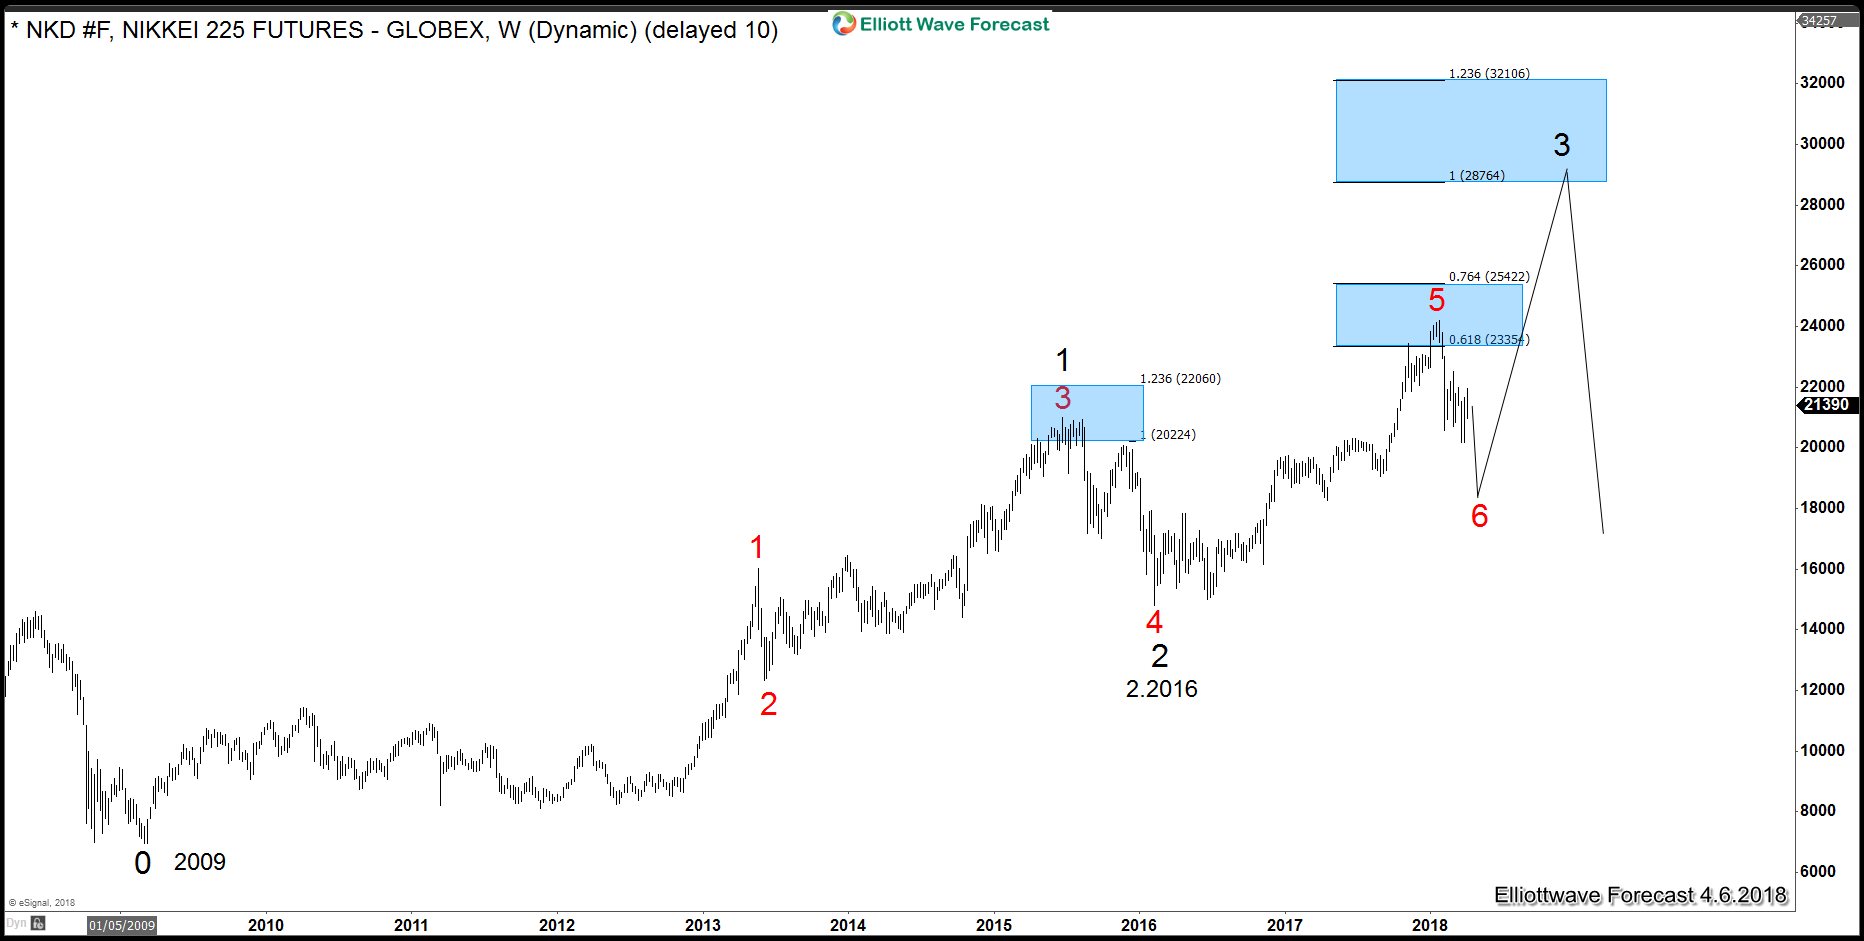
Indices Larger pullback from the Highs is Purely Technical
Read MoreThe Indices larger pullback from the highs is purely technical despite whatever fundamental or reason the news suggests. I will show the technical reasoning in this article. We will look at the Nikkei, FTSE, as well as the Hang Seng indices cycles up from the 2009 and 2008 lows. Each of these indices are shown […]
-
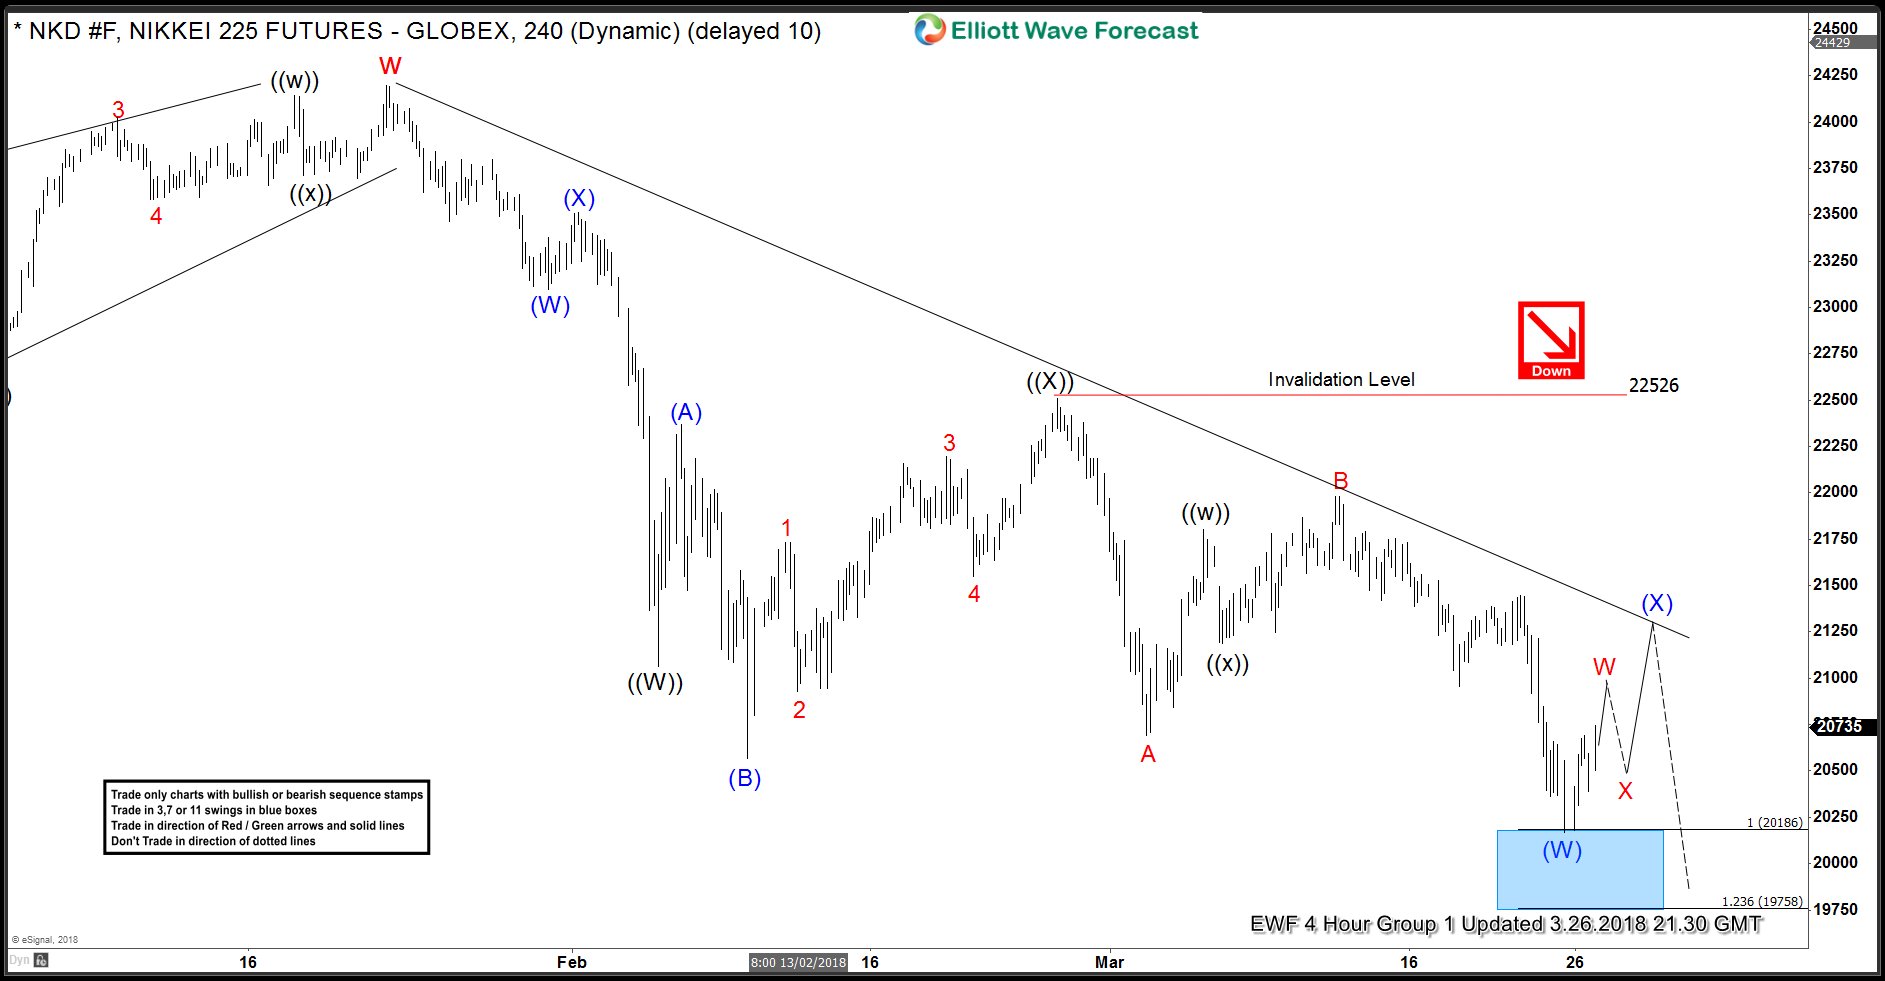
$NKD_F Nikkei Correcting Cycle Up from 2/12/2016
Read More$NKD_F Nikkei Correcting Cycle Up from 2/12/2016 The Nikkei Index has a bullish daily sequence and trend however it currently is correcting the cycle up from the 2/12/2016 lows in 3, 7 or 11 swings. For now and due to other correlated markets structures we will presume this will be a 7 swing declining pullback. […]
-
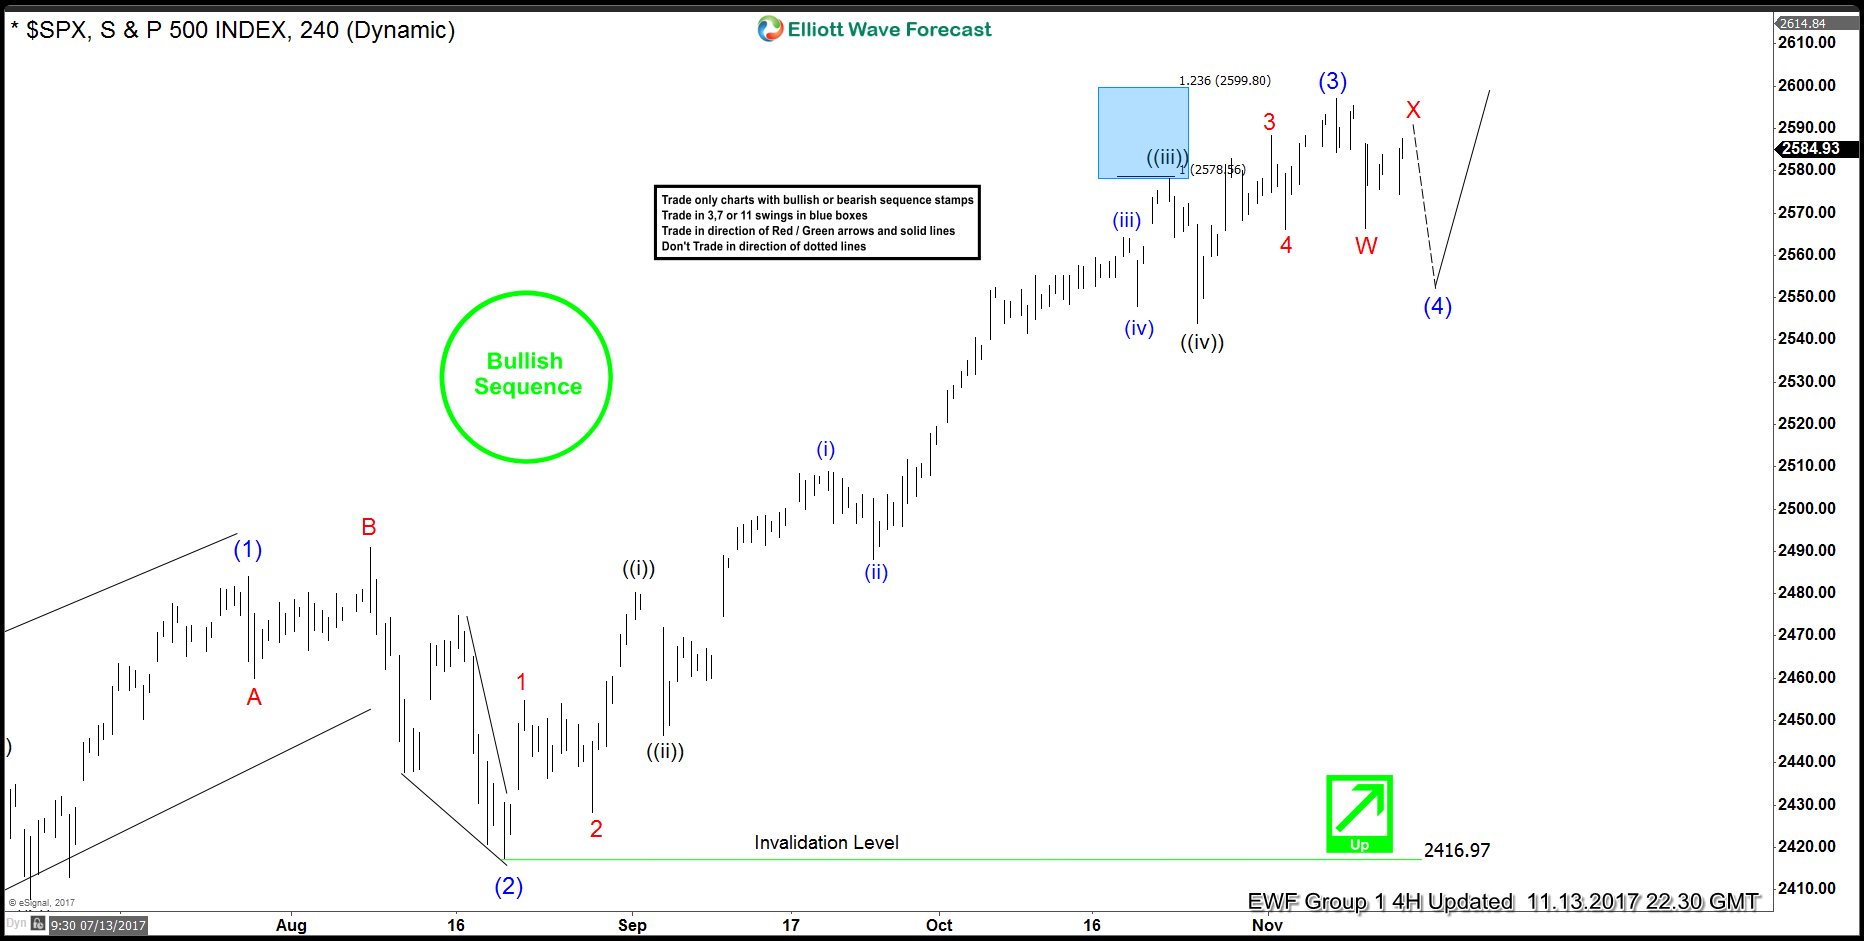
$SPX Bounce from the 8/21 lows is Impulsive
Read More$SPX Bounce from the 8/21 lows is Impulsive The $SPX Bounce from the 8/21 lows is impulsive and does display the usual characteristic traits of an Elliott Wave impulse. Looking back previously before this 8/21 date, the stock index is within an obvious uptrend in multiple degrees. In this we are mainly focused upon this particular time frame […]
-
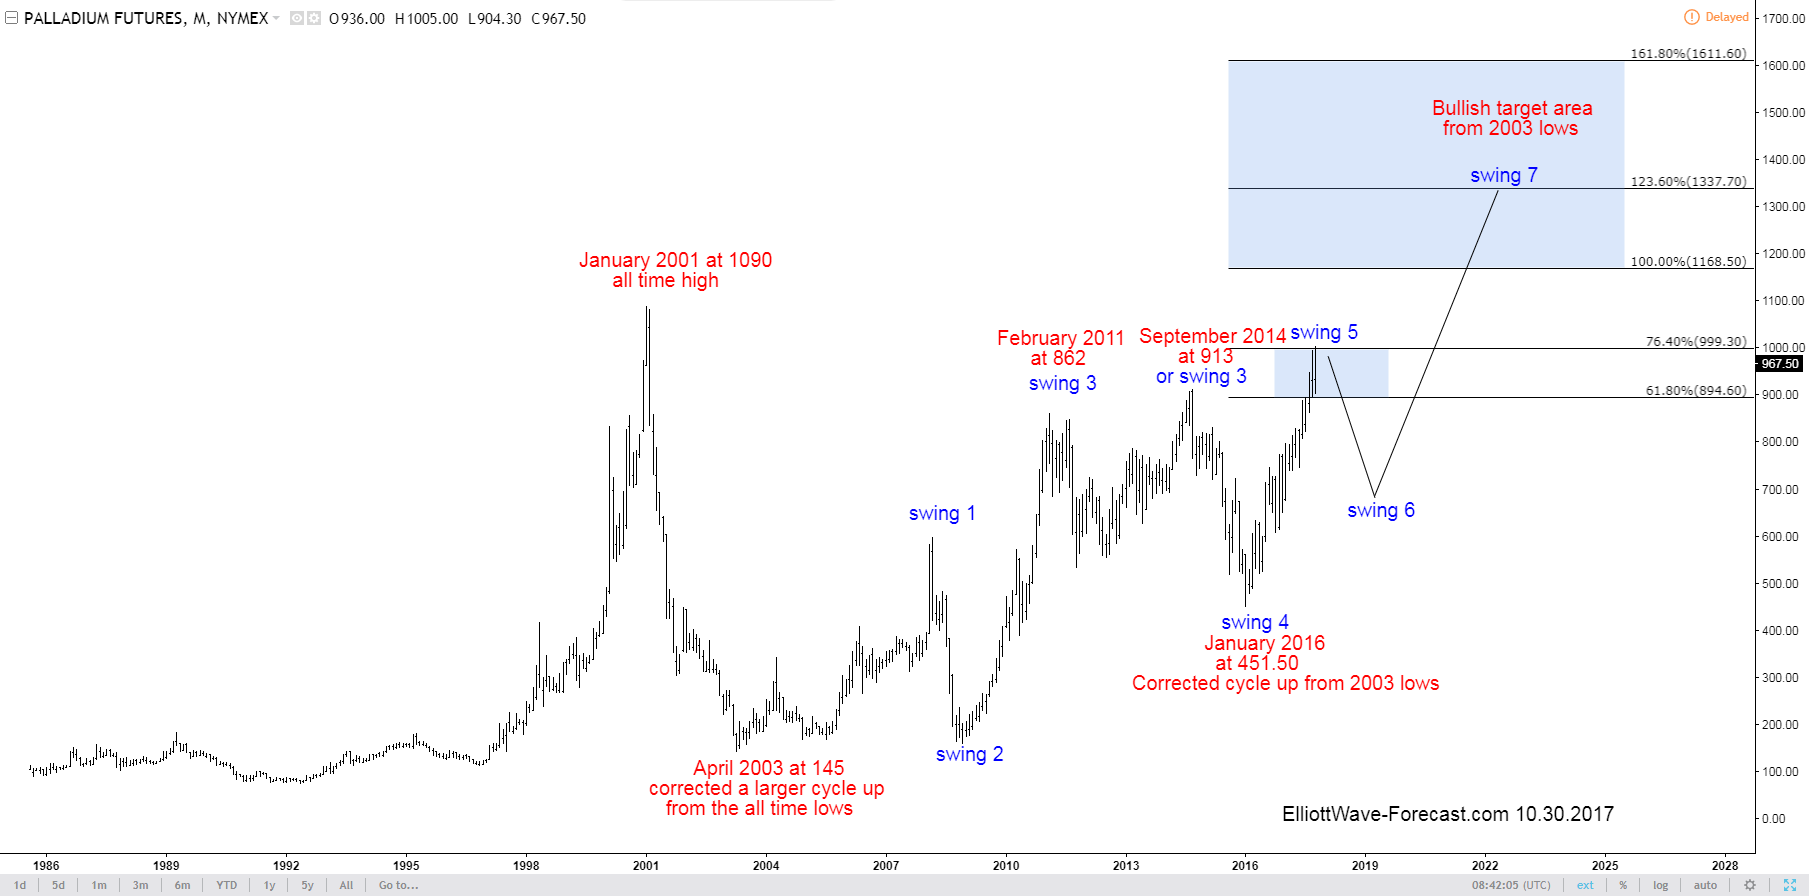
$PA_F Palladium Weekly Bullish Swing Sequence
Read MoreThe $PA_F Palladium Weekly Bullish Swing Sequence Palladium is a bullish commodity. Firstly I’ll mention the attached Palladium chart below is only a swing sequence labeled chart. This is from the monthly time frame. The data goes back to the 1980’s. It should not be relevant of as what the structure of the wave and cycle up […]
-
Long-Term View of World Indices 10/25/2017
Read MoreLong-Term View of World Indices 10/25/2017 Long-Term View World Indices 10/25/2017 Elliott Wave Long-Term. Firstly the long-term view on the world indices is expected to remain bullish. Secondly some of them have already reached the extreme areas from all-time lows like the SPX. Thirdly a few indices are still showing a bullish sequence and shy of […]
-
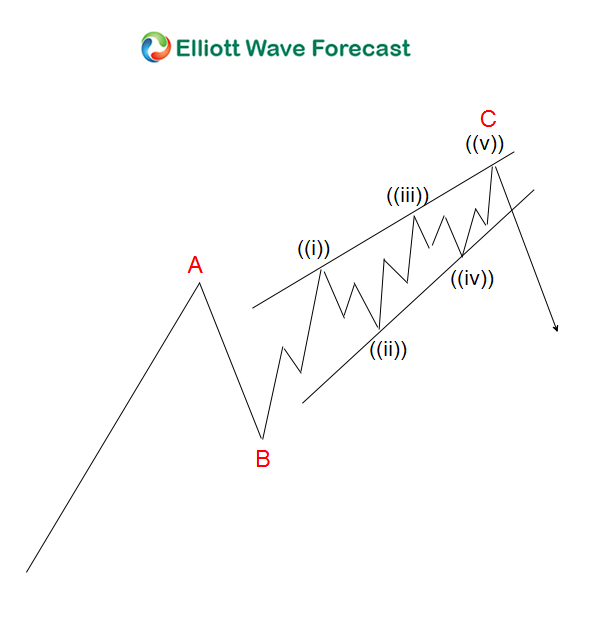
Elliott Wave Theory Structure; An Ending Diagonal
Read MoreWhat is an Ending Diagonal in Elliott Wave Analysis? An ending diagonal is a type of impulsive motive wave in Elliott Wave Theory that occurs in the fifth wave’s subdivision or within an entire C wave structure. An ending diagonal C wave or 5th wave commonly shows an obvious wedge shape with an overlapping wave […]