
-
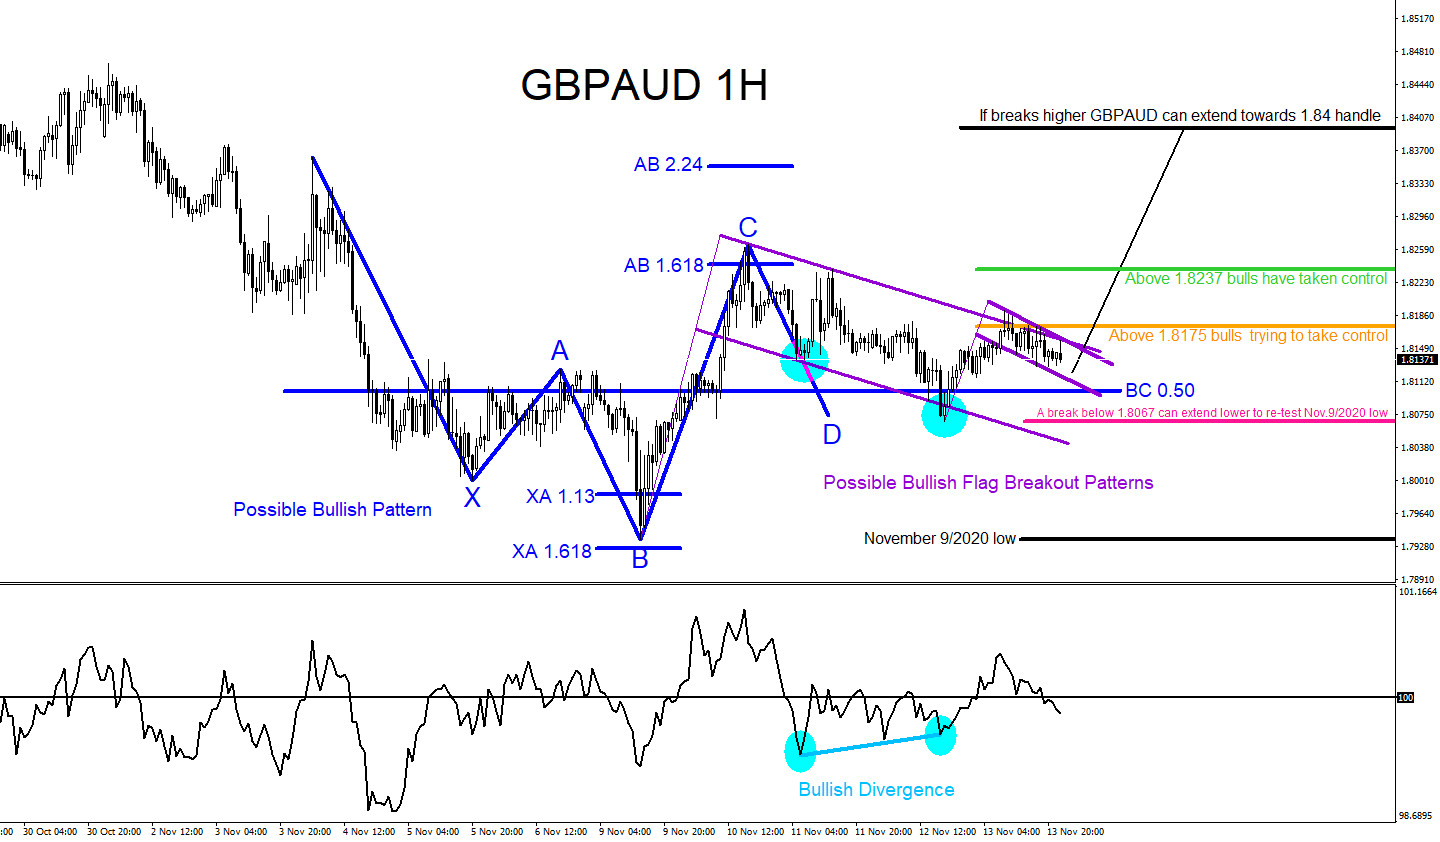
GBPAUD : Will the Pair Move Higher?
Read MoreThere are visible bullish patterns on the GBPAUD 1 Hour time frame that can be signalling traders of a possible move higher. The blue bullish market pattern already triggered buyers at the BC 0.50% Fib. retracement level and the pair reacted with a small push higher from this level. At the moment more confirmation of […]
-
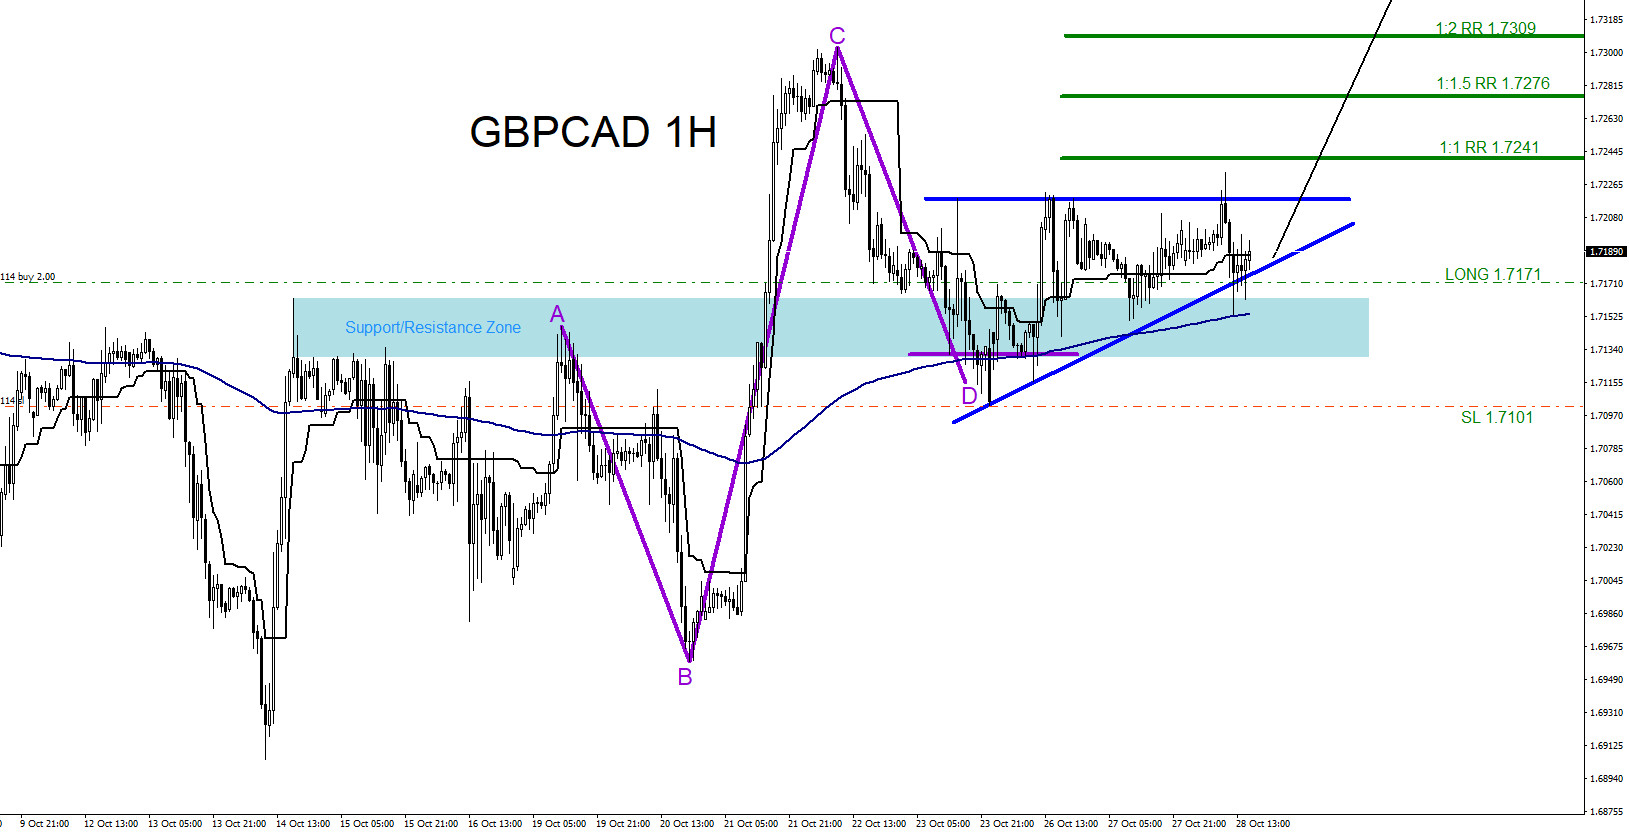
GBPCAD : Market Patterns Calling the Move Higher
Read MoreOn October 27 2020 I posted on social media Stocktwits/Twitter @AidanFX “GBPCAD Watch for a move higher. Will be watching for possible buying opportunities.” The chart below shows bullish market patterns were visible and were calling for a move higher. Bullish Pattern (purple) triggered BUYERS at the BC 0.50% Fib. retracement level where the point D of […]
-
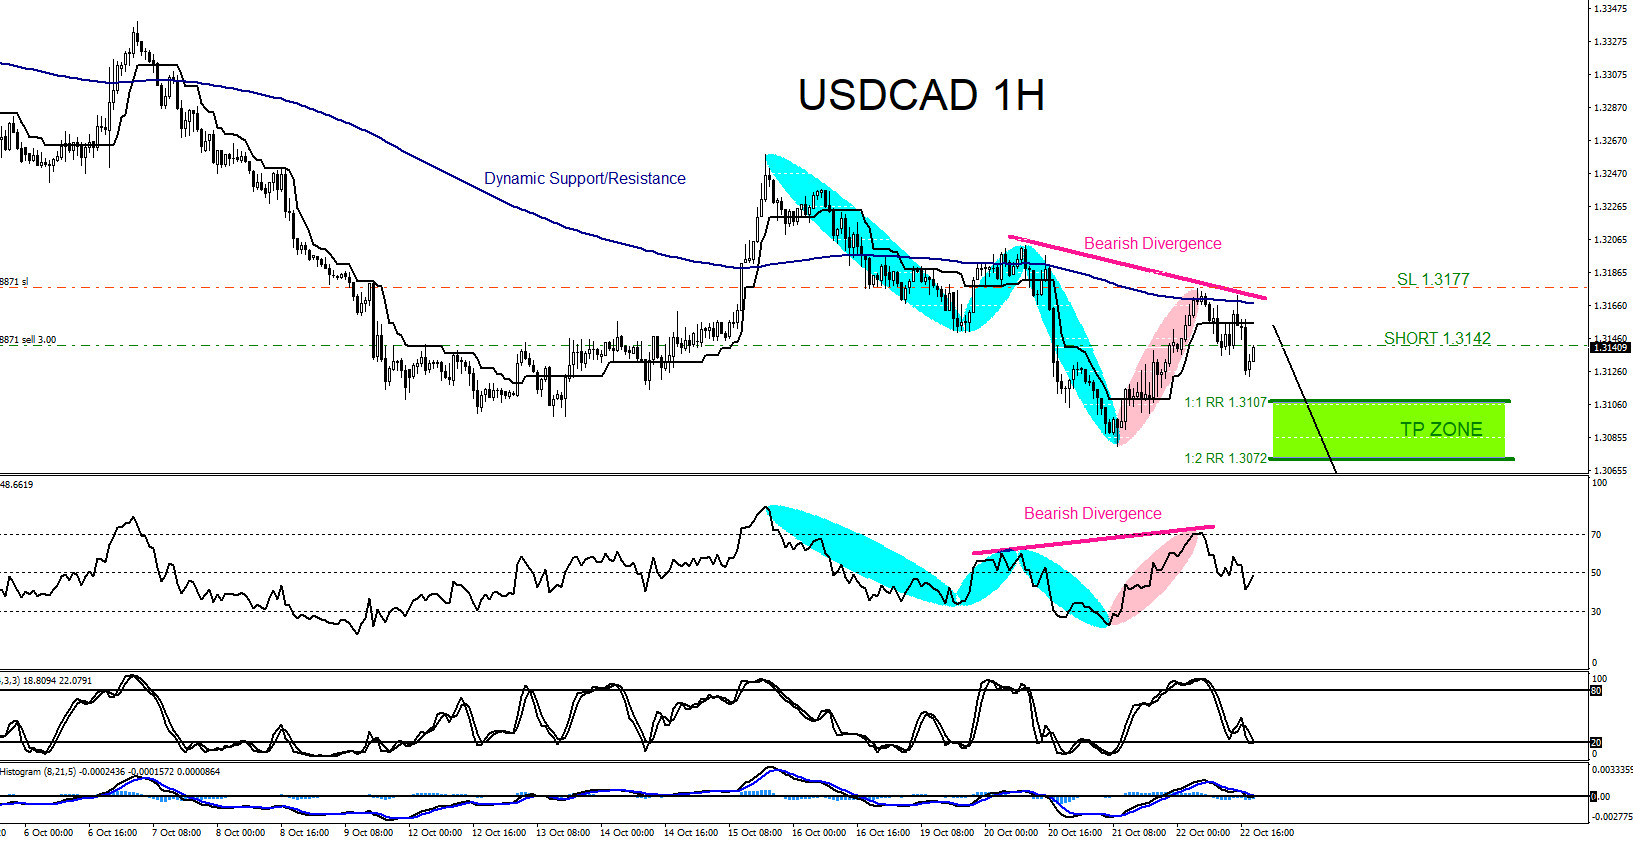
USDCAD : Will the Pair Extend Lower?
Read MoreOn October 22 2020 I posted on social media Stocktwits/Twitter @AidanFX “USDCAD Sold/Short at 1.3142 Stop Loss 1.3177 Target 1.3107-1.3072 area.” The chart below of the USDCAD pair shows a bearish Lower Low/Lower High sequence (light blue) signalling the pair is in a down trend. A bearish divergence pattern (pink) formed when price chart registered a […]
-
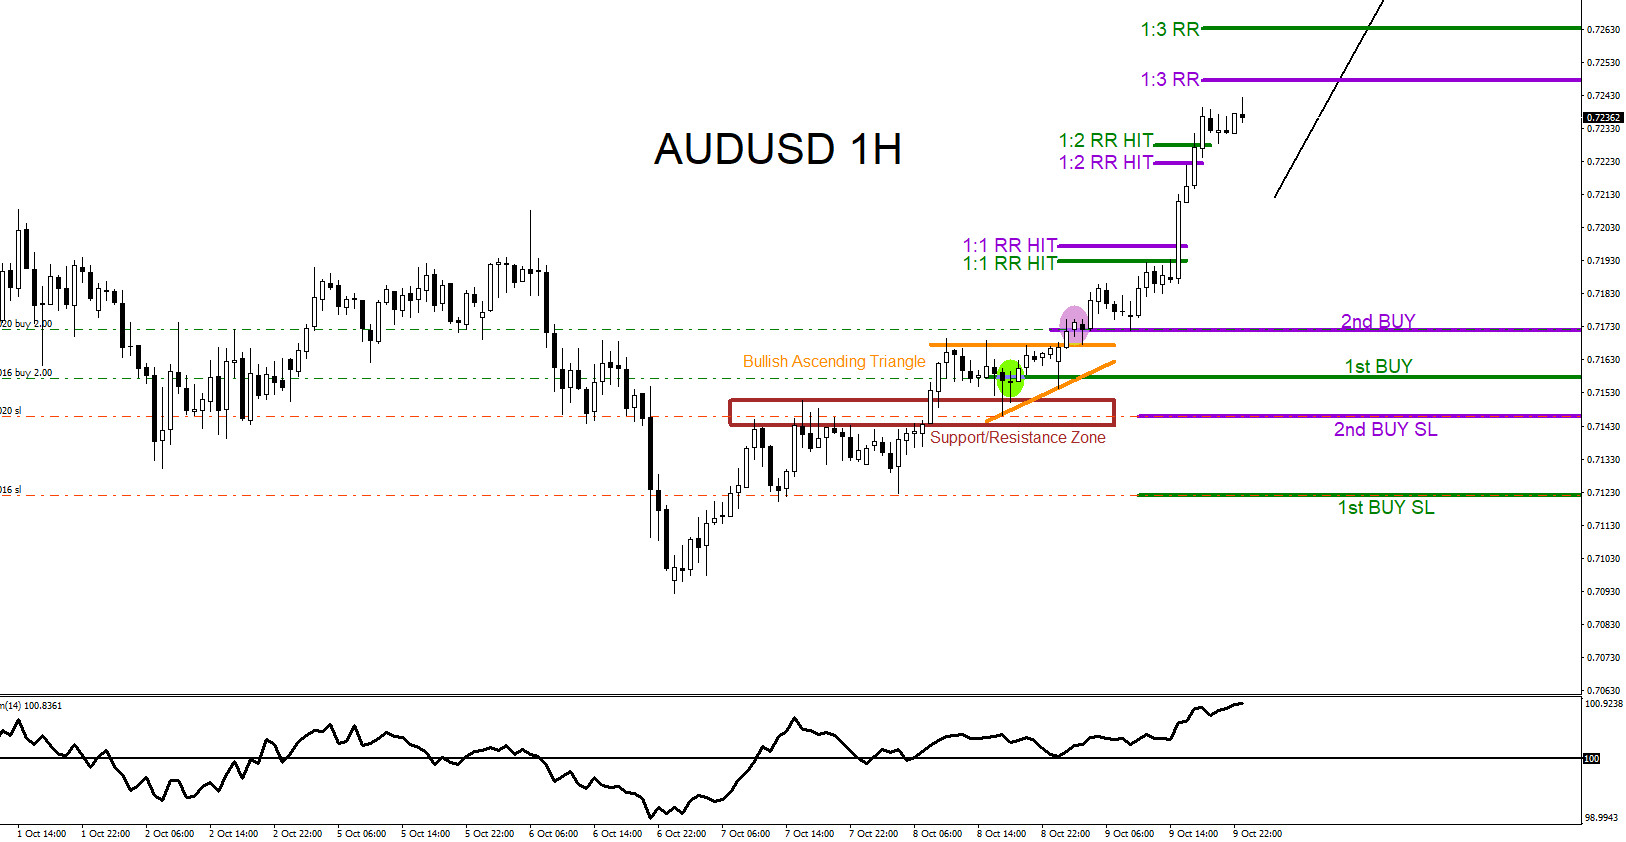
AUDUSD : Trading the Impulse Elliott Wave Three
Read MoreEvery trader that uses the Elliott Wave theory as part of their trading analysis knows that the strongest and longest of a impulse wave pattern is the wave 3. On October 8/2020 we at EWF advised our clients, in our members only area, that the AUDUSD pair was forming this impulse wave pattern. The chart […]
-
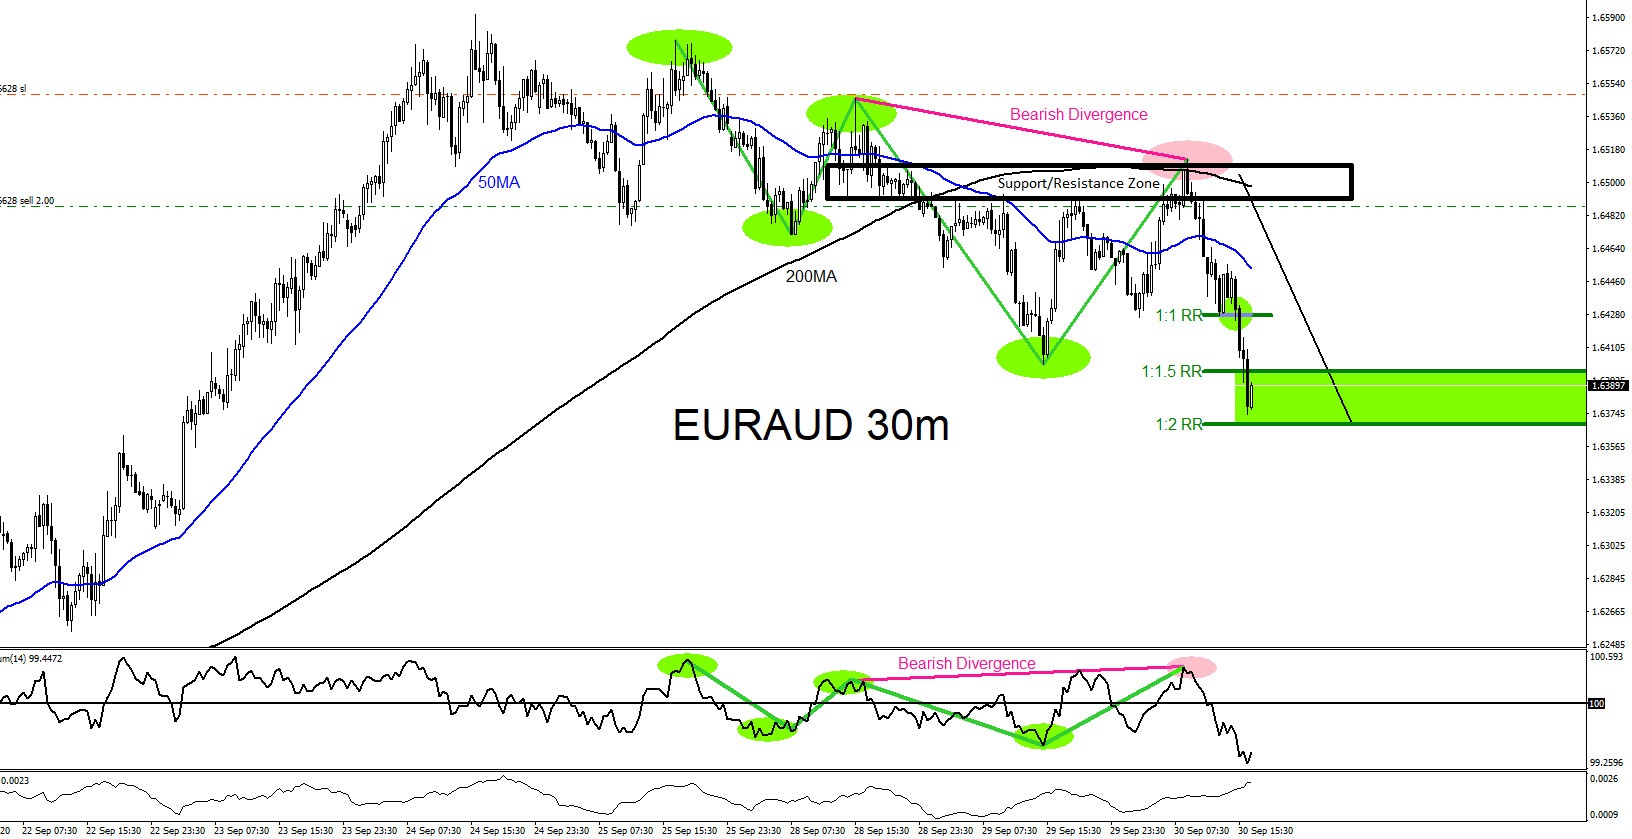
EURAUD : Trading the Move Lower
Read MoreThe chart below of the EURAUD pair shows clear and visible bearish signals where the pair would find SELLERS and allow a trader to get in the market. A trader should always have a minimum of 3 reasons to enter a trade. In the case of EURAUD below, first reason was that there was visible […]
-
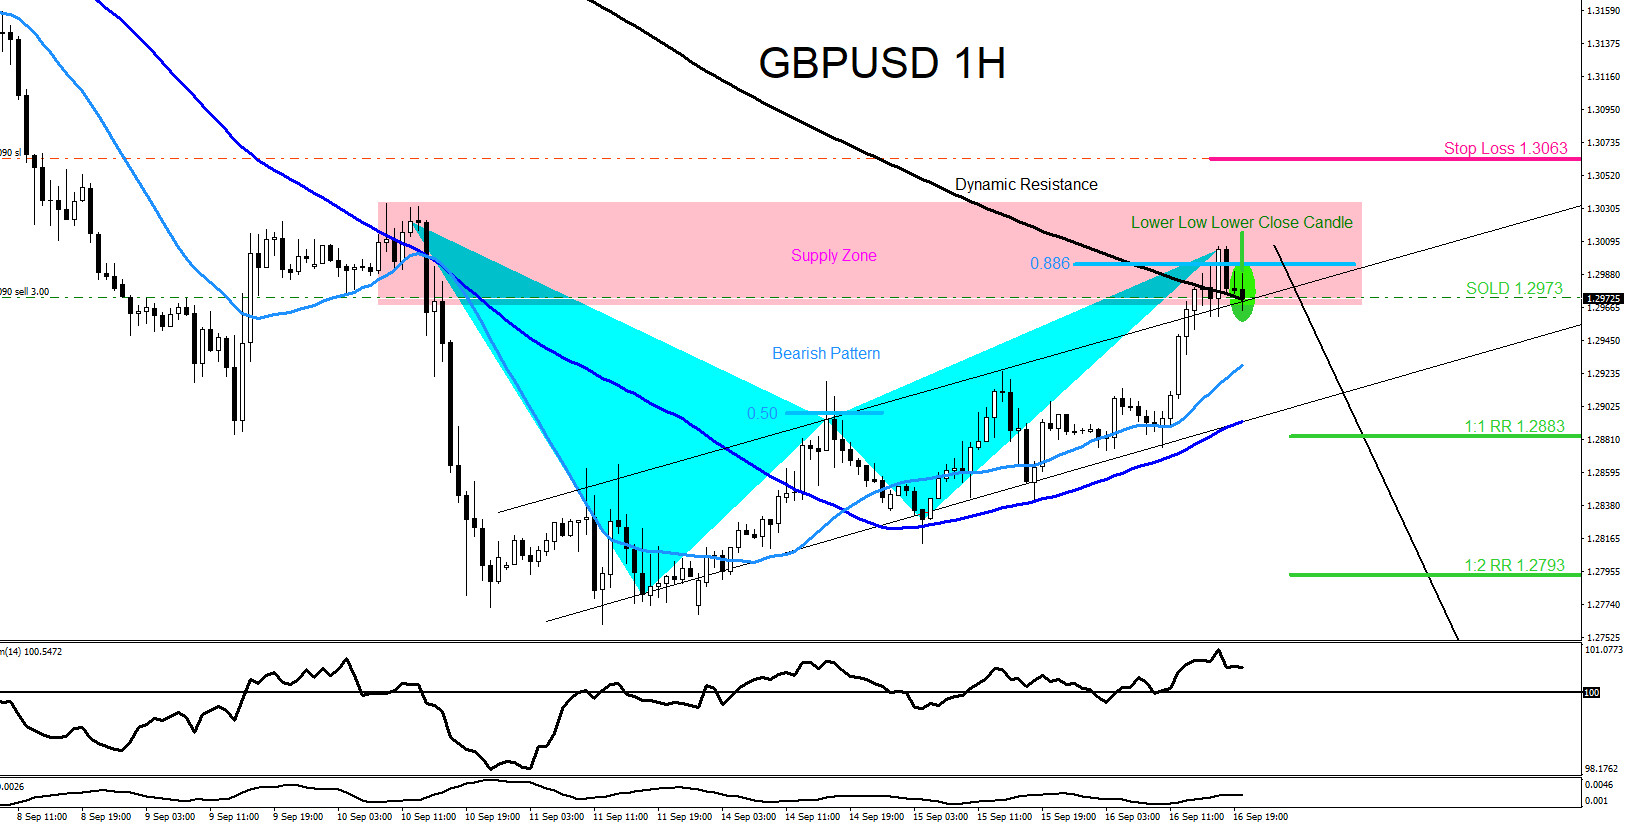
GBPUSD : Visible Bearish Market Pattern Hitting a Resistance Zone
Read MoreOn September 16 2020 I posted on social media Stocktwits/Twitter @AidanFX “GBPUSD Watch for selling opportunities as long price stays below 1.3060.” The chart below of the GBPUSD pair was also posted on social media StockTwits/Twitter @AidanFX September 16 2020 showing that a bearish market pattern (light blue) formed and triggered SELLS at the 0.886% Fib. […]