
-
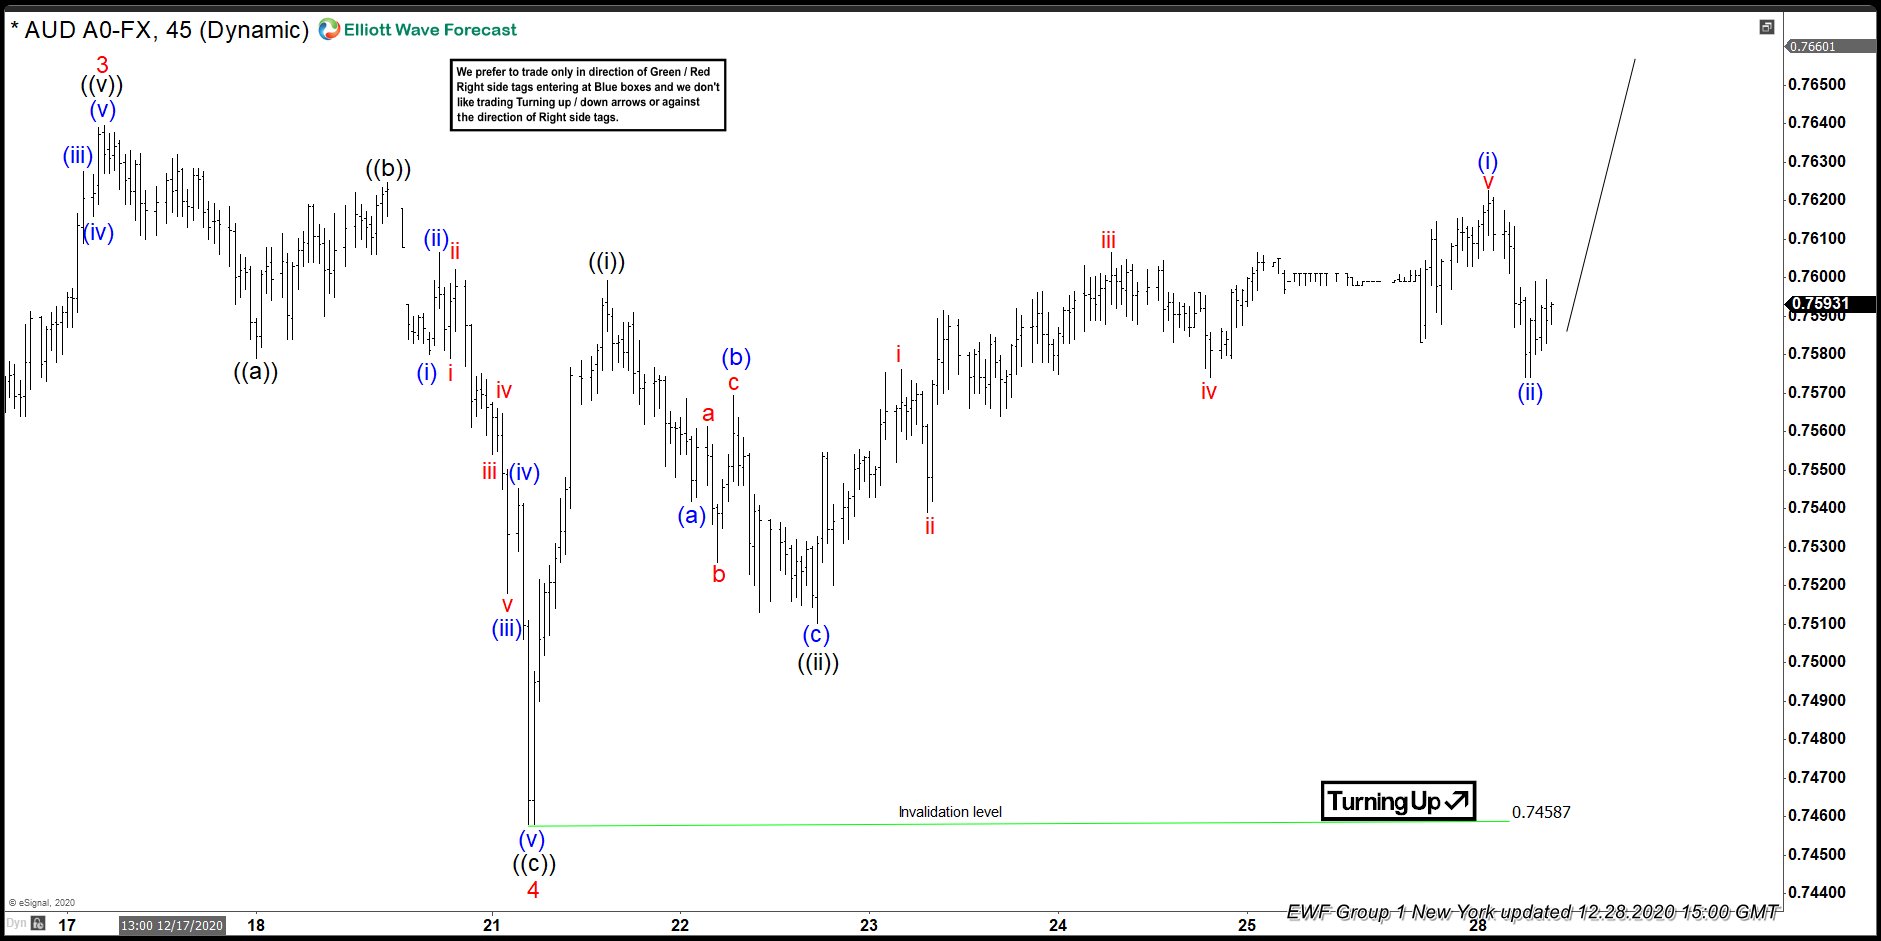
AUDUSD : Trading with the Bullish Trend
Read MoreSince March of 2020 AUDUSD has been been moving and trending higher. A bullish trend is clearly visible and we at EWF always encourage our members to trade with the trend and not against it. On December 28 2020 we advised traders, in our members area, that AUDUSD was still in a bullish cycle and […]
-
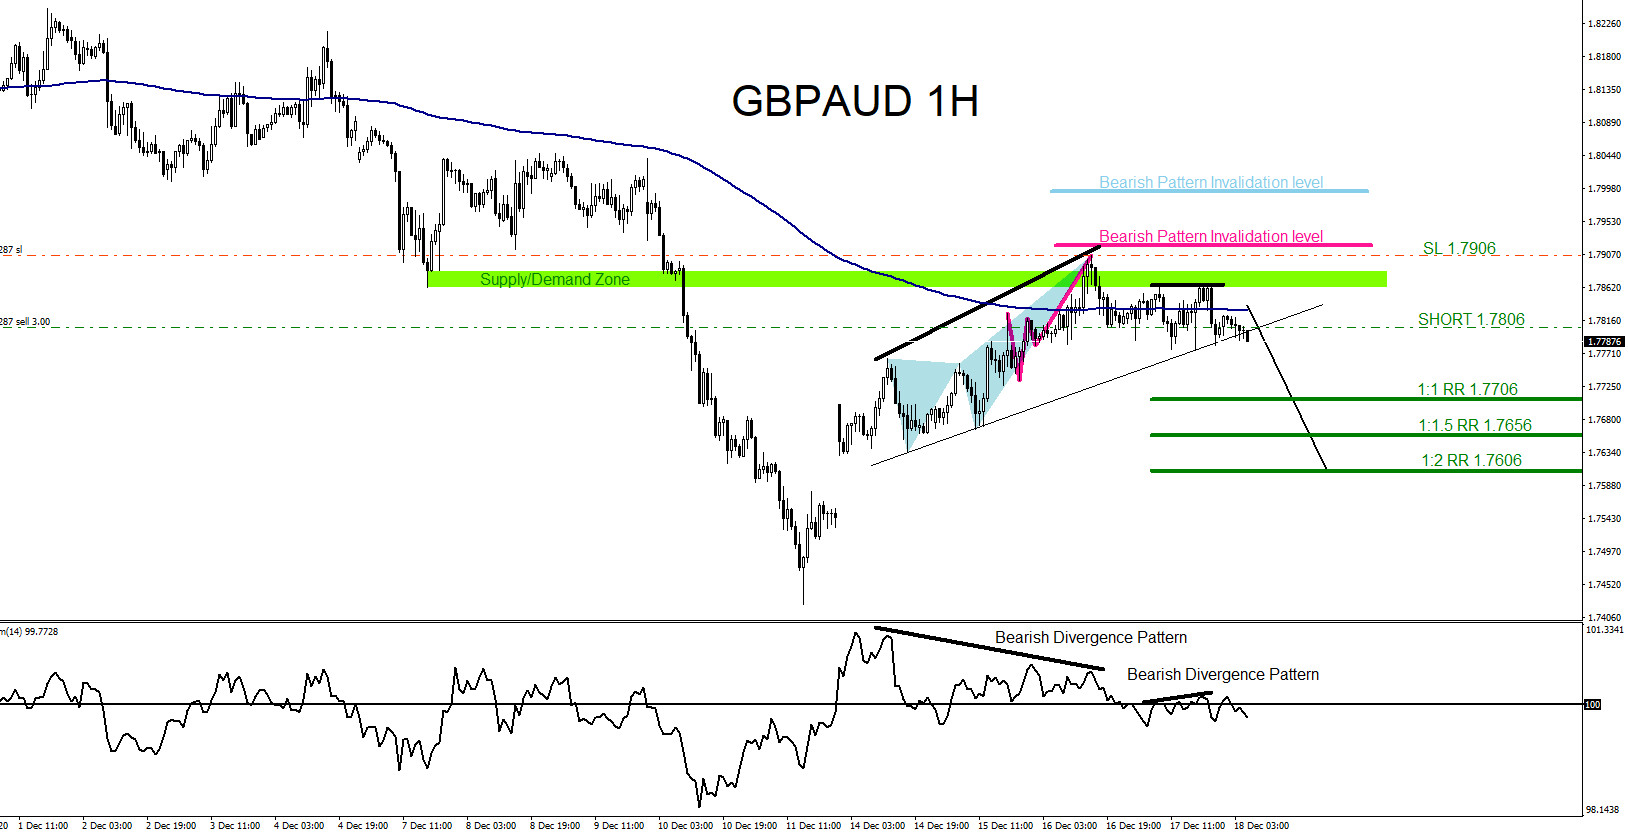
GBPAUD : Catching the Move Lower
Read MoreOn December 17 2020 I posted on social media @AidanFX “GBPAUD watch for a possible move lower. Will be watching for selling opportunities for a move lower towards 1.77 handle. GBPAUD break below 1.7770 can push the pair lower towards 1.77 handle. Watch for possible selling opportunities.” The chart below was also posted on social […]
-
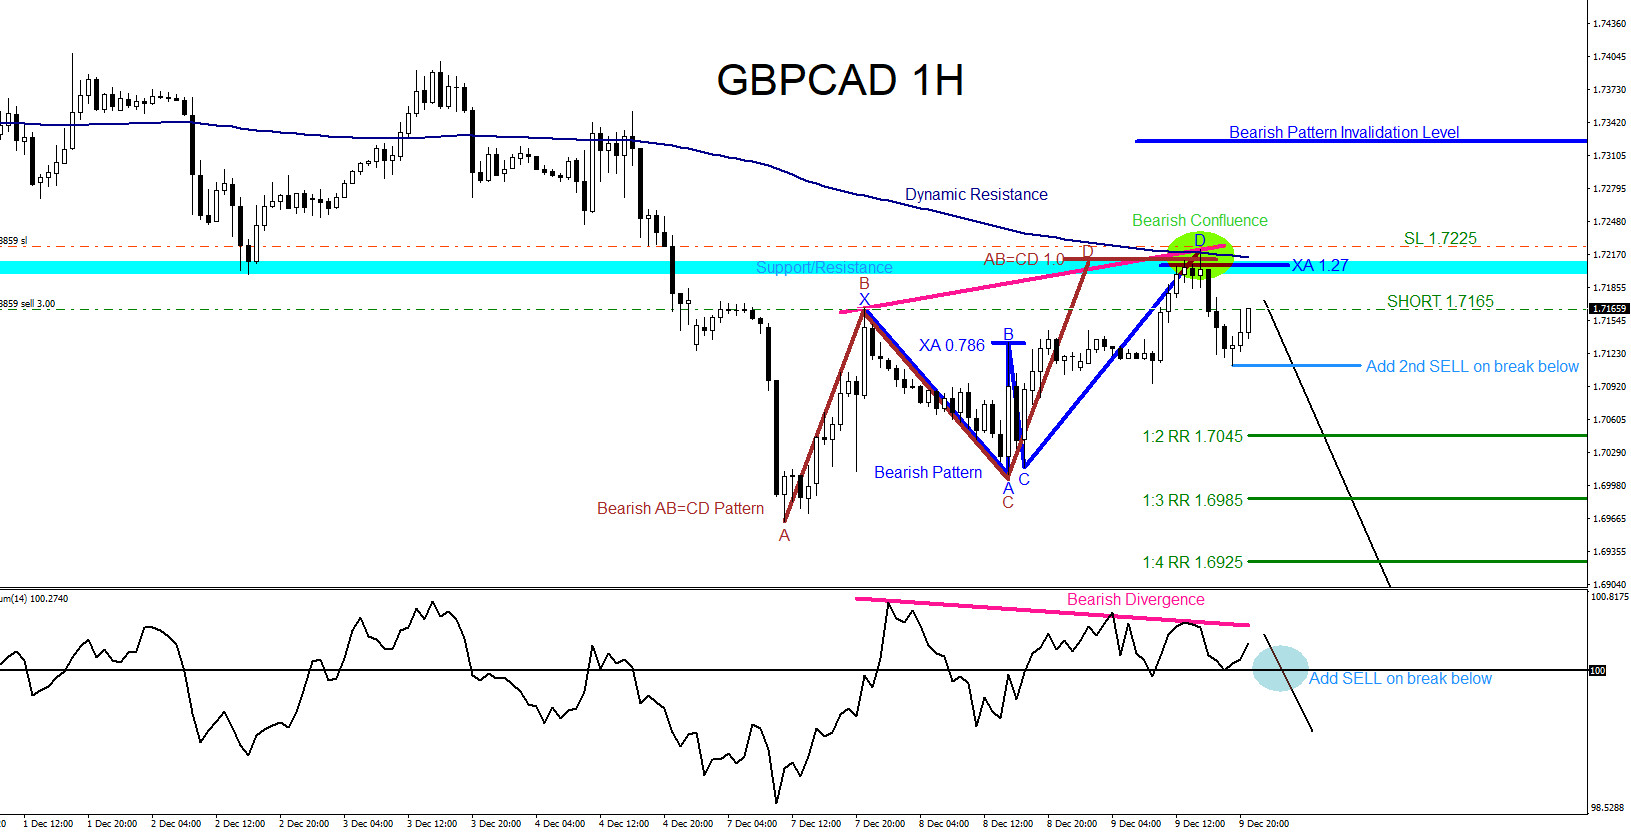
GBPCAD : Bearish Patterns Signalling the Move Lower
Read MoreOn December 9 2020 I posted on social media @AidanFX “GBPCAD watch for selling opportunities.” The charts below were also posted on social media @AidanFX December 9 2020 showing the possible bearish patterns. Blue bearish pattern triggered SELLS at the XA 1.27% Fib. retracement level and the brown AB=CD bearish pattern also triggered SELLS in […]
-
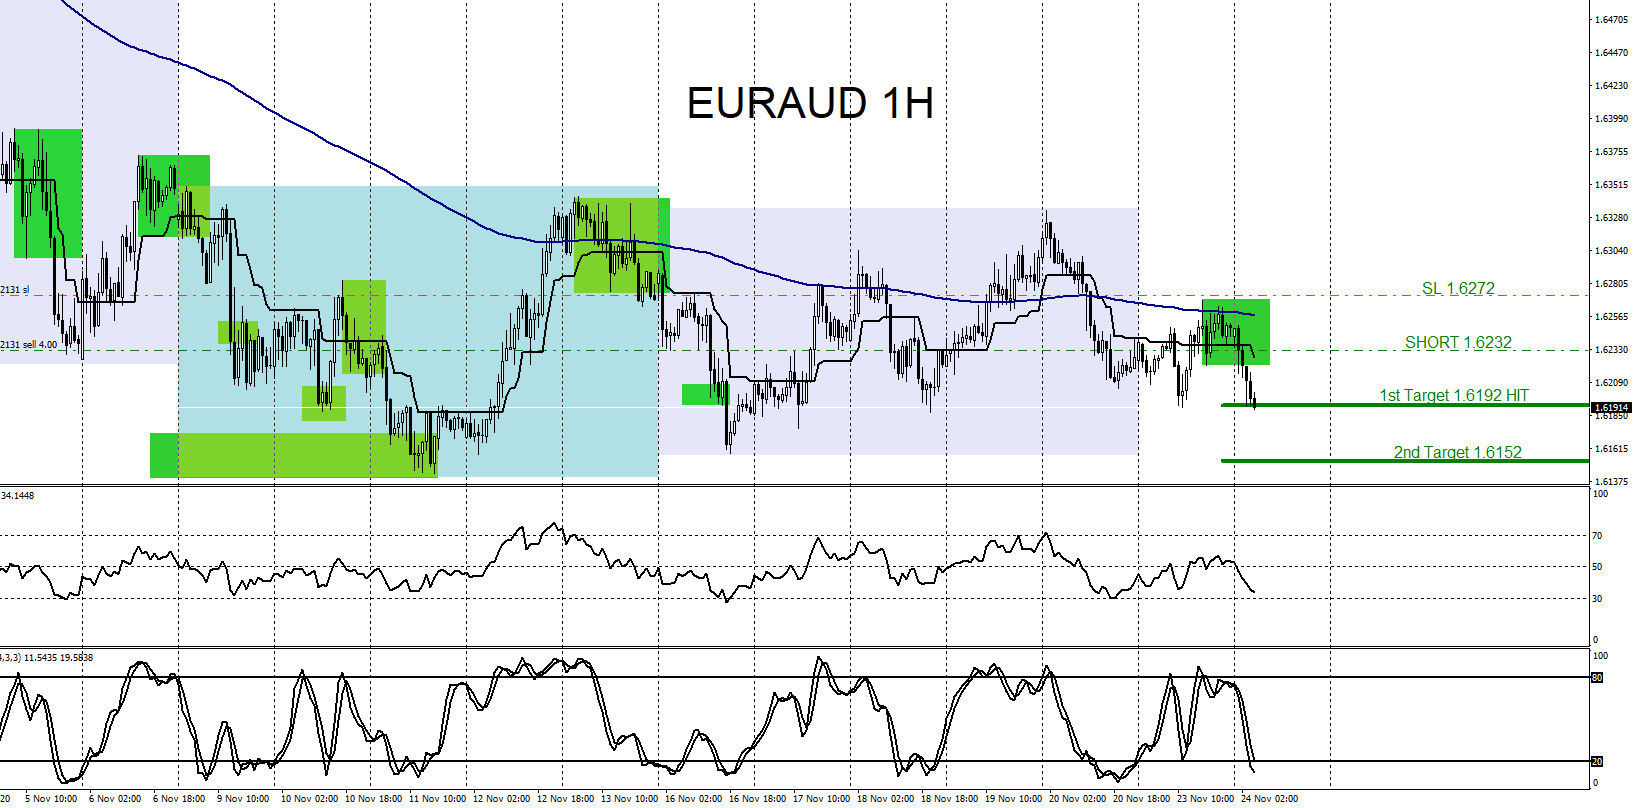
EURAUD : Trading with the Trend
Read MoreSince October 20/2020 EURAUD has been been moving and trending lower. We at EWF always encourage our members to trade with the trend and not against it. On November 23 2020 I posted the SELL/SHORT trade setup entry on social media @AidanFX “EURAUD @ 1.6232 SL @ 1.6272 TP1 @ 1.6192 TP2 @ 1.6152.” EURAUD […]
-
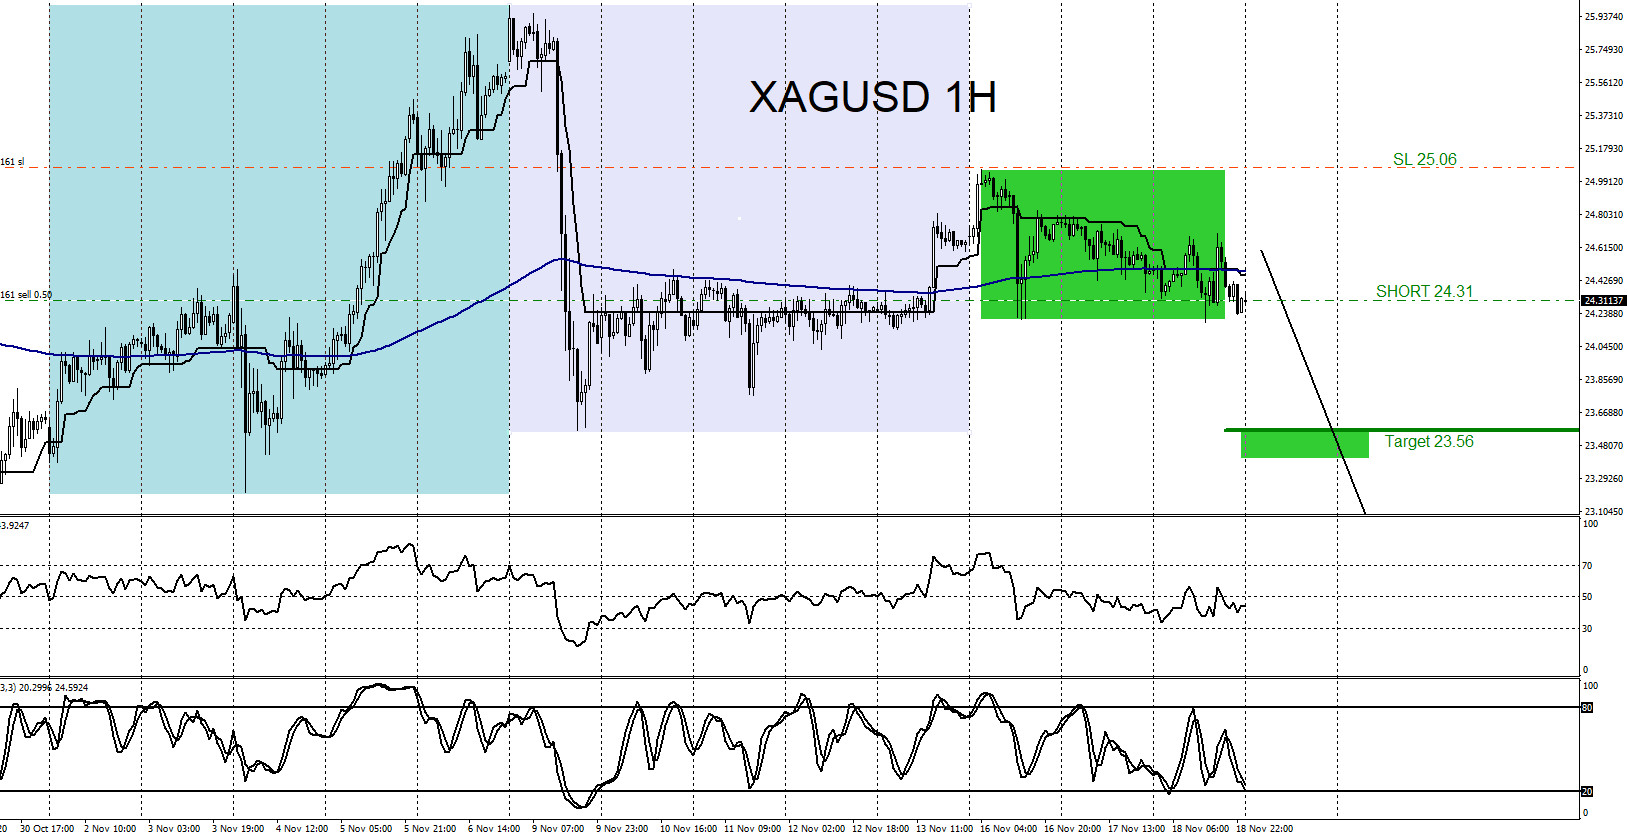
XAGUSD : Calling the Move Lower
Read MoreOn November 18 2020 I posted on social media @AidanFX “XAGUSD Watching for selling opportunities. Expecting more downside. XAGUSD as long price stays below 25.07 expect a move lower towards the 23 handle.” The chart below was also posted on social media @AidanFX November 18 2020 showing the SELL entry. I called for traders to SELL/SHORT […]
-
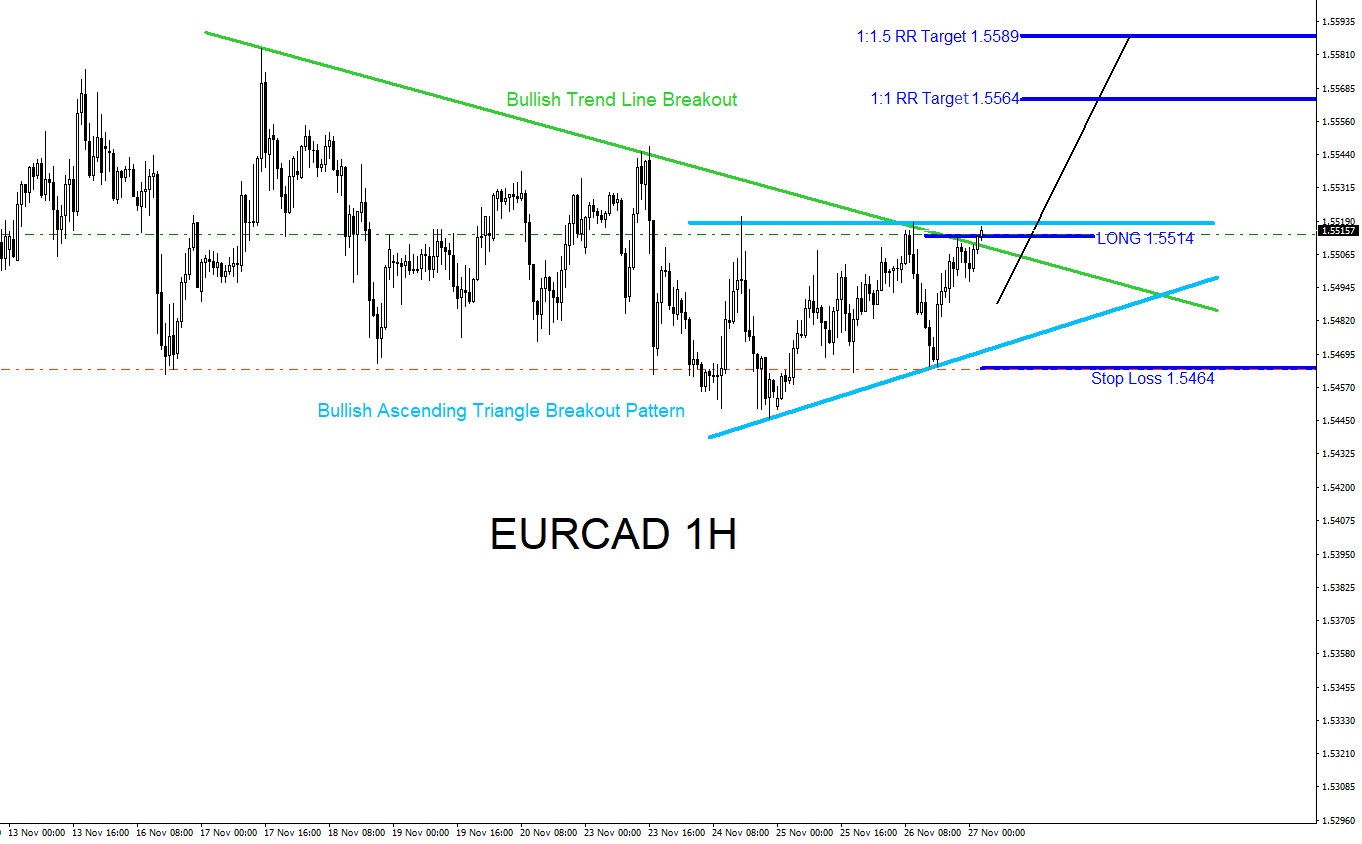
EURCAD : Can the Pair Extend Higher and Hit Targets?
Read MoreSince November 17/2020 EURCAD has been trending lower but visible bullish patterns on the 1 Hour time frame can be seen signalling traders of a possible move higher. On the 1 hour time frame a bullish market ascending triangle breakout pattern (light blue) and a bullish trend line breakout (green) was visible and on November […]