Hello fellow traders. In today’s blog, we will have a look at the Sanofi stock. The stock is listed in the Eurostoxx 50.
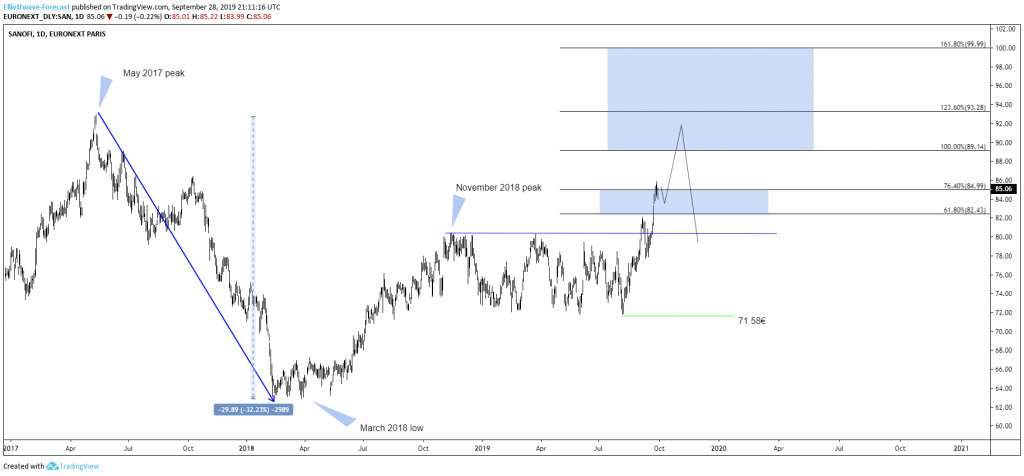
Sanofi S.A.is a French multinational pharmaceutical company headquartered in Paris, France. It is one of the biggest companies based on prescription sales in Europe. Over the last couple of years, the stock almost lost 33 of its value. Starting from May 2017. The stock dropped to 62€ low which marked the low in 2018.
Since, its low in 2018, Sanofi could recover almost 28% from its initial low. Let’s have a look at the weekly price action and what to expect for the company.
Sanofi S.A. 09.28.2019 Daily Chart
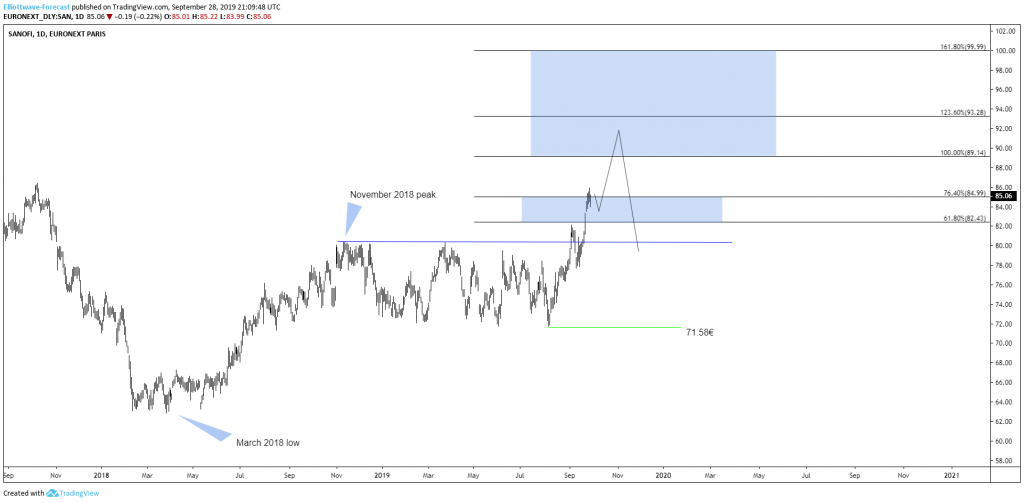
Sanofi S.A. 09.28.2019 Daily Chart
In the chart above you can see that the stock ended the cycle from 2017 peak at 2018 low. Above from there, Sanofi has been showing strength. Below from there, it has been in the progress of correcting that in 3-7 or 11 swings. Recently, Sanofi broke above 11/14/2018 peak opening up a higher high sequence. With that said, the stock has an incomplete sequence from 2018 low indicating that more upside towards 89.14-93.28. Consequently, I am looking for another push higher until 89.14 has reached.
Summarizing, the stock should see more upside in the next coming days/weeks into 89.14-93.28 area where a bigger reaction lower could be taking place later on.
We believe in cycles, distribution, and many other tools in addition to the classic or new Elliott wave Principle. To get a regular update on the market and Elliott wave charts in 4-time frames. And the best thing is you can join us for a 14 days FREE trial to see whether our service suits you.
If you enjoy this article, check our work and join HERE to see Elliott Wave Forecast in 4-time frames for 78 instruments as well as getting access to Live Trading Room, Live Session, and more.
Back


