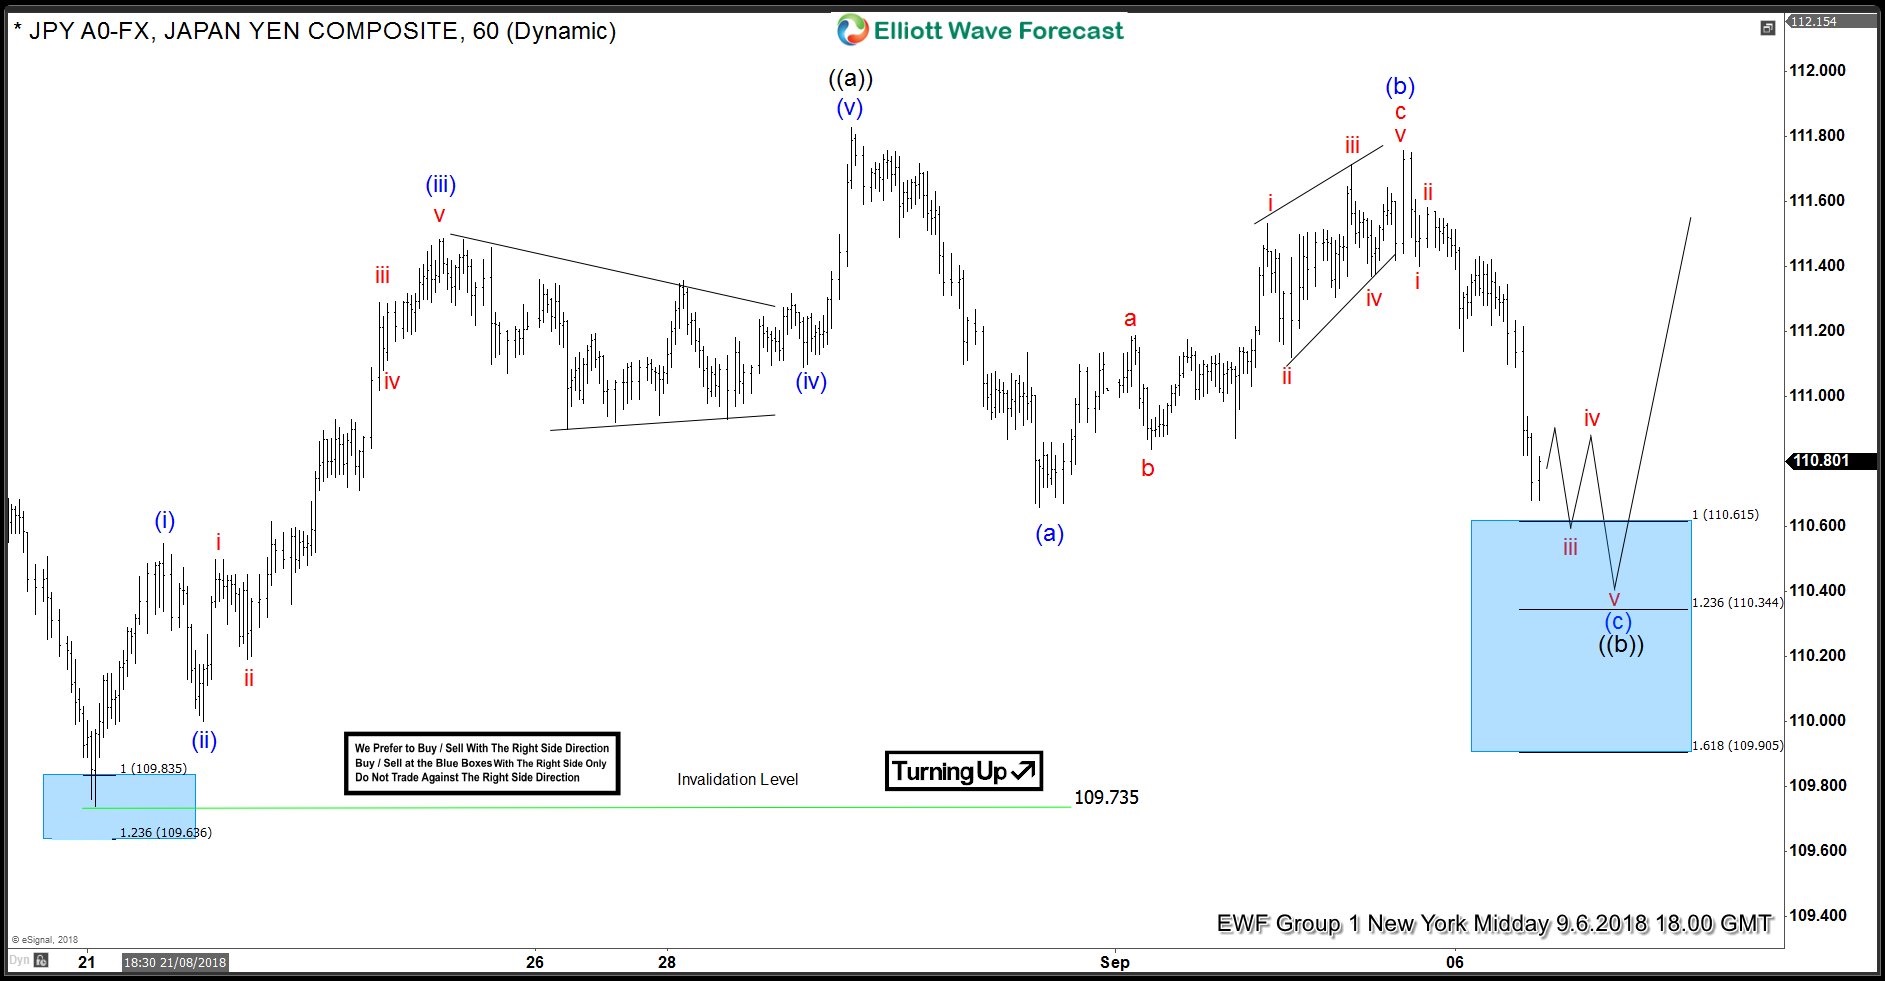
In this blog, we will have a look at some past Elliott Wave charts of USDJPY which we presented to our members. You see the 1-hour updated chart presented on the 09/06/18 showing that USDJPY ended the cycle from 08/21 low in black wave ((a)).
From that peak. It started a pullback lower in black wave ((b)). The pullback proposed to unfolded as an Elliott Wave ZigZag structure. The overall right side in the higher timeframe is higher. So we advised members that the right side is to the upside. Therefore, we expected buyers to appear in the dips in the sequences of 3, 7 or 11 swings. At the 100 – 1.236 Fibonacci extension of blue (a)-(b). Which came at around 110.615-110.344 area. And that was the first area for buyers to appear to take prices to new highs above black wave ((a)) peak.
USDJPY 09.06.2018 1 Hour Chart Elliott Wave Analysis
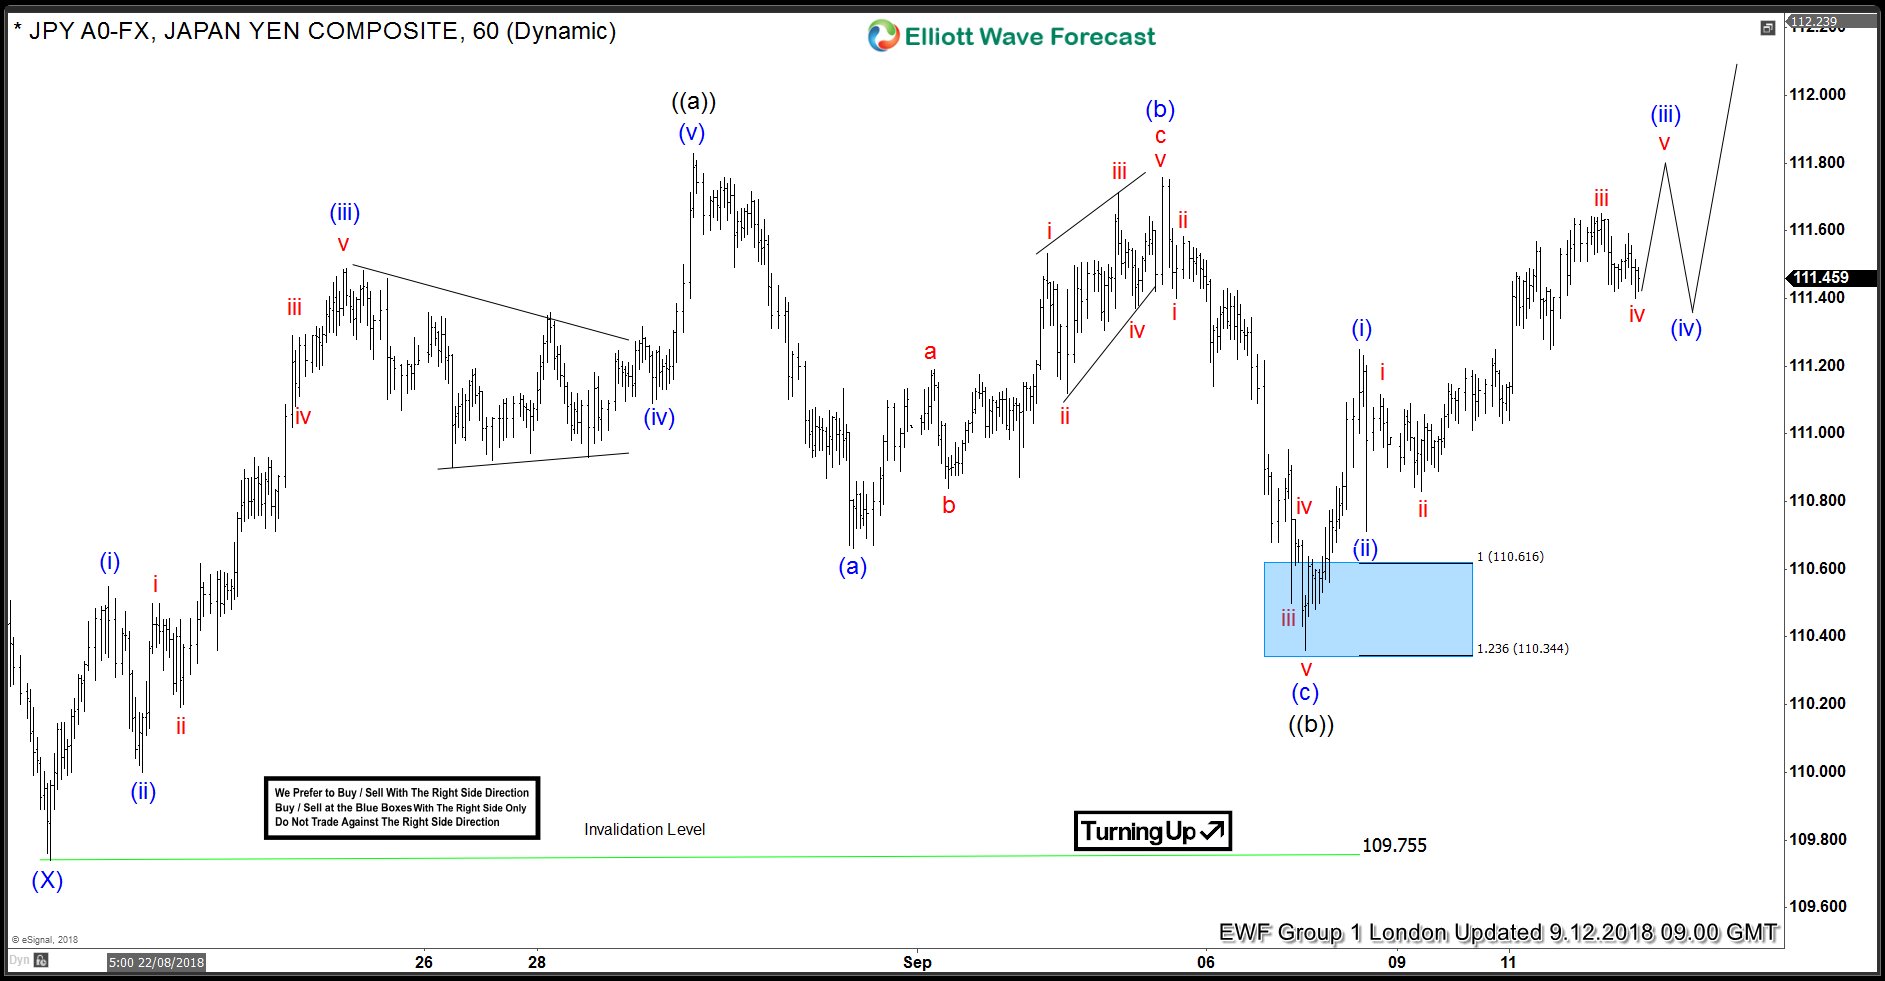
In the last Elliott Wave charts, USDJPY continued the rally after reaching the blue box area (110.615-110.344 area). Any trades made from our blue box area was risk-free and the bounce higher have continued and it is expected to reach its first target soon. Do please keep in mind that the 1-hour chart which I presented have changed already. If you are interested in how to trade our blue box areas and want to understand how Elliott Wave works then I recommend you to join our Special Webinar which we will hold on the 7th of October. You can join by clicking the link below.
USDJPY 09.12.2018 1 Hour Chart Elliott Wave Analysis
I hope you enjoyed this blog and I wish you all good trades and if you interested in learning more about our unique blue box areas and also want to trade profitably. You can join us on our special webinar. Limited Seats available!
We believe in cycles, distribution, and many other tools in addition to the classic or new Elliott Wave Principle.
Back


