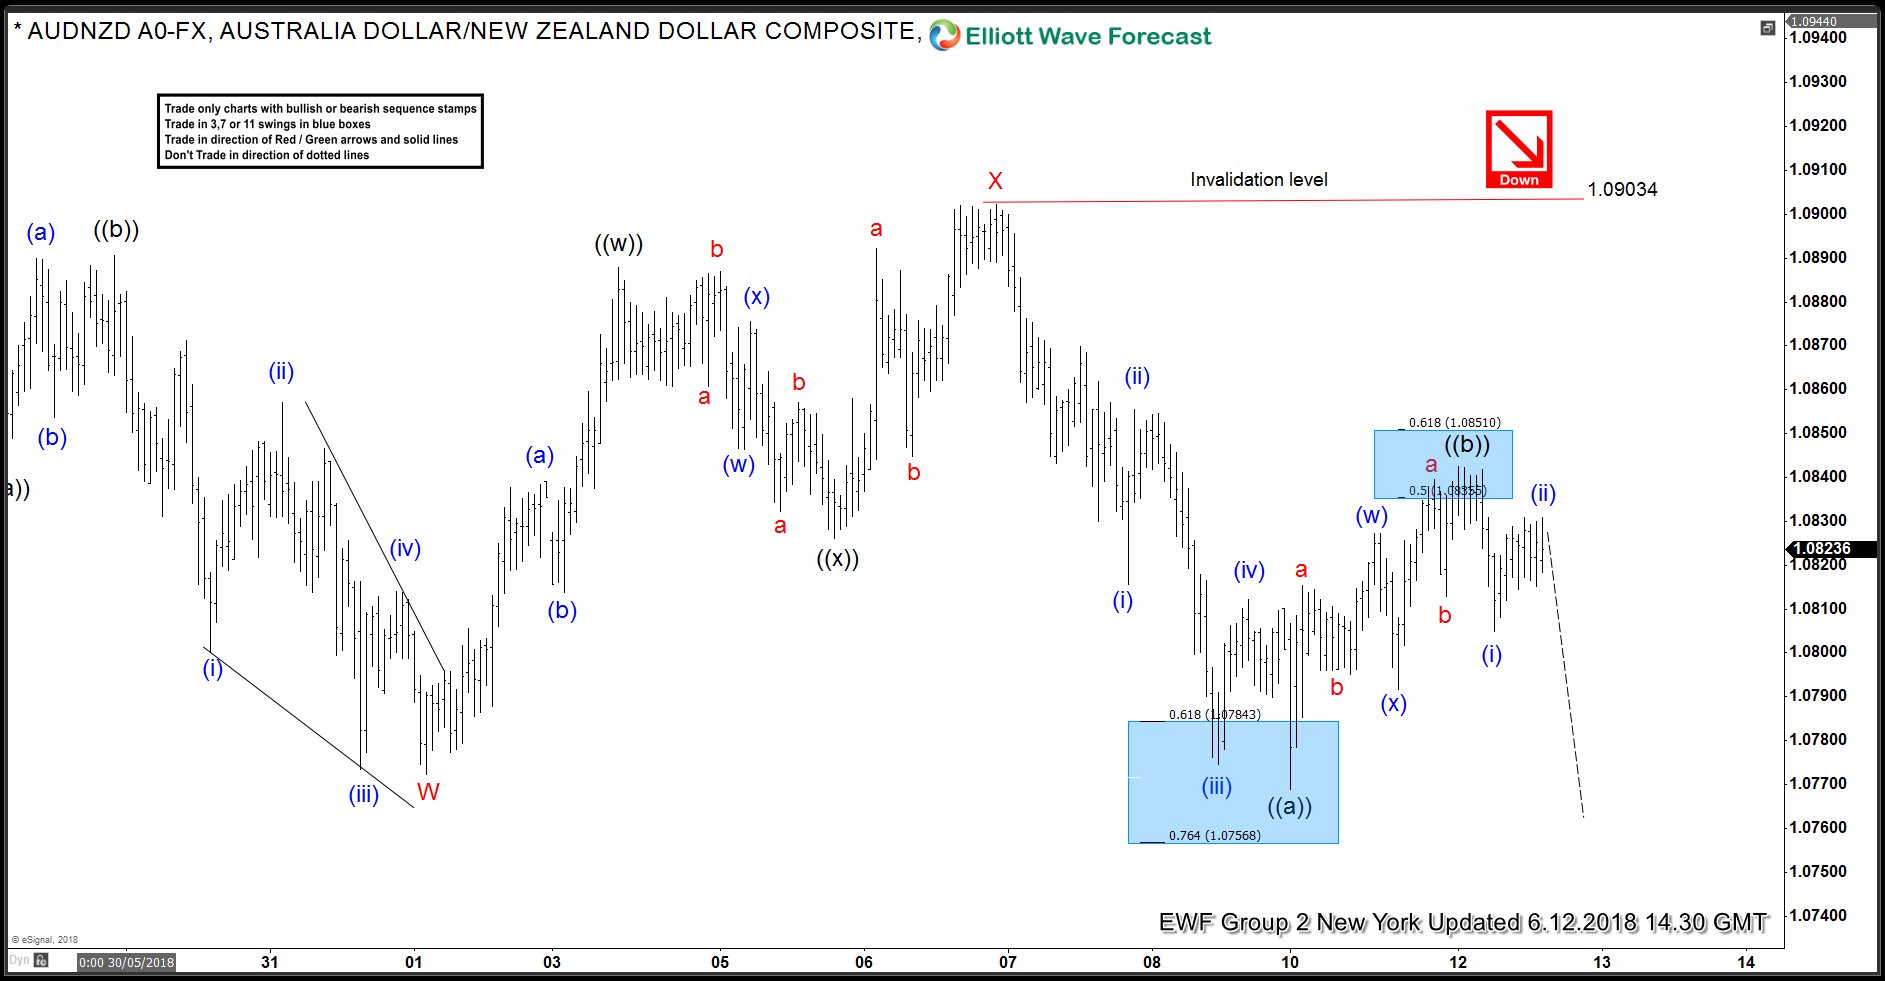
Hello fellow traders. Today, we will have a look at some Elliott Wave charts of the AUDNZD which we presented to our members in the past. Below, you can find our 1-hour updated chart presented to our members on the 06/12/18 calling for more downside after a Double Elliott wave correction in blue wave (w)-(x).
AUDNZD had a bearish sequence from 05/25 peak, targeting the equal legs of around 1.07151+ areas. Shorter-term it ended the cycle from 06/06 peak in black wave ((a)) at the low of 06/08 (1.07796). Up from their, we advised our members that the right side remains to the downside. So we said that black wave ((b)) pullback can be sold in 3,7 or 11 swings against 1.09029. For another extension lower to the equal legs from 05/25 peak. With that said, we advised members that the right side remains to the downside.
AUDNZD 06.12.2018 1 Hour Chart Elliott Wave Analysis
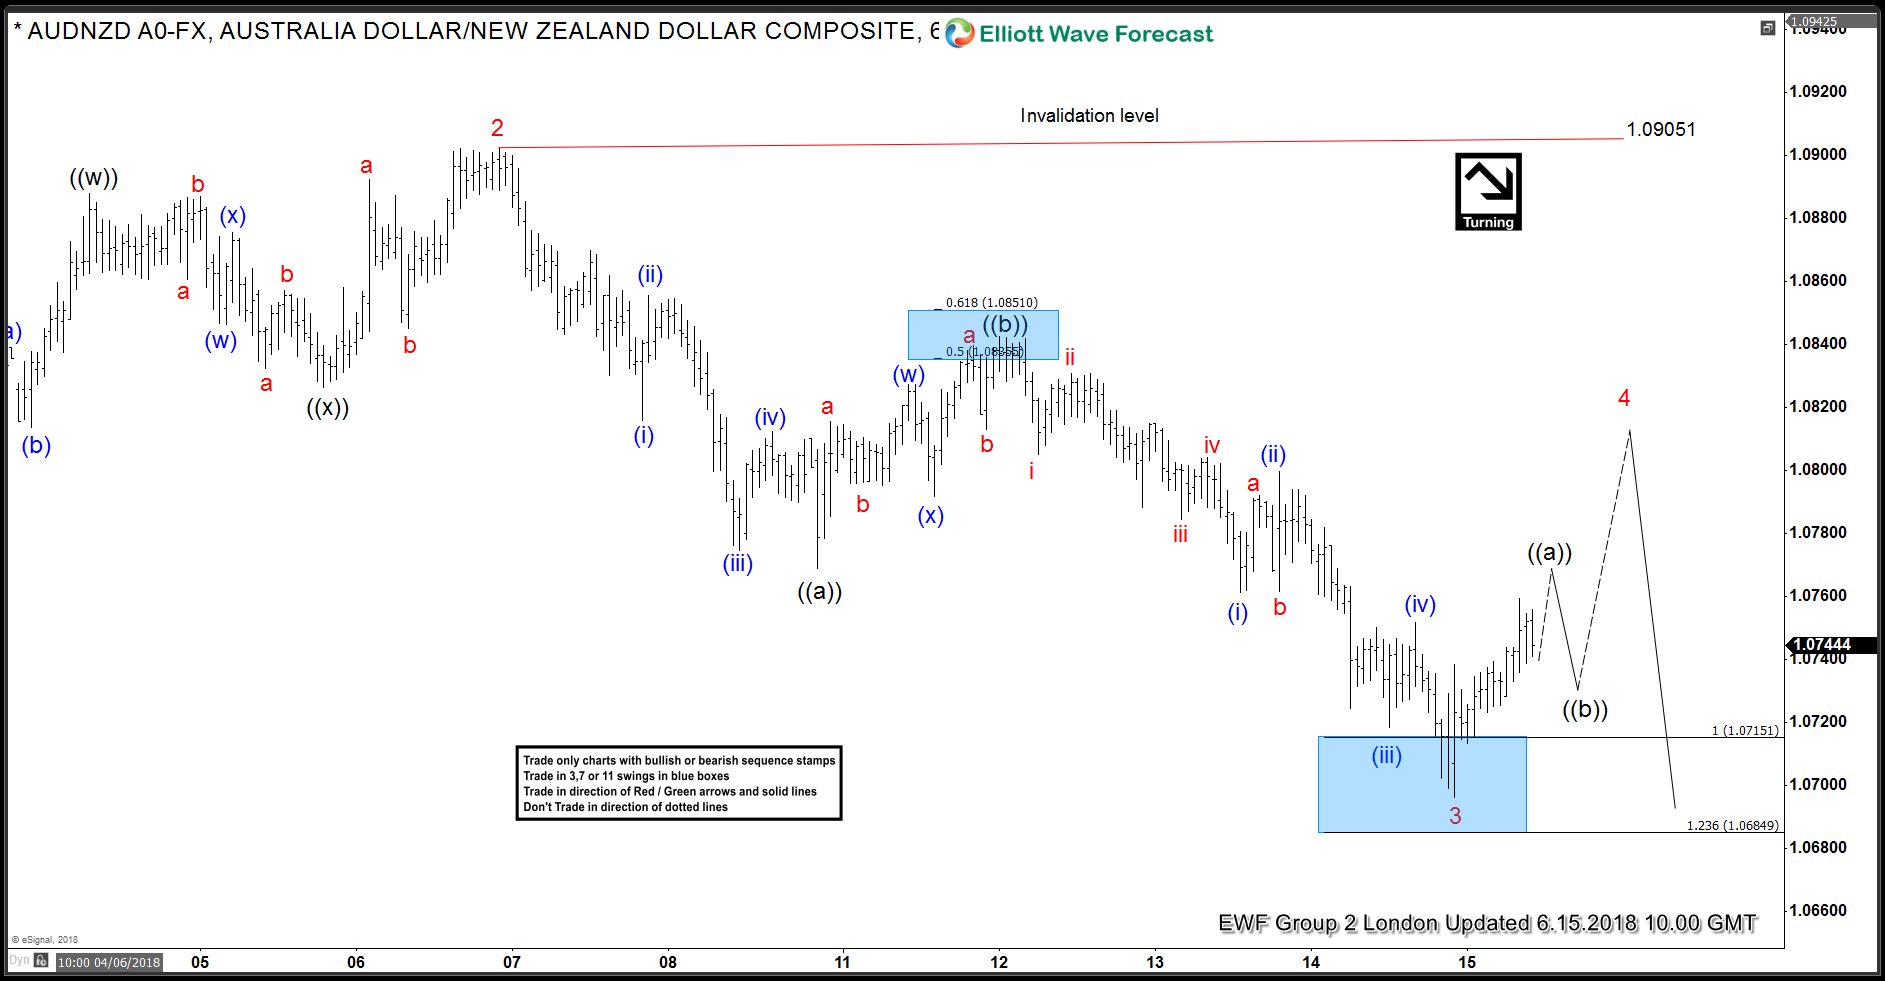
In the last weekend Elliott Wave chart, you can see that the instrument pulled back from the equal legs, after ending cycle from 06/08 low in black wave ((b)). From that equal legs, the pair continued nicely the weakness to the downside and reached the equal legs from 05/25 peak at 1.07151. Any trades from the equal legs blue box area where closed with a nice profit. Our members enjoyed this nice trade to the downside, yielding around +119 pips! For now, we like to stay on the sidelines in this instrument.
AUDNZD 06.15.2018 1 Hour Elliott Wave Chart
I hope you enjoyed this blog and I wish you all good trades and if you interested in learning more about our unique blue box areas and also want to trade profitably. You can join for 14 days free trial. See you insight!
We believe in cycles, distribution, and many other tools in addition to the classic or new Elliott Wave Principle.
Join us today for a FREE 14 Days trial and see our latest trading setups and charts.
Back


