In this Blog, we will have a look at the bigger picture of EURUSD pair. One of the reasons why retail traders fail in trading is because they stick to one time frame, analyse that and trade that accordingly.
However, traders with this approach will not last long in this business. One of the key elements when analysing the markets is to start with the highest time frame you can find (monthly, quarterly, yearly). Traders lack in knowledge. They think that when they trade the 1-hour chart or even the 15 minutes, they don’t need to know and identify the higher degree trend. When they trade the 1-hour chart and a bigger move comes across the market, traders get off-guard and get stopped out which leads to frustration and even results in more losses due to revenge trading or reversing positions without any planning.
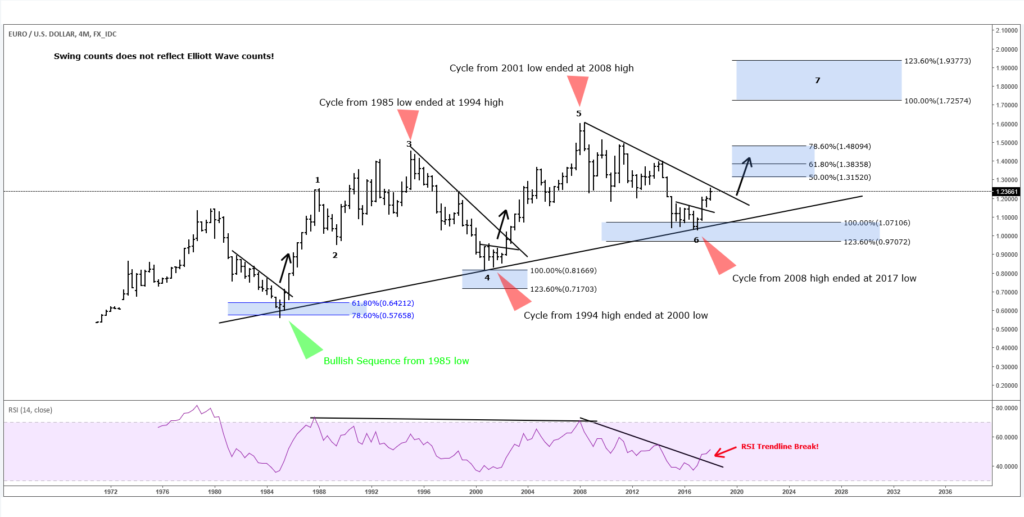
In this special blog, I want to share with you the EURUSD Quarterly chart. I want to show you why the EURUSD is bullish and there is a chance that decline from early 2001 has ended at the 2017 low (1.0711). The swing counts do not reflect Elliott Wave counts!
EURUSD Quarterly Chart
In the chart above, you can see the EURUSD in the quarterly chart. The pair has a 5 swing bullish sequence from 1985 low, targeting the areas of around 1.72287+ areas. I want to make clear in this blog that I am not saying that the EURUSD will go to 1.72287. And I also want to point out that minor pullbacks in lower time frames will occur. The market never move in one straight line. I just want to point out with this blog, that the EURUSD is supported overall. Even if you “only” take the 50% Fibonacci extension from the decline from 2001, the EURUSD can go to at least 1.32522-1.40 levels.
Having a look at the history you can see that when EURUSD reached the equal legs from 1994 high at around 0.81669. From there it bounced and made new highs.
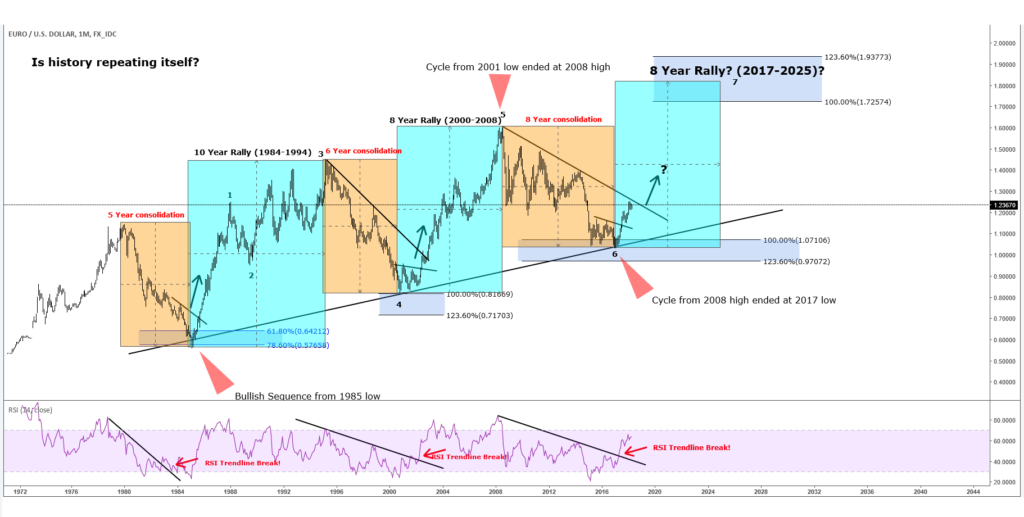
EURUSD Monthly Chart
Now, let’s have a look at the monthly chart. You can see that the past rallies took about 8-10 Years. And the consolidation phase took around 5-8 years.
You can see after the consolidation that the market broke the consolidation trend-line and rallied big time in the past in a similar manner. If you have a look at the current consolidation trend-line. You can make out that EURUSD is still missing the break of the trend-line from the decline of 2008. We need to understand that the break is still missing and a new low below 2017 can’t be ruled out.
However, having a look at the RSI trend-line from 2008 we can see that it already broke it. That gives us the first clue that market has ended the cycle from 2008 high and should ideally rally. Anyhow, a break in the price trend-line should be coming soon this year. If history is repeating itself, we are looking to a rally to the upside which could take us about 8 years.
Believe it or not. In our book, if trading on a very long-timeframe, the areas to build up long position were from equal legs area (1.07106 areas), looking for higher targets. However, coming back to my comment above that “retail traders fail in trading because they stick to one timeframe, analyze it and trade it accordingly” With this charts, you can see that the EURUSD is not bearish at all like many analysts assume. We wrote another blog about the DXY explaining the Dollar Index and its path.
I hope you enjoyed this special blog and wish you all good trades.
We believe in cycles, distribution, and many other tools in addition to the classic or new Elliott Wave Principle.


