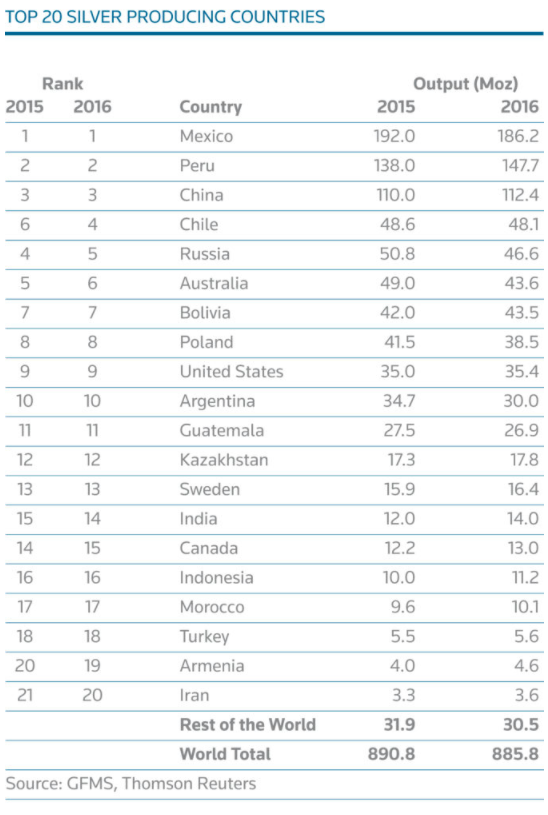
Commodities have been in an All-time correction since they peaked in 2011 and they can be showing the next good Long-term Trading or an Investing opportunity across the Market. Commodities like Silver and Gold have always represented value and we cannot expect that value to disappear all of a sudden. Silver is a very interesting instrument because together with Oil, they have shown the biggest devaluation against the US Dollar and consequently will represent the biggest opportunity. The Following chart represent the all time cycle in Silver and also the stage within the correction which is showing the extreme area and off course the Invalidation level in the Yearly cycle. As we can see the Instrument has dropped back almost to the 76.4% of the all time rally and has entered a buying area.
Silver Cycles from all time low
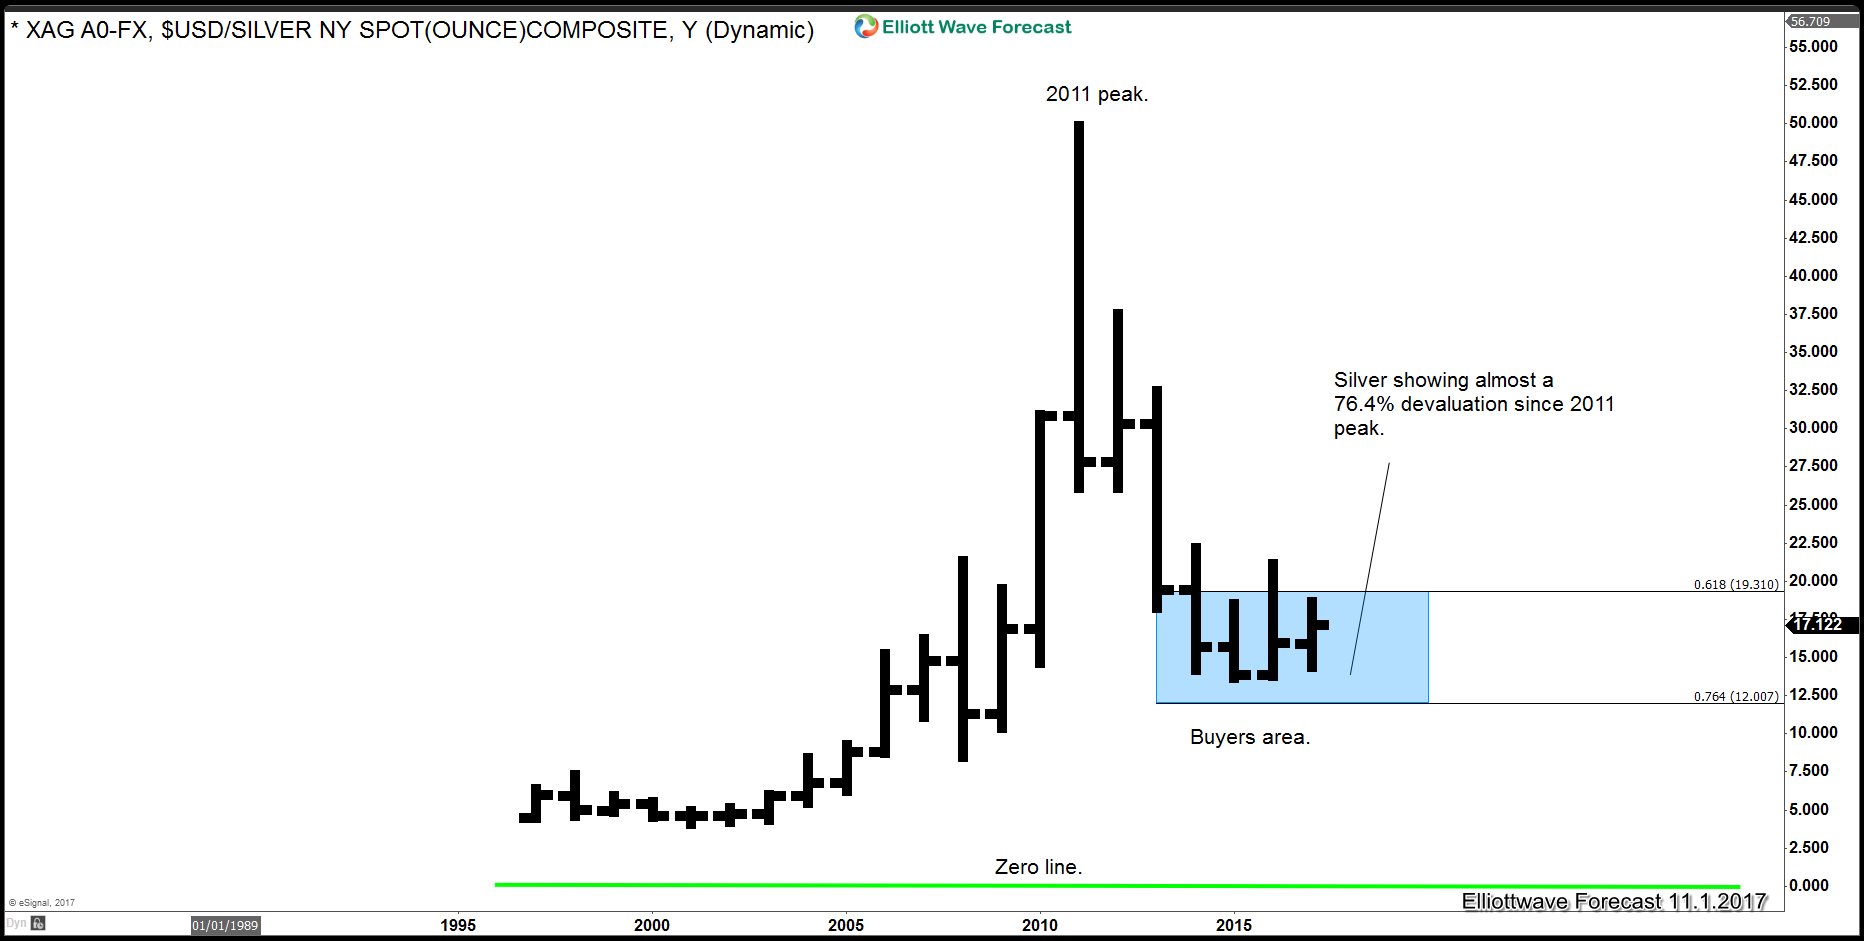
The whole group has declined since the peak in 2011 but what makes Silver the best opportunity is the degree and how deep the decline has been, chart below shows Gold chart from all time lows, we can see the decline in Gold has not been so deep, making Silver a better long term investment opportunity.
Gold cycle from all time low
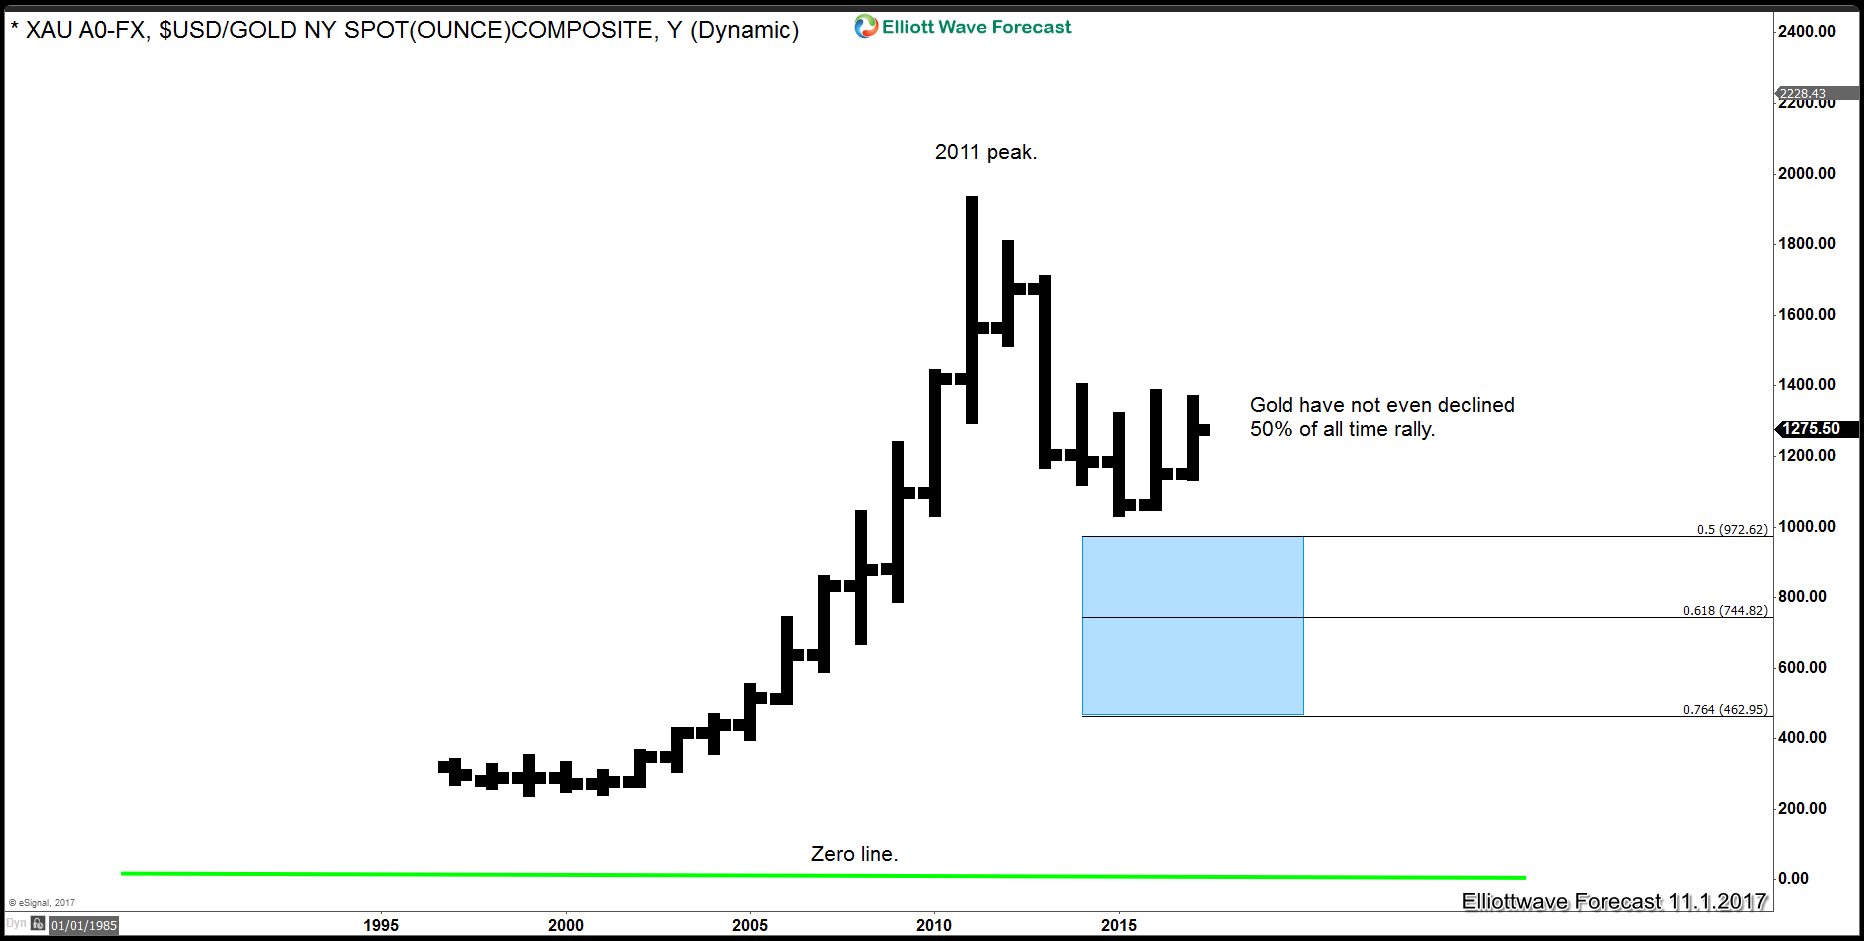
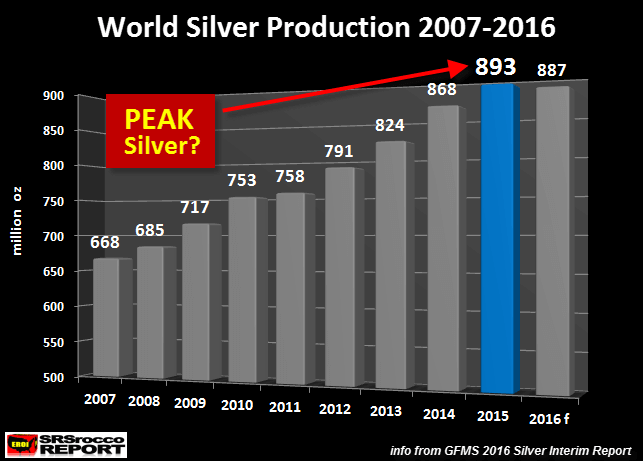
There are many Fundamental reasons to justify the decline but the production numbers is the simplest way to understand a deep decline. The higher the production of Silver, there will be higher stockpiles in the Market and consequently the price will drop. According to the Silver Institute the Silver Production slowed down in 2016 and consequently the Instrument is creating a base in price.
The following charts show the break down in production and the breakdown by county
World Silver Production from 2007 – 2016
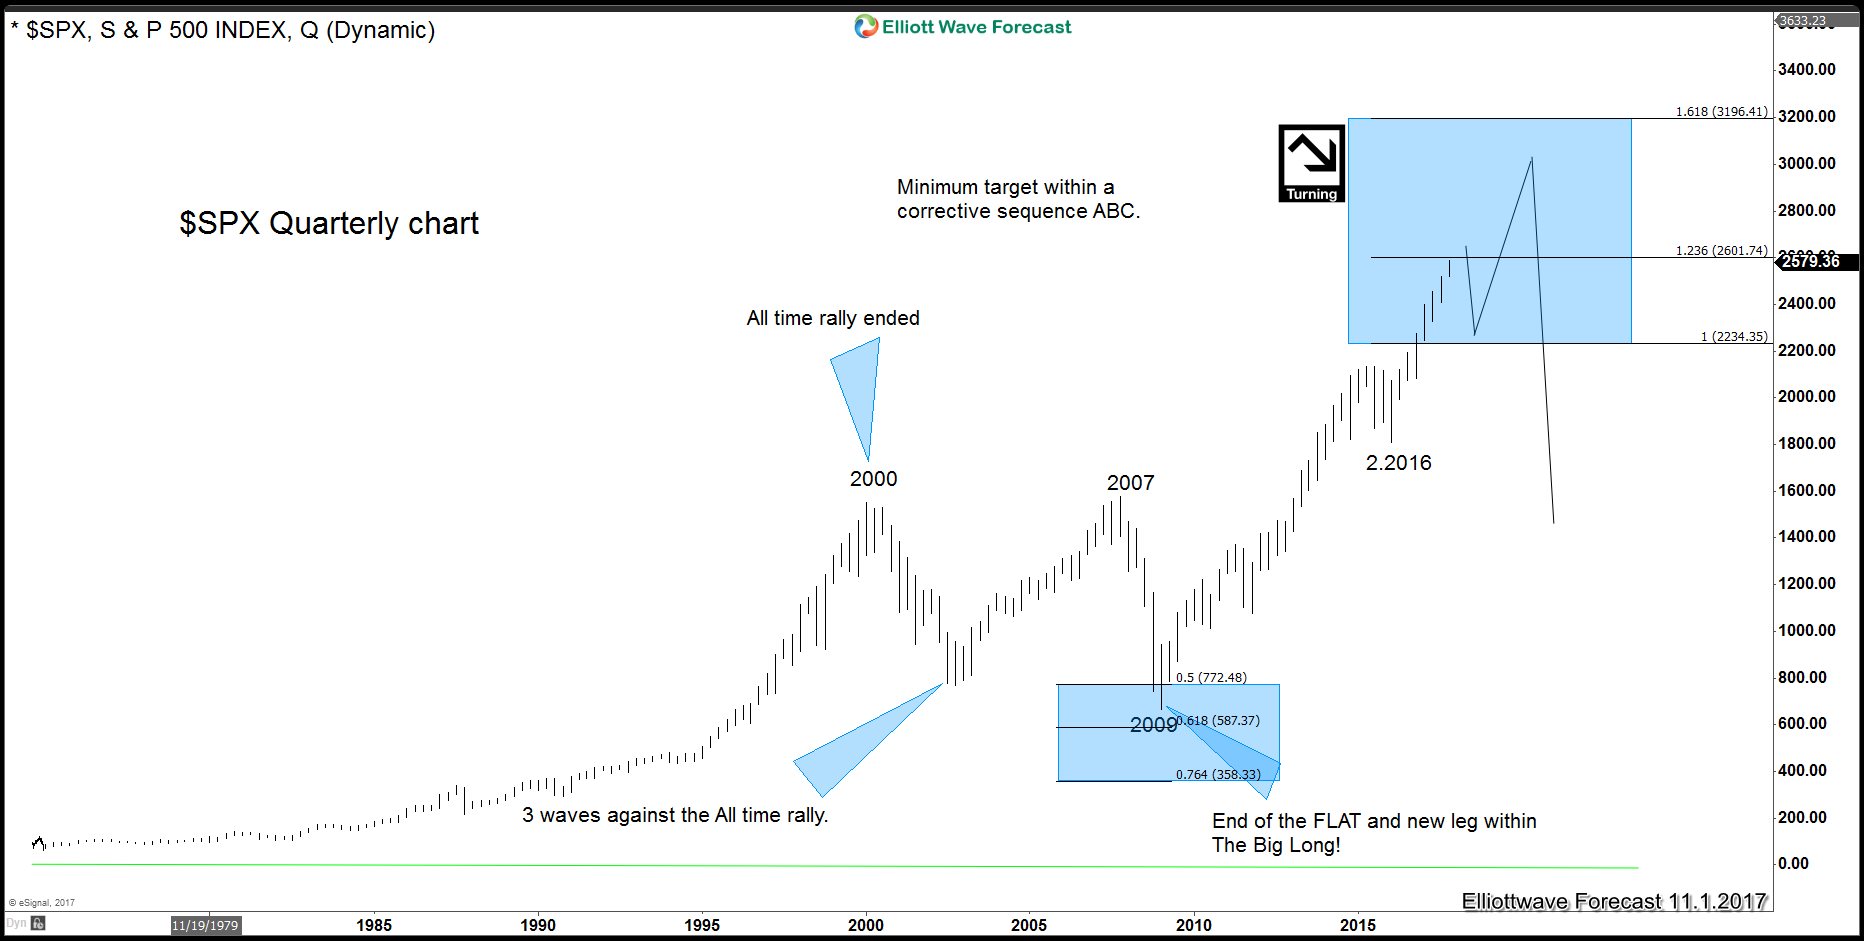
The $SPX Index has reached the Blue Box which highlights an extreme area from the all time low, but many other World Indices have still not reached the same degree area. The idea is that $SPX is at levels at which Silver was in 2011 extreme and while it stays below 3196, a multi-year correction could unfold. Above 3196 would suggest the next big pull back would only correct the cycle from 2009 low before another leg higher. Even then a multi-year correction should be seen before the next leg higher in the Index.
SPX Quarterly Chart
Silver will be sideways and even when it can make a new marginal low in the Weekly chart, it has already reached the target within the pull back. The reason why the Instrument can be sideways is due to the fact that most of the World Indices have not yet ended the all time cycles and they seem to have more upside. We believe in the idea that when the World Indices end the cycle from all time lows, they will enter in a multi year correction similar to the one that happened from 2000 through 2009 and that will be the moment when Silver and all commodities will enter a multi year cycle higher which will have scope to drive Silver prices above the $60.00 level. Buying the Instrument this low represents a great long term opportunities not only to buy commodities, but also a chance to pick the top in World Indices. The following chart represents the overlay of Silver and $SPX and we can see what happened between the year 2000-2009 and how since the peak in 2011 $SPX has been trading higher and Silver lower.
XAGUSD and SPX Overlay
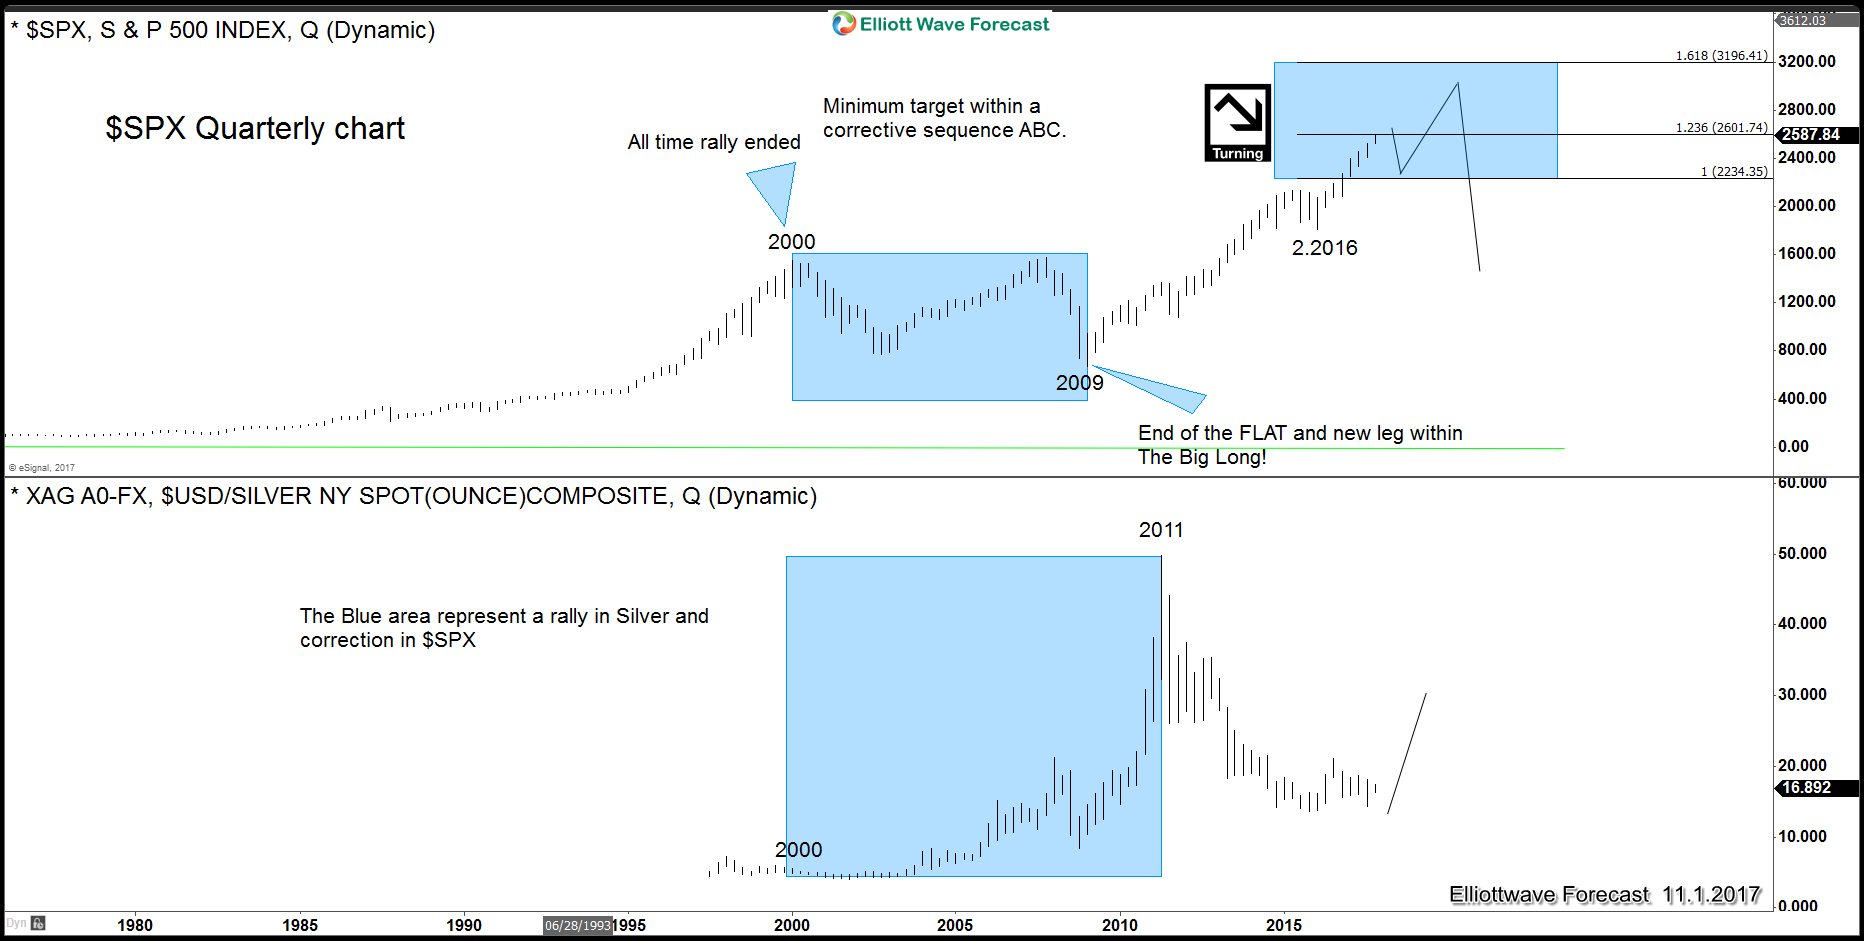
Sometimes trades need to understand the Market acts as a whole and this previous chart shows a smart way to pick the top in World Indices instead of trying to sell any new high. Our advice is to trade smart and understand the concept of one Market and be able to catch the Big Short in Indices without actually selling the Indices.
Back