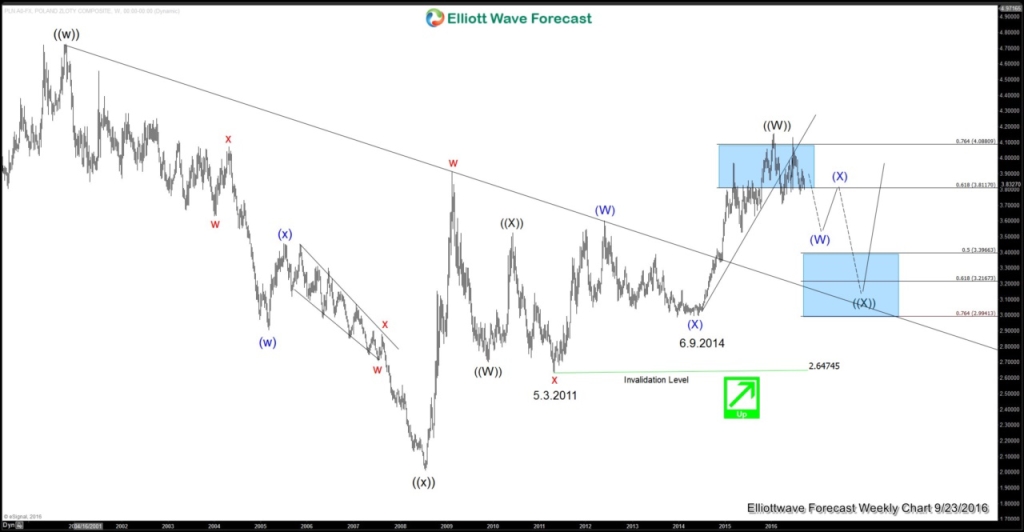
$USDPLN Weekly Elliott wave chart below suggests that cycle from 5.3.2011 low (2.64) has ended and the pair is in the process of pullback to correct this cycle in 3, 7, or 11 swing with potential target as low as 3.216 – 3.396 area before the rally resumes.
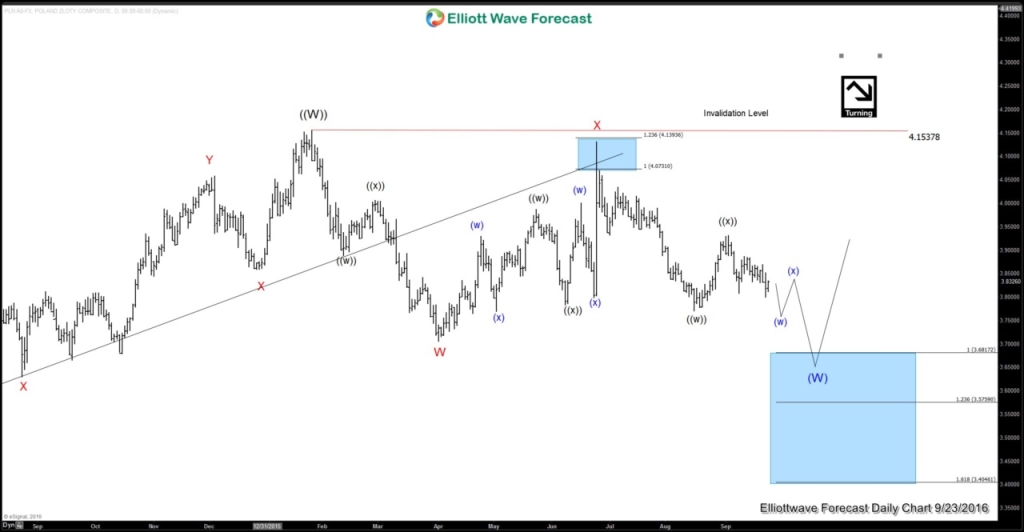
Looking at the Daily Elliott wave chart below, the decline from 1/26 (4.15) high is unfolding as a double three where wave W ended at 4/1 (3.705) low and wave X ended at 5/24 (4.13) high. Near term, while bounces stay below 3.93, and more importantly below 4.153, pair is expected to resume lower towards 3.576 – 3.68. A break below 8/16 low at 3.77 should confirm the move lower.
Video
Take our FREE 14 Day Trial or join our Live Trading Room if you are interested to learn more and find inflection area to trade forex, indices, and commodities using Elliottwave technique. We provide Elliott Wave chart in 4 different time frames, up to 4 times a day update in 1 hour chart, two live sessions by our expert analysts, 24 hour chat room moderated by our expert analysts, market overview, and much more! You can also read other articles at our Technical Blogs and check Chart of The Day
Back


