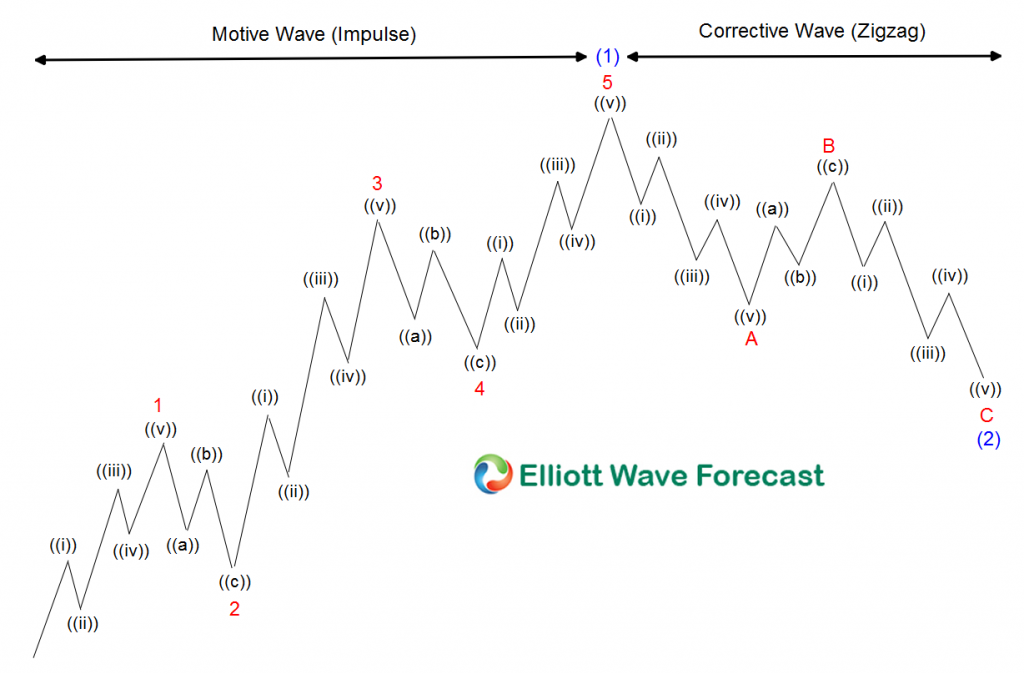
The USDMXN aka Mexican Peso has seen strength since its peak back at April 2020 highs. It is fascinating when we look at the Super-cycle degree it seems like how a Five waves advance has ended. And now seeing a five waves decline since the peak at 04.2020. Gives our forecast more strength and reliability to happen. The whole Elliott Wave Theory is based on the idea that the trend moves in Five waves and is correct in three waves. The following chart shows the classic Elliott Wave Pattern:
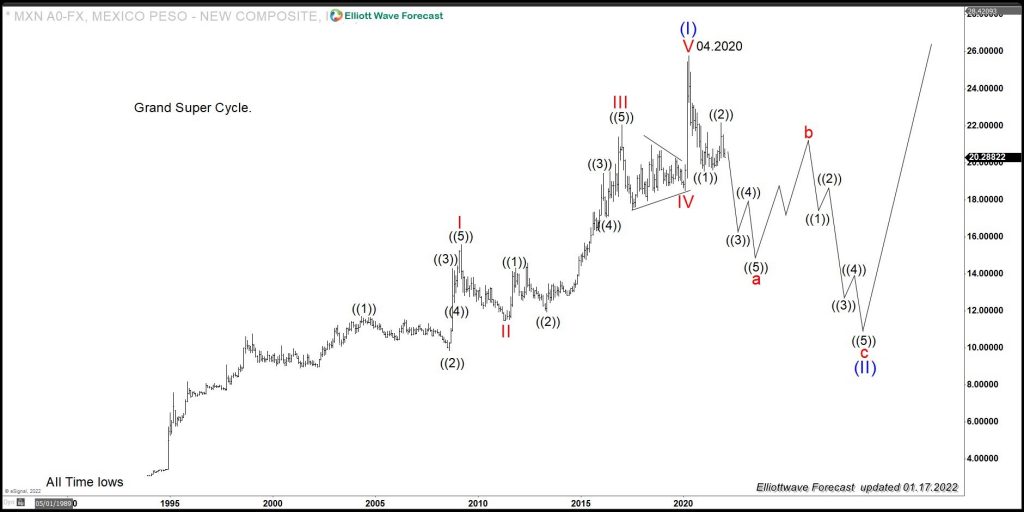
The Super Cycle chart shows that the Five waves advance and the three waves pullback follow. The USDMXN within the Supercycle is showing tremendous strength. Still, it seems, as we have mentioned above, the possibility that the cycle has ended, which now should follow with a substantial multi-year three waves pullback which will be bad for the US dollar.
USDMXN Weekly Elliott Wave Chart
Shows the supercycle advance and the proposed pullback, which should take years to end. The Peso peeked at 04.2020, and since then trade lower in a clear five waves declined, as it should be doing in the Supercycle. The Peso reacted higher in three waves, and ended the reaction off the lows, and seen now like another cycle has started lower, which for us is wave ((3)) of a. The idea of what is seen to be five waves in (1) ending since the 11.2021 peak makes the Peso a Leading Indicator for the $USDX trade, and it is sending a warning that the cycle since the lows at 01.06.2021 might be ending soon.
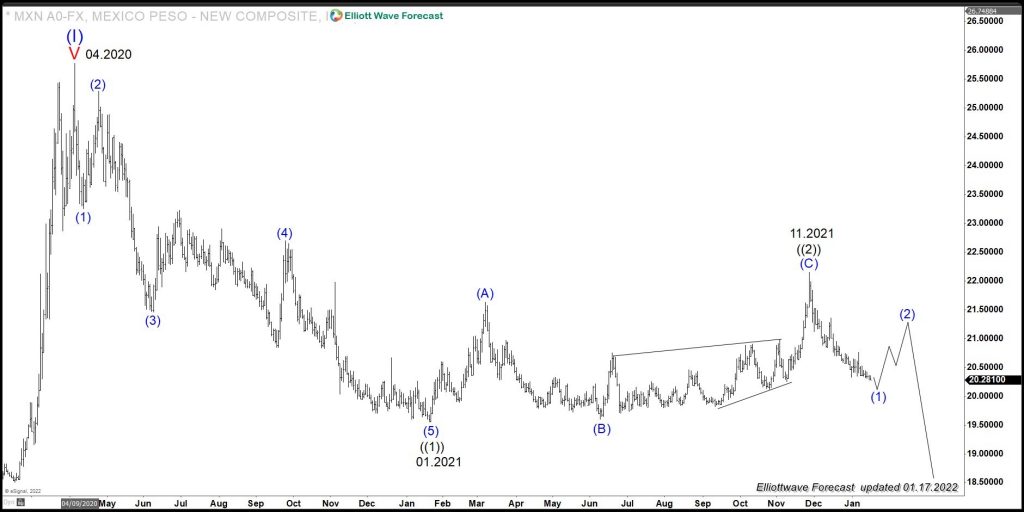
USDMXN Daily Elliott Wave Chart
Weakness for the Dollar should be happening, and a warning is there in the marketplace. It shows the Peso labels since the peak at 04.2020 and what should be happening next. Please, watch the following video to understand the view explained in the charts and how it will affect the $USDX.


