Good news Singapore traders and those who trade Straits Times Index (STI). STI is a Singapore benchmark stock index, and below I will do a technical analysis in the Weekly and Daily time frame using Elliott Wave Principle. This index is currently not part of the 42 instrument covered by EWF. After watching the videos and reading the commentary below, if you are interested to learn more about Elliott Wave or how we can help you, feel free to join the 14 days trial (we have free 14 days trial promotion until mid June 2015).
WEEKLY OVERVIEW
According to Wikipedia, following a major sectoral re-classification of listed companies by the Singapore Exchange, which saw the removal of the “industrials” category, the STI replaced the Straits Times Industrial Index (STII) and began trading on 31 August 1998 at 885.26 points, in continuation of where the STII left off.
As such, we use 1998 as our starting forecast for STI. Wave ((w)) rally from 1998 -2007 unfolded in the form of a zigzag (a)-(b)-(c) structure where wave (a) ended at 2582.94, wave (b) ended at 1197.85, and wave (c) of ((w)) ended at 3906.16, which represents the all-time high in STI. The Index then declined strongly in wave ((x)) from 10/2007 – 10/2008 due to the worldwide financial turmoil during that time, but the decline was corrective and in 3 waves, finally ending at 1472.95 low.
Since then STI has rallied until today. The rally from 1472.95 is proposed to be in a zigzag (a)-(b)-(c), where the first leg wave (a) is in 5 waves diagonal. Thus we can see in this 5 waves diagonal, wave I ended at 3313.61 and wave II ended at 2627.24. Wave III is currently in progress towards 3585.82 – 3689.52, then the Index should pullback in wave IV before another leg higher to complete wave V of (a). Upon completing 5 waves diagonal (a) later, the Index is expected to correct the entire rally from 2008 low at 1472.95. As far as 1472.95 pivot stays intact in the pullback, the Index should then extend higher in the wave (c) of the zigzag.
DAILY OVERVIEW
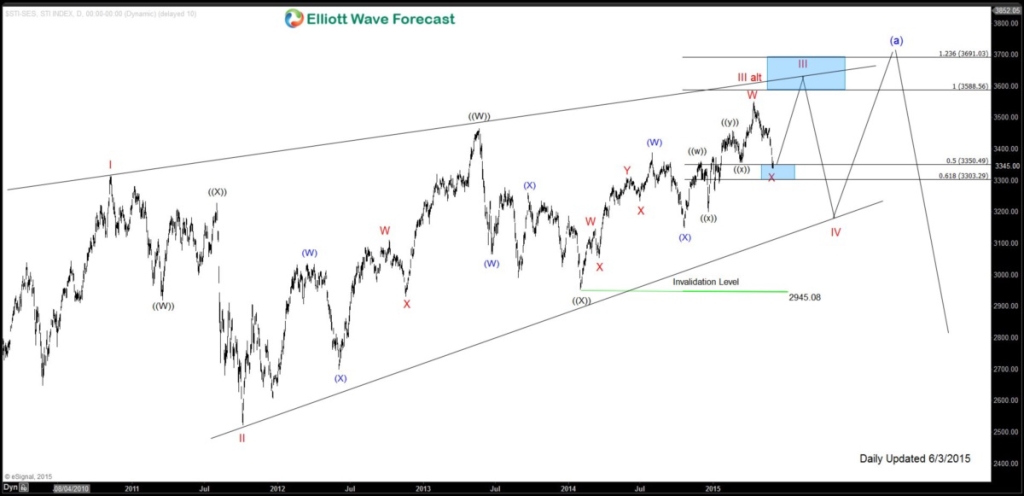
From 2008 low of 1472.95, the rally is proposed to be in a zigzag (a)-(b)-(c) structure. The first leg wave (a) of the zigzag is in 5 waves diagonal, where wave I ended at 3313.61 and wave II ended at 2627.24. Wave III is in progress and unfolding in the form of a double corrective structure ((W))-((X))-((Y)) where wave ((W)) ended at 3464.8, wave ((X)) ended at 2945.08, and wave ((Y)) is in progress towards 3588.56 – 3691.03.
Wave ((Y)) is further subdivided in a double corrective structure (W)-(X)-(Y) where wave (W) ended at 3387.84 and wave (X) ended at 3149.91. Internal of wave (Y) is also unfolding in a double corrective form W-X-Y where wave W ended at 3544.51. Wave X is in progress and expected to complete at 3303.3 – 3350.5 before wave Y higher towards 3588.56 – 3691.03 to complete wave III. Once wave III is complete, the Index should pullback in wave IV before another leg higher later to complete wave V of (a). Cycle is pretty mature at this stage, and as an alternate view, wave III could have ended already at 3544 and if the alternate plays out, then the Index is already in wave IV pullback.
We hope you enjoy our analys is. At EWF we offer professional-grade analysis and 24 hour coverage of 42 instruments from Monday – Friday using Elliott Wave Theory as primary tools of analysis. We provide Elliott Wave chart in 4 different time frames (weekly, daily, 4 hour, and 1 hour time frame), up to 4 times a day update in 1 hour chart, two live sessions by our expert analysts, 24 hour chat room moderated by our expert analysts, market overview, and much more! With our expert team at your side to provide you with all the timely and accurate analysis, you will never be left in the dark and you can concentrate more on the actual trading and making profits. Click for 14 days Trial
Good luck trading.
Hendra Lau of the Elliottwave-Forecast.com Team
Back


