Starbucks (NASDAQ: SBUX) has shown resilience in the face of market volatility, with technical price action suggesting continued support for the stock. As investors continue to navigate the current financial landscape, many are looking to technical analysis to identify the potential trend for the stock.
In this article, we will examine the Elliott Wave structure of Starbucks’ stock and discuss potential outcomes for investors to consider, providing valuable insights into the short-term trend.
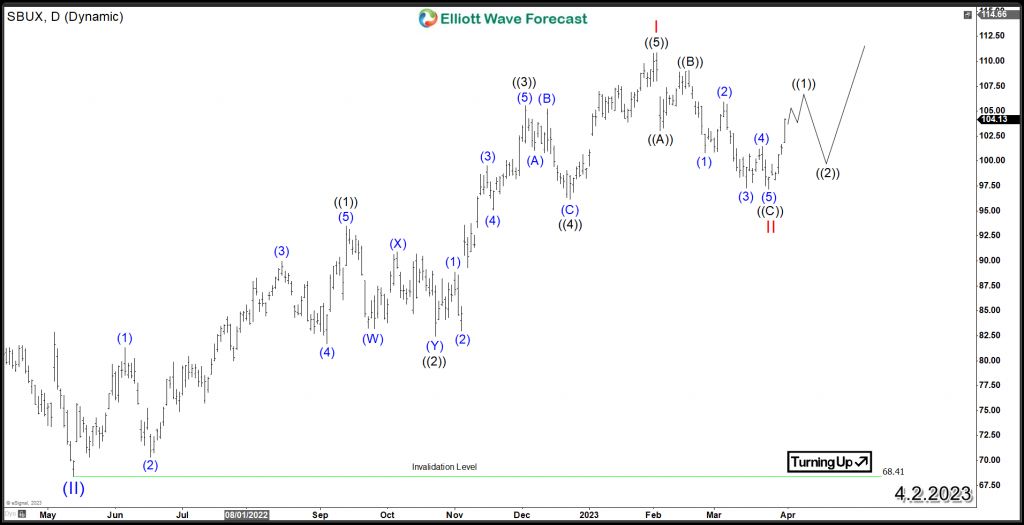
SBUX Daily Elliott Wave Chart ( 1st Scenario )
The daily chart shows an impulsive 5-wave advance in SBUX from May 2022 to February 2023, with wave I ending at $110.83. A Zigzag structure correction followed with wave II ending in three waves. The stock has since turned higher, resuming the main bullish trend. Wave ((1)) is expected to end soon after a short-term 5-wave advance. The stock is likely to pull back in wave ((2)), while still maintaining above the low of $97.19 on 3/24/2023.
For Starbucks to challenge its 2021 peak and reach new all-time highs, it would need to break above its February 2023 peak and establish a new bullish sequence. Until then, the stock will likely remain range-bound, with support around the recent low of $97.19.
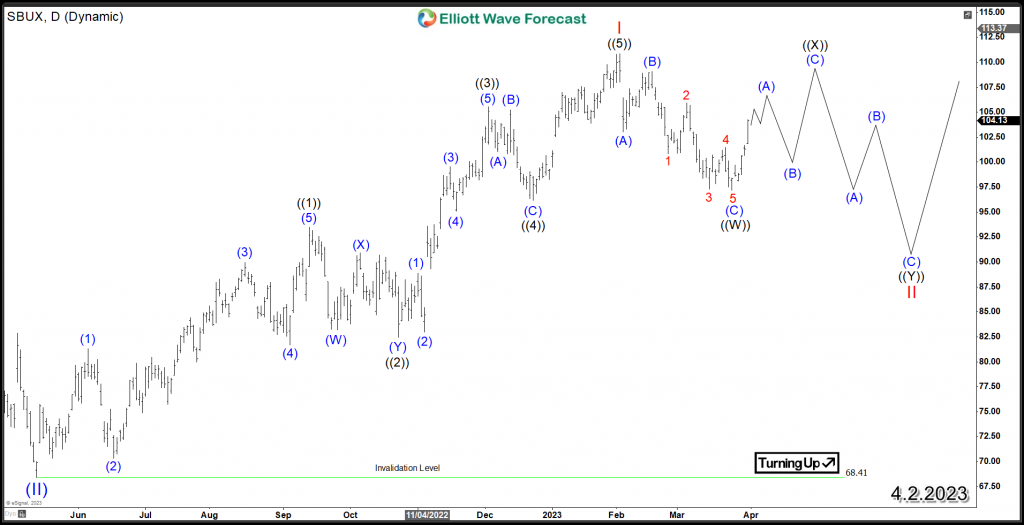
SBUX Daily Elliott Wave Chart ( 2nd Scenario )
The second scenario suggest the path in case of the failure to break above February peak. SBUX can still form a double three correction within wave II. This would indicate another 3 waves move to the downside, resulting in a total of seven swings lower from the mentioned peak. After ending the larger correction against 2022 low, the stock will again resume the rally in attempt to make new highs or at least bounce in 3 waves again.
The following video explains the view for SBUX including the wave structure of the previous rally and the current correction. It also presents a mid-term overview and potential investment opportunity based on the stock’s price action.
Back


