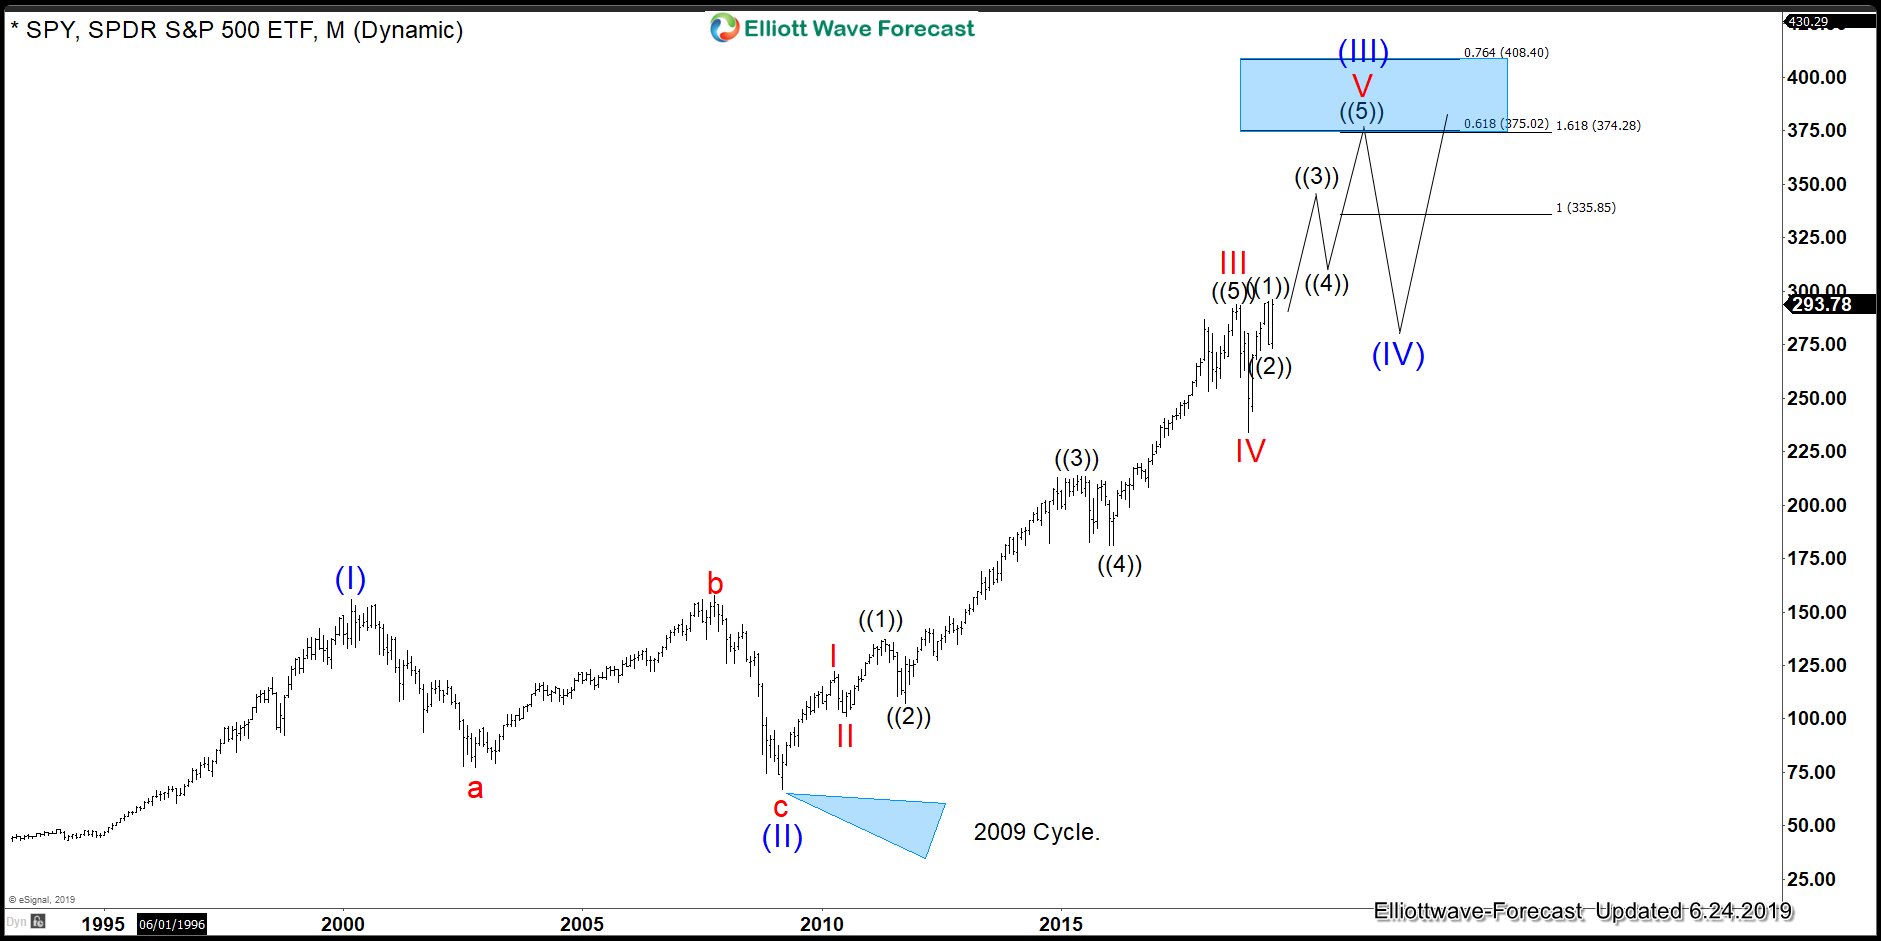
The SPY ETF is still trading within the Super Cycle degree from its 2009 lows. The ETF has now opened up another extension where it trades into new highs. Now, we should be looking into targets for the red wave V where the Super-Cycle can possibly end. Wave V possible targets in The Elliott Wave Theory should be in one of the following areas.
1: Inverted 1.236-1.618 of wave IV with current data that comes between 308-331.98
2: Wave V= WAVE I which comes at 291 which in this case come below the previous peak consequently it is invalid.
3: 61.8% of the distance between wave I and III related to the low in wave IV which come at 374.00 area.
In the chart below, you can see the 61.8% extension area which would come at 374.00.
SPY ETF Monthly Elliott Wave Analysis 6.24.2019
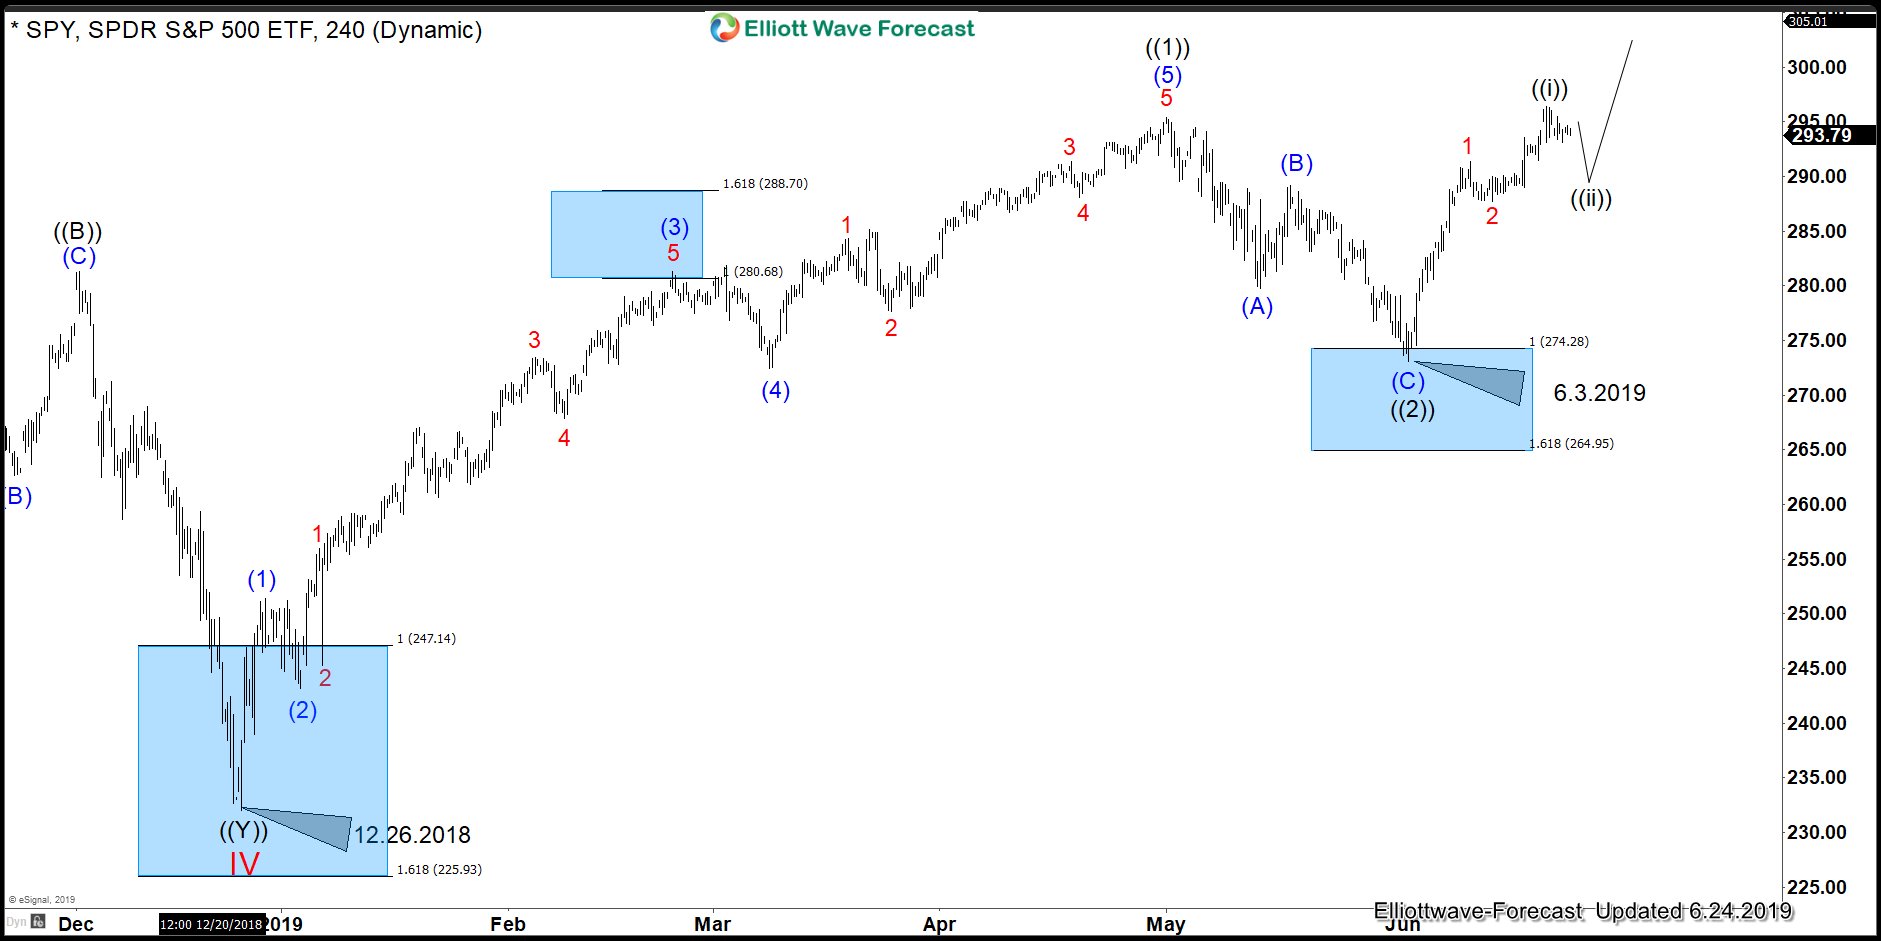
This target is the one making sense because of the lesser degree cycle which started in December 2018. The ETF rallied from there and opened up a bullish sequence targeting the areas of around 335.85+. But due to the fact of an Impulse rally. The ETF needs to make a wave ((4)) and ((5)) after reaching the area which consequently should bring us to the 374.00 area.
The Following chart shows the 4 Hour path and the incomplete bullish sequences.
SPY ETF 4 Hour Elliott Wave Analysis 6.24.2019

To summarize, the SPY should ideally keep on extending higher against its 6.3.2019 lows. Very Technical and well-defined trade which will put the SPY into higher levels which most of the traders are not expecting.
The following video explains the ideas and why we look at the markets in a different way like most of the traders do. But our idea of running the trend and not picking the top together with looking around 100+ instruments across the World allows us to anticipate the Market at a higher ratio.
I hope you liked this blog and I wish you all good trades. And for all who are interested in learning more about our unique blue box areas and also want to trade profitably in 2019 then sign up for a free 14 days trial you can cancel anytime.
Back


