$SPX The Elliott wave Hedging is getting tighter
The market is always a fight between the two sides, Buyer and Sellers. We in www.Elliottwave-forecast.com understand the Market Nature and always recommend trading the no-enemy areas. There are always areas where both sides, Buyers and Sellers agree into a move. We called these no-enemy areas which is also the Hedging areas. Last week, we did a blog calling a decline from the Hedging area.
Now the Index has declined and reached the area where buyers will try to run higher. They need to break the 2717.52 area, otherwise the Bears can run lower into the 2460-2300 area. As we explain at the following video, a pullback from this current area will define the 4 Hour path. We recommend trading the solid lines on our charts. Currently in the short term there are not any Bullish or Bearish sequences. Soon the Market will shown us the path, however waiting sometimes is the best trade and knowing the areas and Market Nature is key.
$SPX video
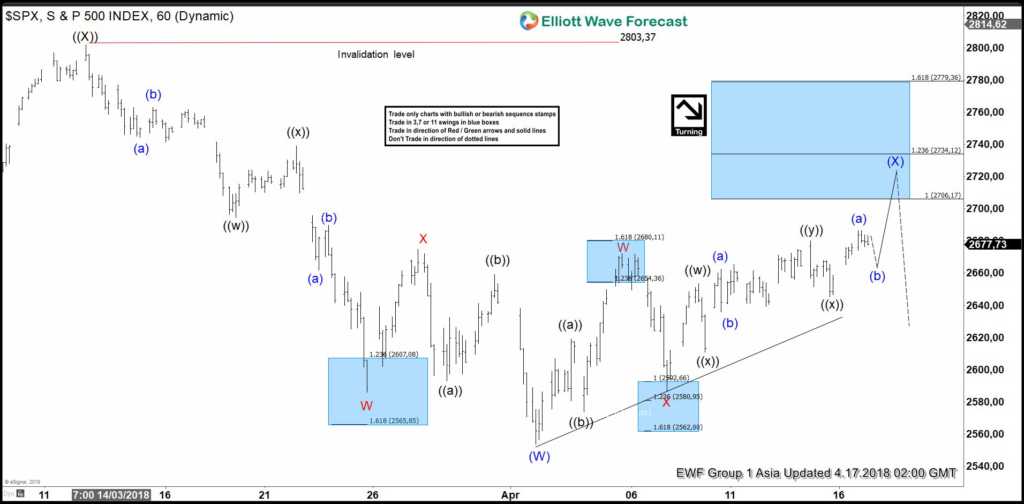
SPX 1 Hour chart 4.17.2018 showing the hedging area
The 1 hour chart update on 4.17.2018 above is calling $SPX to correct cycle from 3.13.2018 high (2801.9) within Intermediate wave (X). Internal of Intermediate wave (X) is unfolding as a double three Elliott wave structure where Minor wave W ended at 2672.07, Minor wave X ended at 2586.27, and Minor wave Y of (X) is expected to complete at the blue box area of 2706.17 – 2734.12. This area is the 100%-123.6% Fibonacci extension of Minor wave W and X, and we call this the hedging (no enemy) area as both buyers and sellers agree that there should be at least a 3 waves pullback from the area
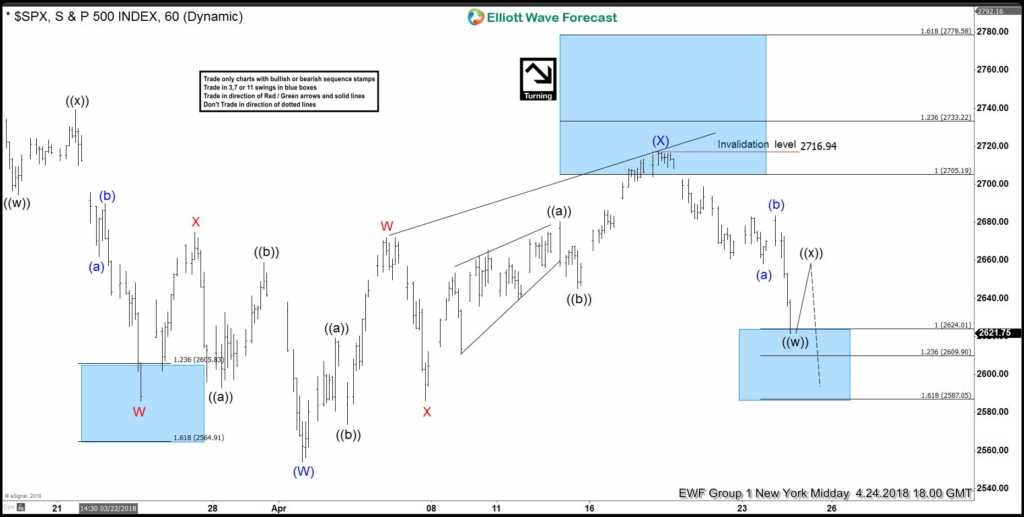
SPX 1 Hour chart 4.24.2018 showing the short term bouncing area
In 1 hour chart update on 4.24.2018 above, $SPX turned lower as expected from the blue box. It ended Intermediate wave (X) at 2716.94 within the no enemy area. The hedging idea suggests that the Index should at least pullback in 3 waves to correct cycle from Intermediate wave (W) low at 4.3.2018. $SPX did decline as expected from the blue box and it has now reached 100% in 3 swing thus Minute wave ((w)) could be ending at 2617.32. The hedging idea again suggests $SPX should at least bounce in 3 waves to correct decline from 2716.94 high to around 2667 – 2679. Then if pivot at 2716.94 high stays intact, the Index could extend lower again.
In higher time frame, $SPX currently does not have any bullish or bearish sequence and it remains sideways between 1.26.2018 high (2872.87) and 2.9.2018 low (2532.69). The Bulls will try to buy it in the area of 2609.9 – 2624.01 and try to push it above 4.18.2018 high (2716.94) while the Bears will try to sell any bounce in 3, 7, 11 swing against 2716.94 high looking for more downside.
We at Elliottwave Forecast is bullish the Indices in the higher degree time frame (daily and weekly) but acknowledge that the path with highest probability is to see Indices correct further and break below February low. However, until $SPX actually breaks below 2.9.2018 low (2532.69), it doesn’t have bearish sequence and thus we don’t recommend selling the Indices.
For further updates in $SPX and other 78 instrument, take 14 days FREE Trial and get access to Elliottwave chart in 4 time frames, live trading room, 24 hour chat room and more
Back


