Video on the SPX & the US Mid-Term Elections
On Tuesday, November 6th, the United States will hold its general elections. According the mass media these mid-term elections are slated to be more than pivotal on multiple fronts. We would also agree with such contention and add that no matter your particular political leaning, the “event”, is shaping up to stir up mass emotional motion just as it did with the last major elections held in 2016. I can still remember the media portrayal of Democratic candidate, Hillary Clinton, as the person to beat and that Republican candidate, Donald Trump, had less than a snowball’s chance in you know where to steal a victory. We all know how all that turned out. Ok so we all know that the elections will “mean” something in one way or the other, but how will it affect our view of the markets?
George Santayana (1863-1952), who, in his Reason in Common Sense, The Life of Reason, Vol.1, wrote “Those who cannot remember the past are condemned to repeat it.” There is some sound wisdom in Mr. Santayana’s quote but I think I’ve always held onto the quote from Mark Twain somewhere that summarizes simply as history may not repeat exactly but does indeed rhyme. If you think about the Elliott wave principle and how its fractal nature relates to market analysis then what I’m about to expound upon will correlate beautifully with both market price action repetition and rhyme. Let’s look at the S&P 500 index around the time of the 2016 elections vs what we’re seeing now just before the 2018 general elections.
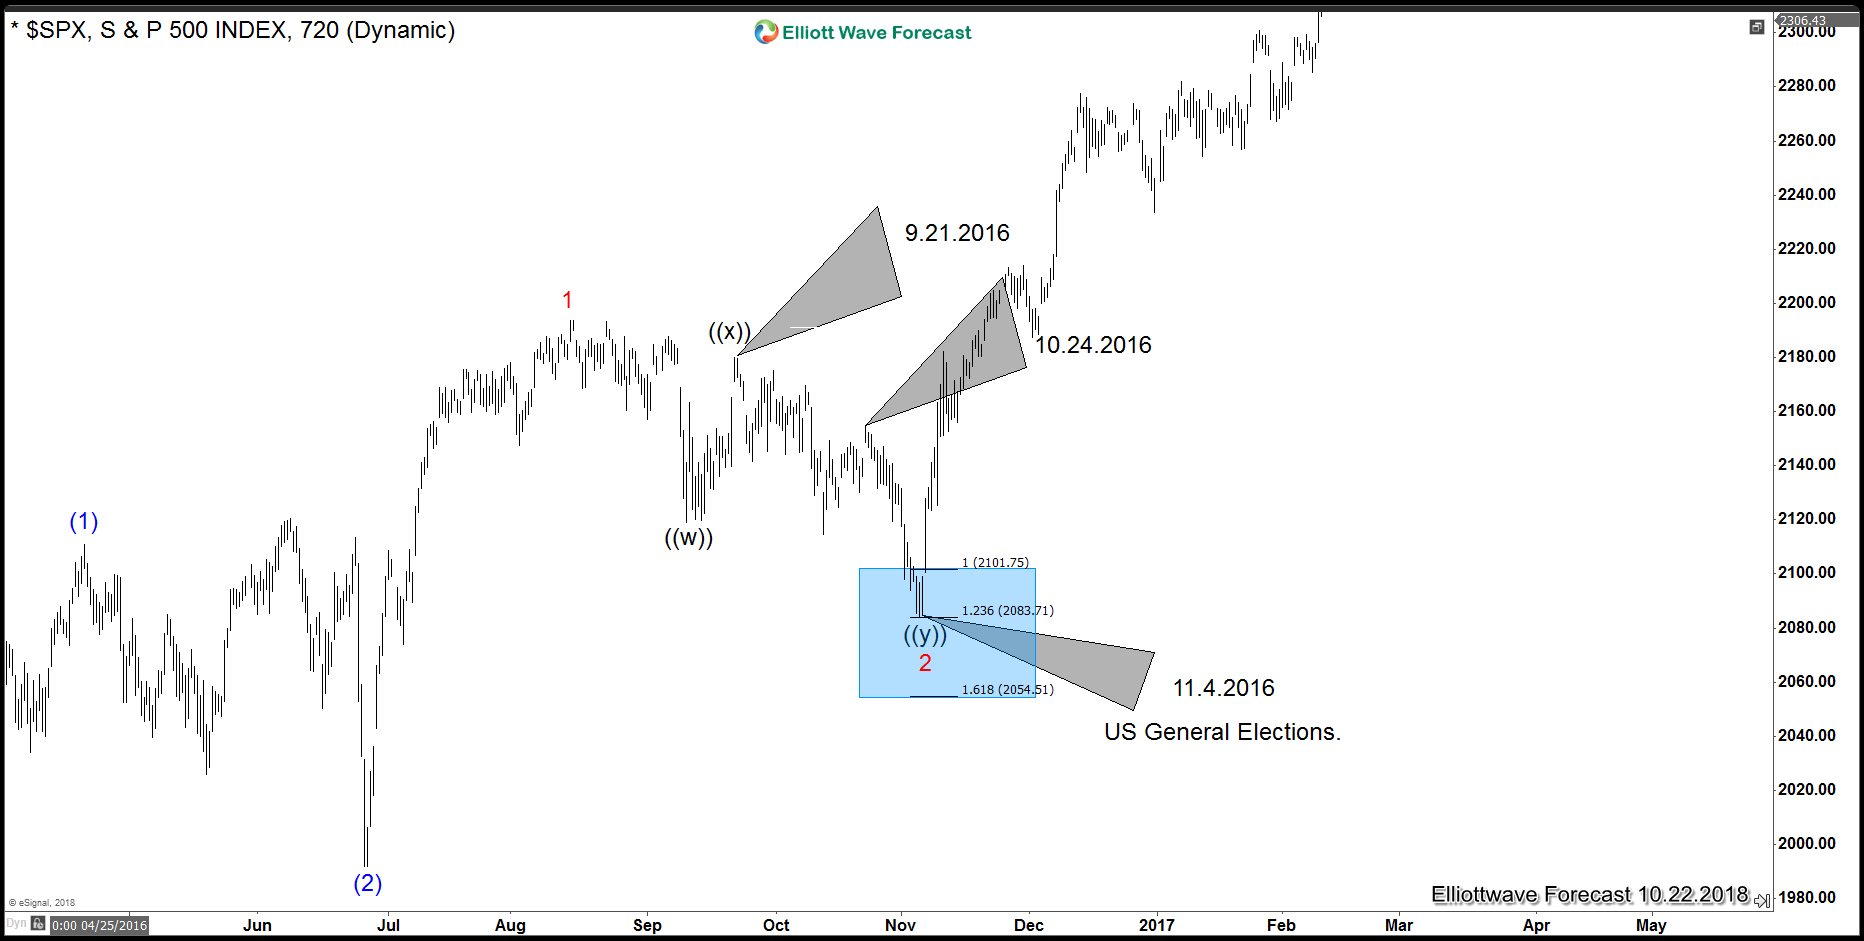
SPX Elliott Wave View during the last half of 2016
The chart above shows price action of the $SPX (S&P 500 Index) during the last half of 2016. The correction down to form the bottom of minor wave 2 (labeled in red) unfolded in a double-three correction. As you can see back then we had a wave move up strongly on 9/21/2016 and peak at the wave labeled ((x)) on September 22, 2016 after having minor wave 1 (in red) peak in late August. What’s interesting about the bottom of minor wave 2 is that it ended within our projected “Blue Box” derived as via equal leg measurements and a Fibonacci extension range of the minute degree wave ((w)) vs minute degree wave ((y)). This was our projection on 11/4/2016, the Friday before the elections held the following Tuesday on 11/8/2016. We had no clue who would win the election when we called for that area to be a bottom and for the way we look at the market it really didn’t matter who would have won as the outcome from our perspective (for the market at least) would have been the same. I distinctly remember the majority of the talking heads claiming Armageddon on the markets night of the election after it was conceded that Trump was going to be our next President, but the market actually went the opposite direction. So what can we learn from the past and apply it to this election cycle? The Blue Wave < EWF’s Blue Boxes > The Red Undertow
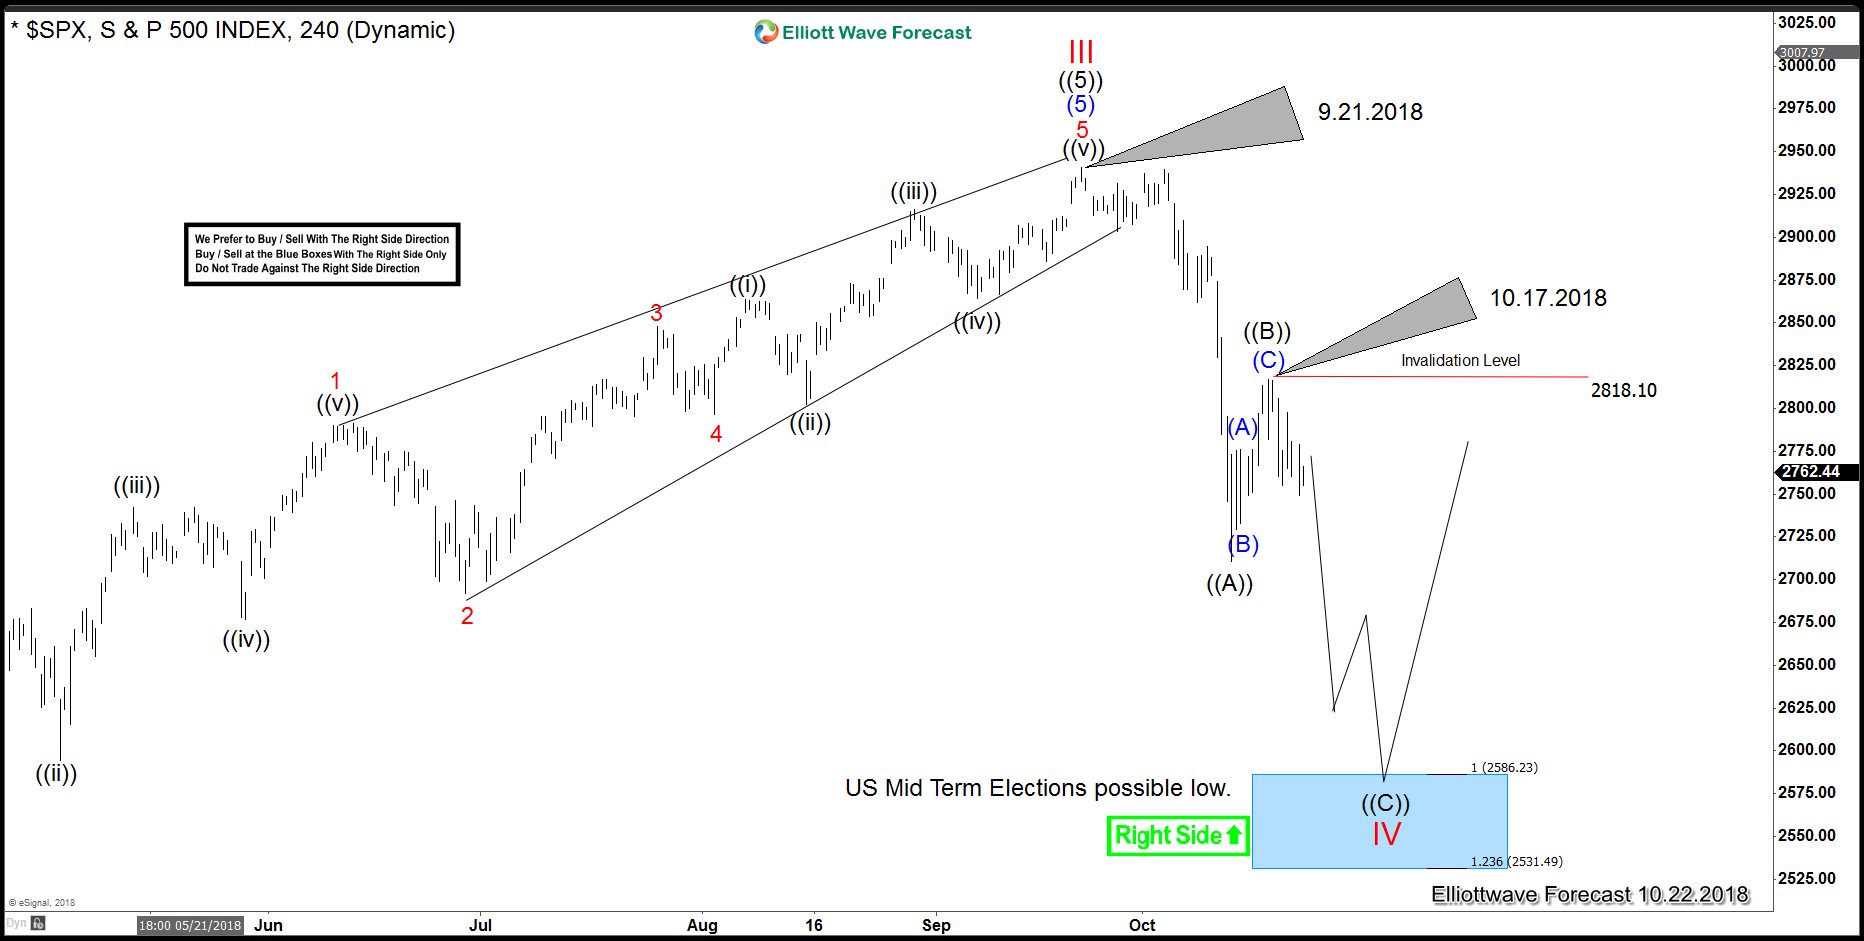
SPX 4-Hour Elliott Wave Analysis 10.22.2018
So here’s where we are today. The chart above is the SPX from late May 2018 to the present day. As you can see we have some “rhyming” going on with what we saw in 2016. On 9/21/2018 the SPX hit an all time high of 2940.91 and since then we’ve seen the first corrective wave labeled primary degree ((A)) in black end on 10/11/2018 after erasing some 230 points of prior gains. We now believe that the secondary top labeled ((B)) is now in place on 10/17/2018 at 2816.94 and are now in the very early stages of the final wave of the correction from 9/21/2018 as wave ((C)). We propose this wave ((C)) to end just before the midterm elections. And, if history proves to repeat itself we would look to the Friday before election day as a target and this time the date is Friday November 2, 2018. It’s Happening Faster This Time.
The major difference between the correction in 2016 vs the proposed correction unfolding now is the aspect of degree and time. In 2016 the correction was of Minor degree and the correction unfolding now is of Cycle degree which is 3 degrees higher on our fractal hierarchal nomenclature scale. In terms of time the Minute degree wave ((w)) in 2016 (first corrective sequence off the examined 2016 highs) took 29 calendar days vs the Primary degree ((A)) (first corrective sequence off 2018 highs) taking 29 calendar days. In 2016 wave ((x)) took 11 calendar days vs the ((B)) of 2018 7 days. So what this is telling us is that the correction is of higher degree, it is stronger, and it is happening faster than what occurred in 2016. If the final wave of the correction in 2016 [ wave ((y)) ] took 13 days to complete then according to the above comparative analysis we should look for the proposed Primary degree wave ((C)) to complete even faster this time around. On average the corrective waves in 2018 took around 70% of the time it took for the corrective waves in 2016. If this average holds true we can look for the current wave C to complete sometime around 10/26/2018 which is 2 Fridays before the general election Tuesday.
Will the cycle and sequence currently unfolding in 2018’s market Repeat the pattern of 2016 or will it just Rhyme? Come take a free look at our service today to learn how we see the market differently and how it can make you a better trader or investor over time.
Back


