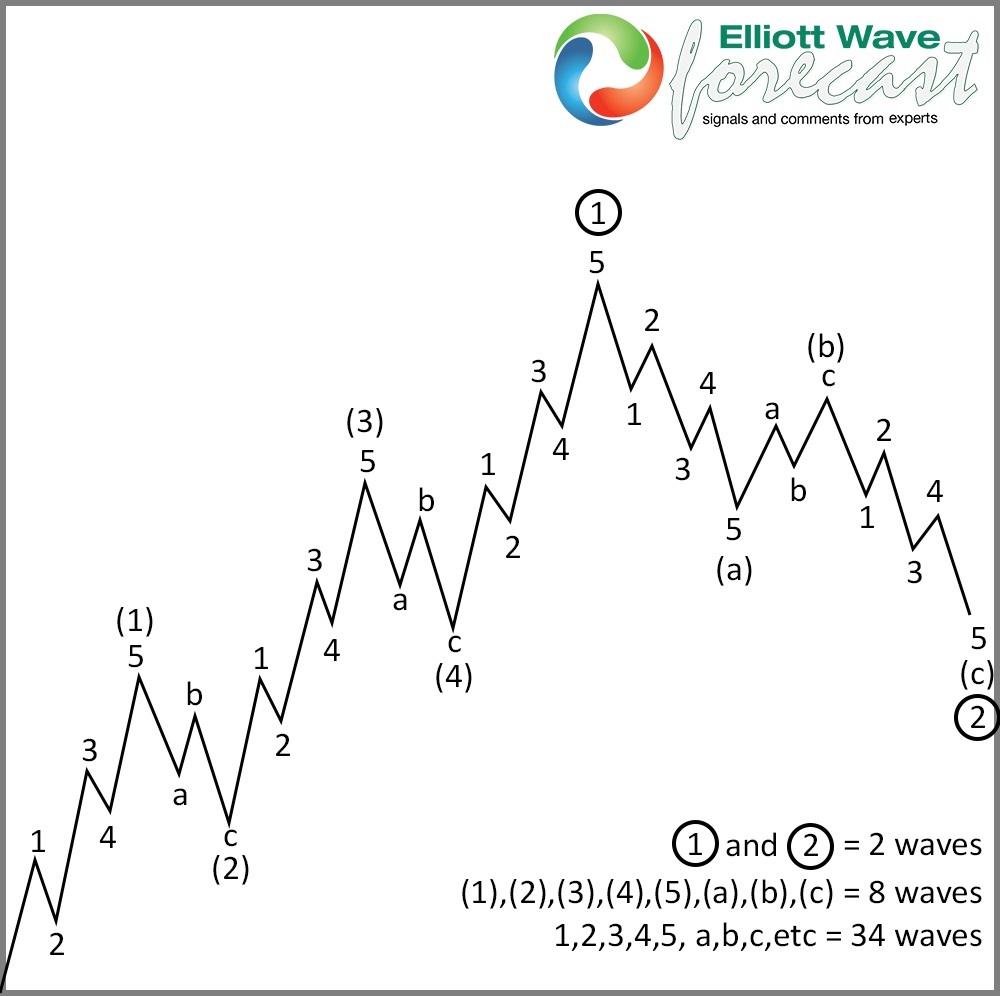
The Elliott Wave Theory states that after a five waves move, there will be a three waves correction in the opposite direction of the five waves. After the 3 waves correction, there should be an extension (either upside/downside) in the same direction of the previous five waves move. The chart below illustrates the 5 waves move and 3 waves correction
One Market Concept
Elliott Wave Theory in its original form is not enough. One of the issues with Elliott Wave is the multiple interpretations of the market. For every Elliott Wave view, there’s at least 1 alternative view. At Elliottwave-Forecast.com, we have added many tools to better identify the best Elliott Wave view out of several competing alternatives. One of the tools we use is the One Market Concept which states that instrument within the same group trade in similar cycles. Thus, if we can identify a clear Elliott Wave structure in one instrument within the same group, then we can use the knowledge from that instrument to support or deny Elliott Wave view of other instrument within the same group.
As an example how there could be various interpretations using Elliott Wave, consider what we said earlier that five waves advance can be part of a new impulsive trend. However, it’s not always the case that a five waves advance will get another extension in the direction of that five waves. The reason is because a five waves advance can also be part of a C wave flat structure, which is a corrective pattern. So how do we know when we see a five waves advance whether it’s part of a new impulsive trend or part of a C wave flat structure? We will use Platinum to illustrate this different interpretations.
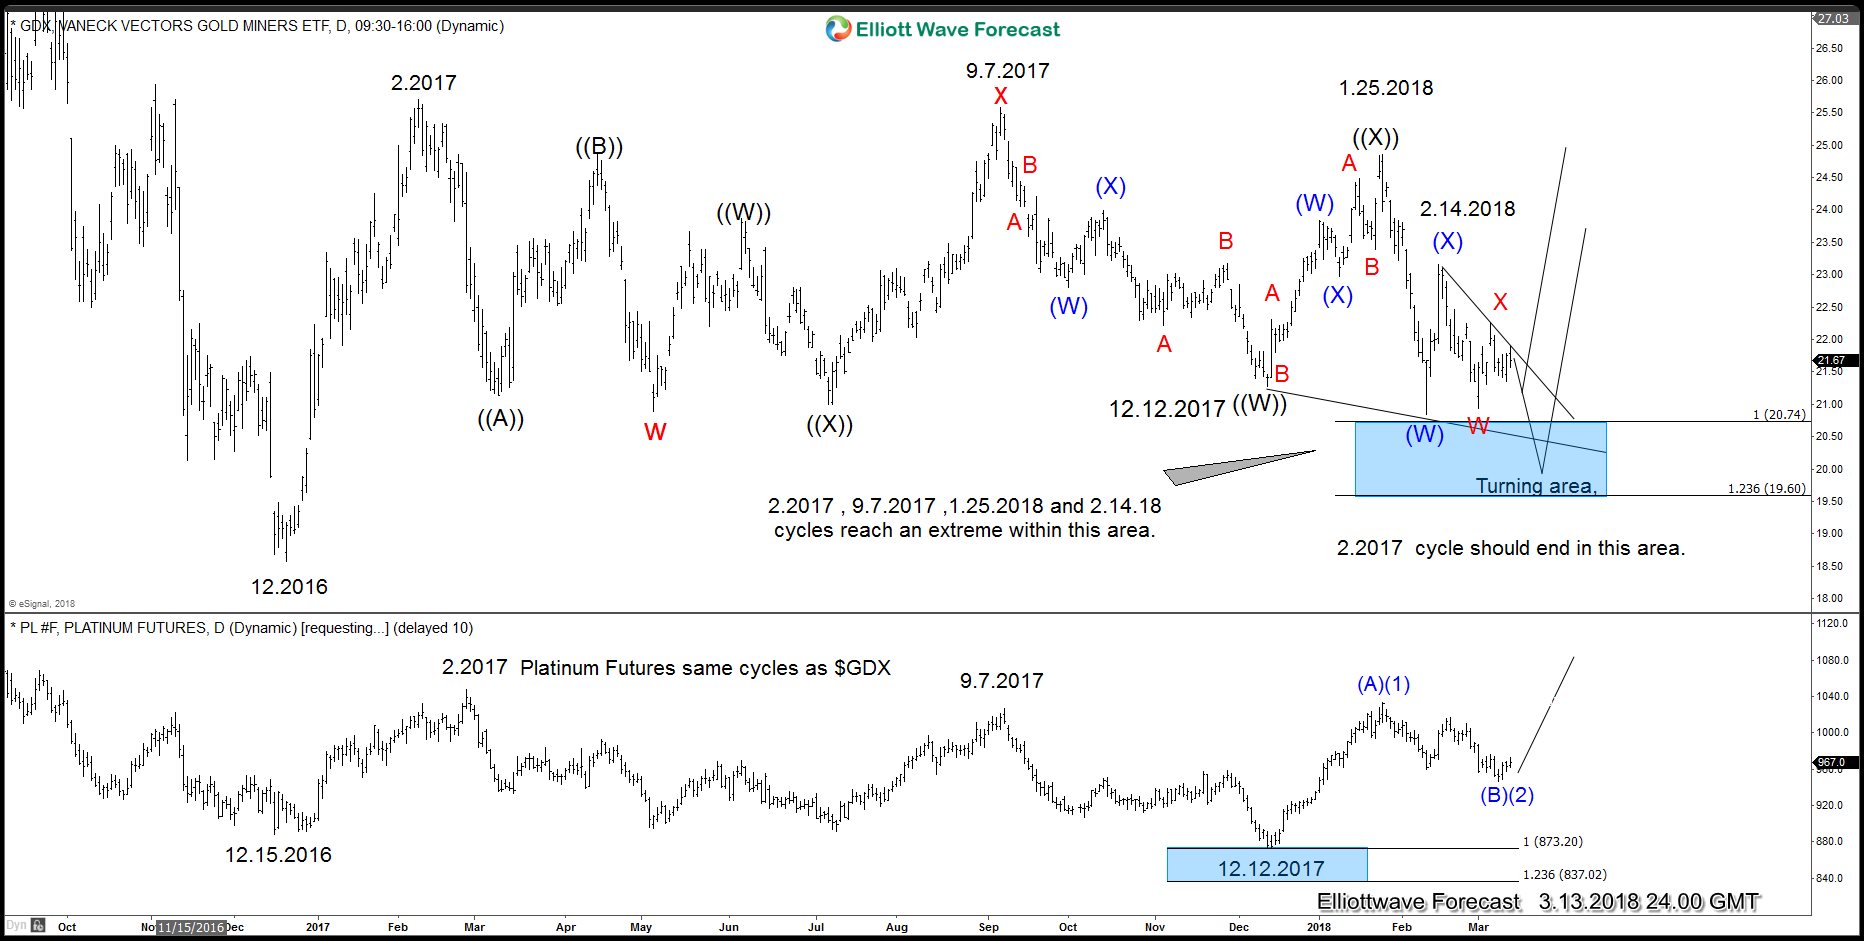
Overlay of $GDX (Gold Miners ETF) daily chart and Platinum (PA_F)

From the chart above, it’s easy to see how both instrument rallied together from December of 2016 up to February of 2017. Afterwards, both instrument started a downtrend cycle which in the case of Platinum made a new low and reached the blue box. On the other hand, $GDX has not reached the blue box area from the peak in February 2017. That blue box in the $GDX will be an area where buyers will appear and the instrument should be rallying at least in three waves.
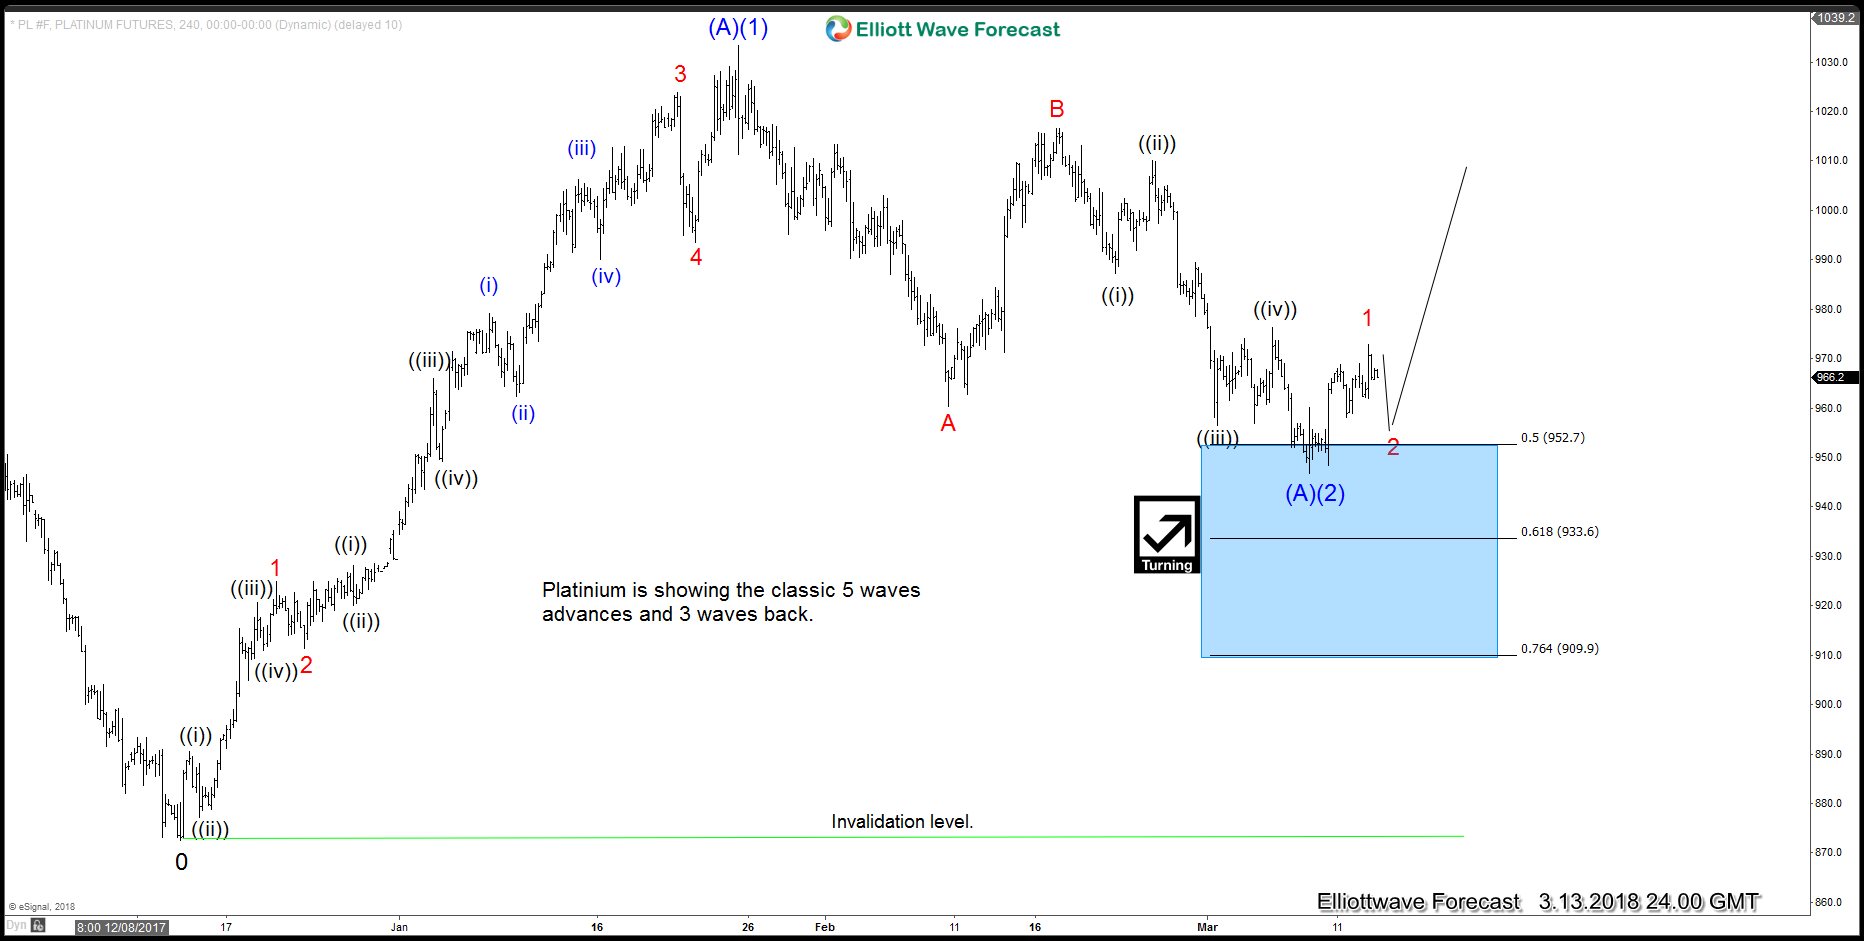
We can come up with two different Elliott Wave views in Platinum. Firstly, if we want to be bullish, we can consider the December 12,2017 low as a beginning of a new trend due to the five waves move up from there. The chart below shows the five waves move from December 12, 2017, which we label as 0. However, like we previously said, five waves move can also be part of a flat. So if we want to be bearish, we can label a corrective flat structure from the lows of December 2016 and the 5 waves move higher from December 12, 2017 low therefore is a wave C of Flat.

Now as you can see the Elliott Wave Theory leaves traders with a 50/50 proposition which is not good enough to make money in trading. However, the idea that $GDX still needs to bounce from the blue box suggests a strong support not just for $GDX but also for all related instruments like gold, silver, platinum, and palladium. This understanding of One Market Concept puts the balance in favor of the five waves move as a new trend in Platinum. The rally from December 12, 2017 low then is likely a beginning of a new cycle and at least another leg higher should happen based on the One Market Concept added to the Elliott Wave Theory. We do things differently at Elliottwave-forecast.com. We do not rely only in the Elliott wave theory, but we have other tools in place to be able to select one Elliott Wave view over the other alternative by using the One Market Only concept.


