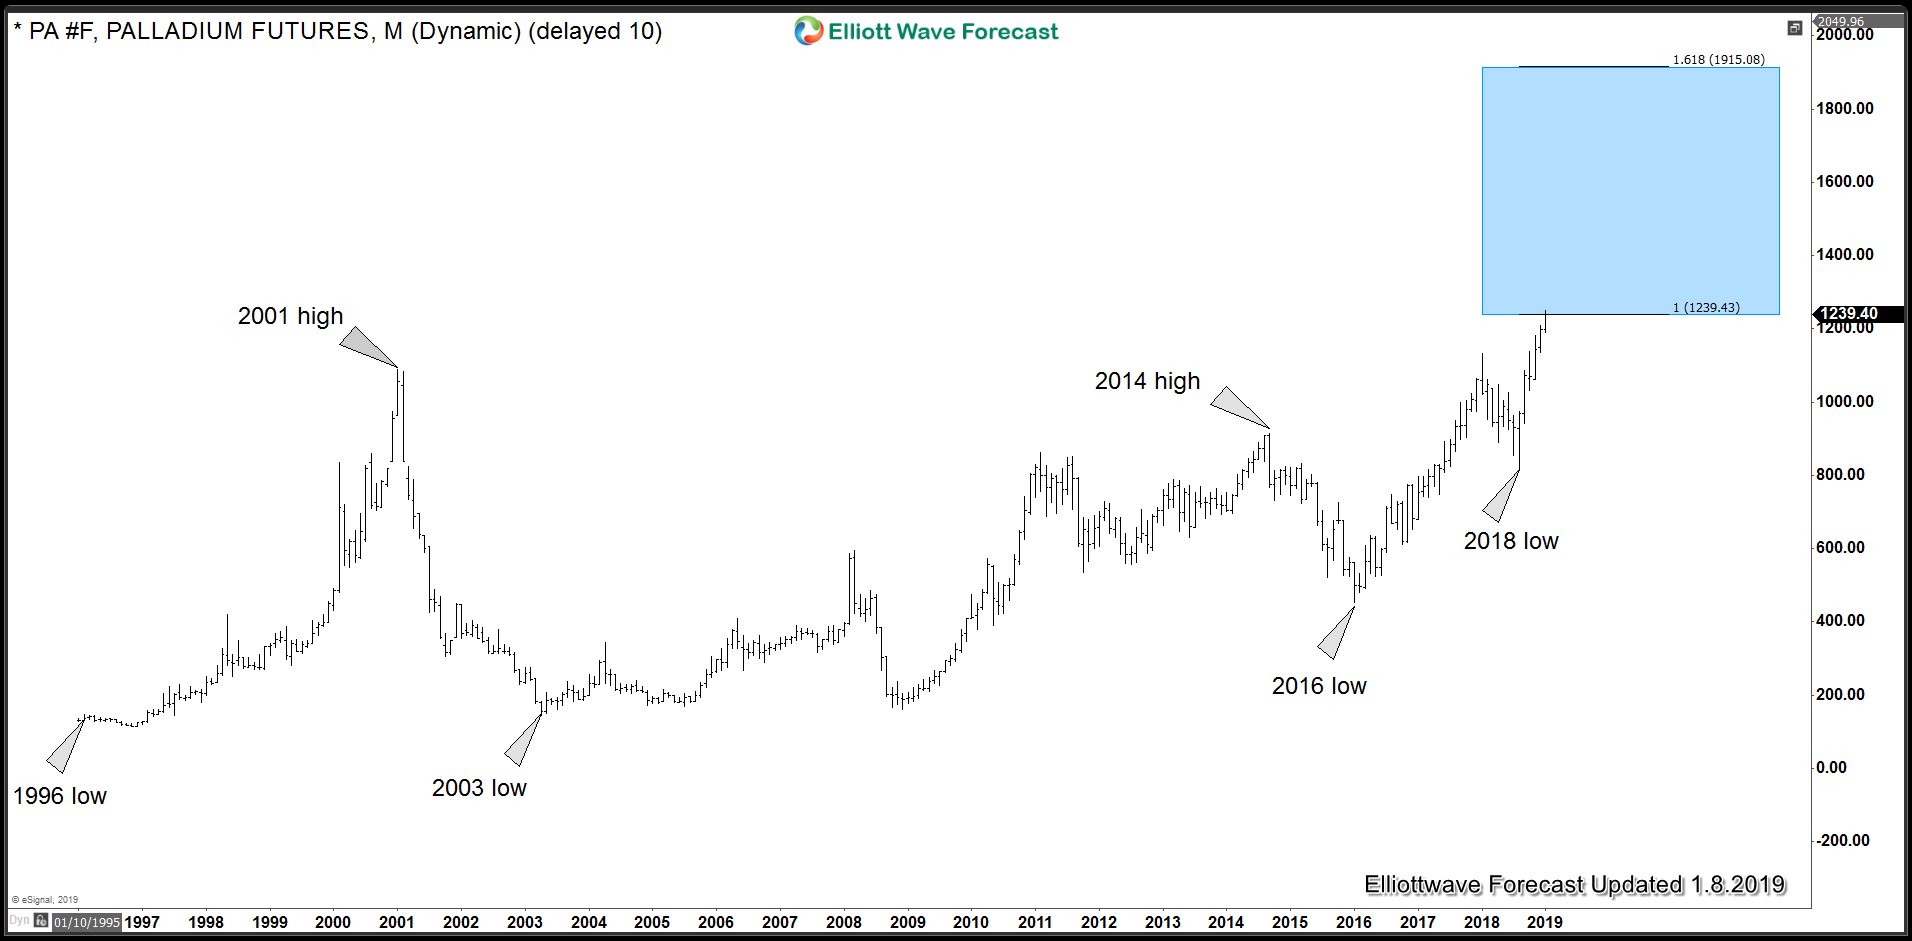
Palladium reached a high of $1249.40 today. It is already up 53% since August 2018 but has now reached 100% Fibonacci extension from the all time low. It has also reached 100% Fibonacci extension up from 2003 low which means we have now entered the area where cycle from 2003 and all time low can end. However, it’s a big area and runs from $1239.49 – $1915.08. Buyers need to be cautious of profit taking in the blue box which can produce a pull back, therefore, chasing longs at current level is risky.
Palladium Cycle from 1996 and 2003 low
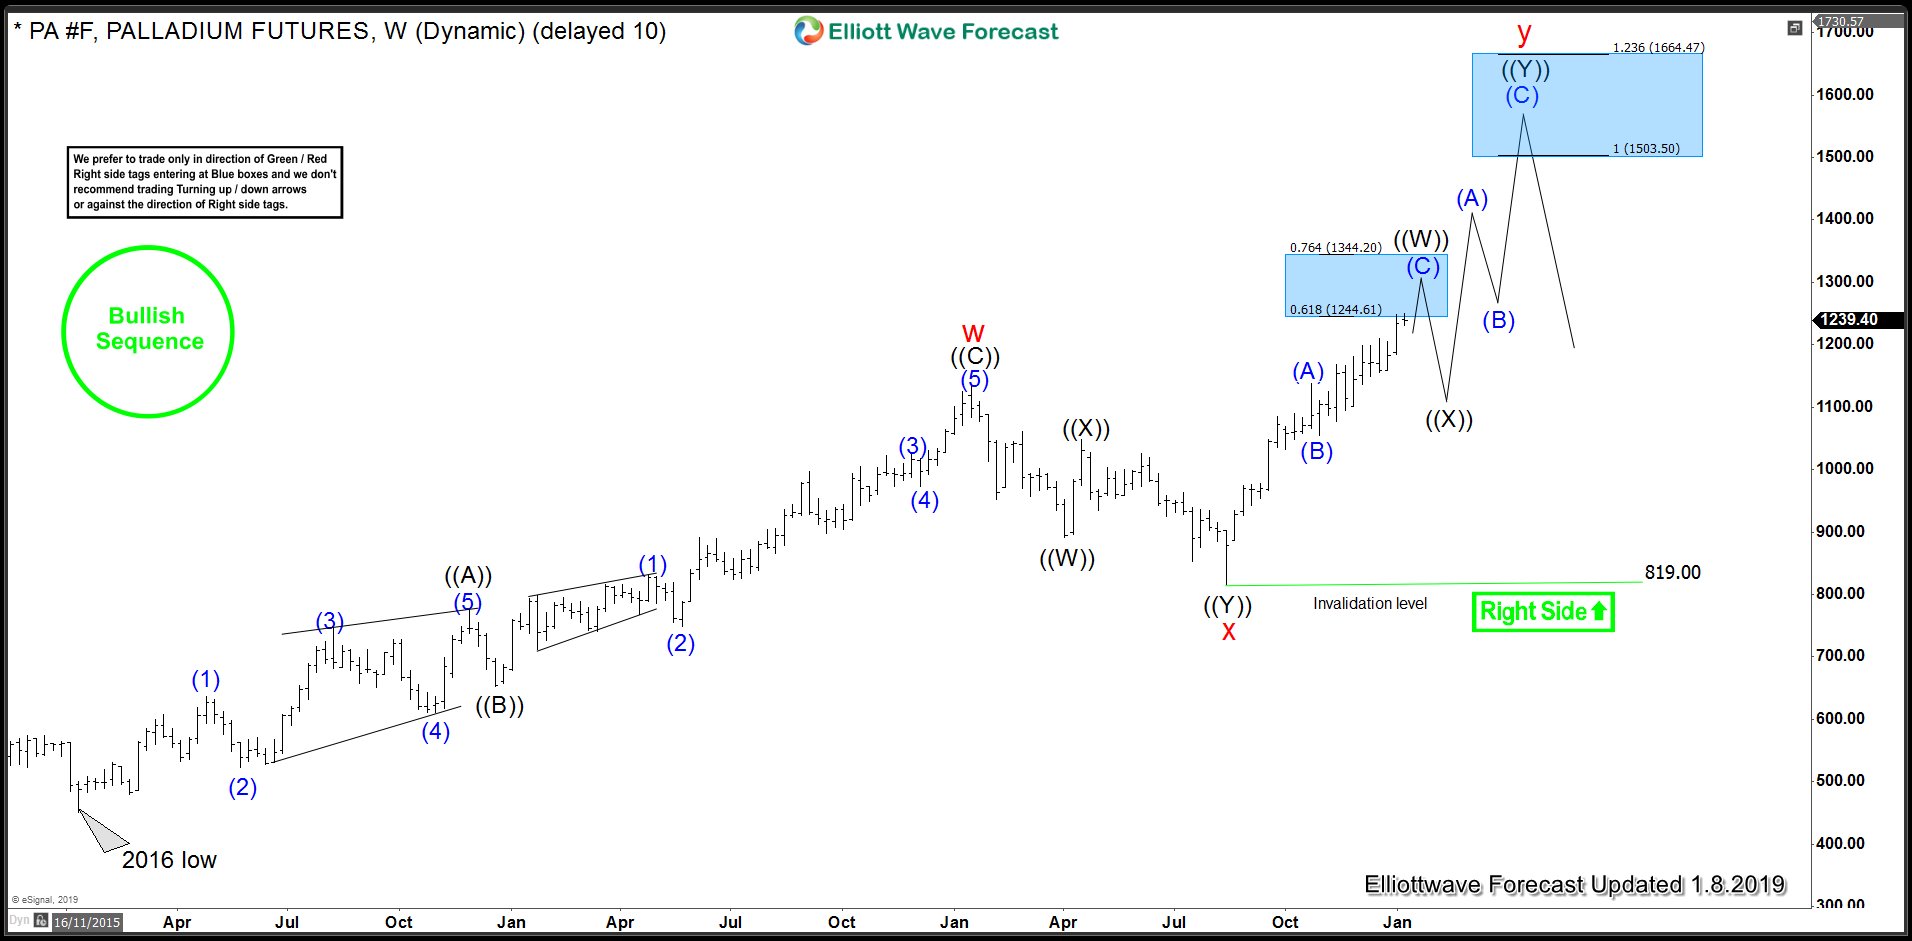
PA_F Elliott Wave Analysis since 2016 low
Elliott Wave Analysis suggests, rally from 2016 low to 2018 high unfolded as an Elliott wave zig-zag structure and completed wave “w”. This was followed by a pull back which took the form of a double three Elliott wave structure and ended at $819. Back in June 2018, we highlighted this pull back as a buying opportunity in Palladium. Pull back did find buyers as expected and we have already seen a new high above January 2018 peak. Now we are at 0.618 – 0.764 Fibonacci extension area of red “w” and “x” cycles.
This is the area where typically 1st leg of “y” leg ends in a double three Elliott wave structure. Area between $1244 – $1344.20 is expected to end the cycle from August 2018 low. It should produce a pull back in Palladium and then result in more upside toward $1503 – $1664 area to end 7 swings Elliott wave sequence from 2016 low. As we are already at 100% Fibonacci extension from 1996 and 2003 lows, it’s risky chasing longs in the short-term. Our strategy would be to wait for wave (( X )) pull back to take place. After wave (( X )) pull back has materialised, we expect buyers to appear again and take prices higher toward $1503 – $1664 area.


