How Bullish is the US Dollar?
The strength in US Dollar (DXY) in the past two months prompts the question: Has US Dollar resumed the bullish trend? In this video and analysis below, we explain and rank the most likely path in the DXY. We use the $USDPLN (Poland Zloty) to explain the most likable path:
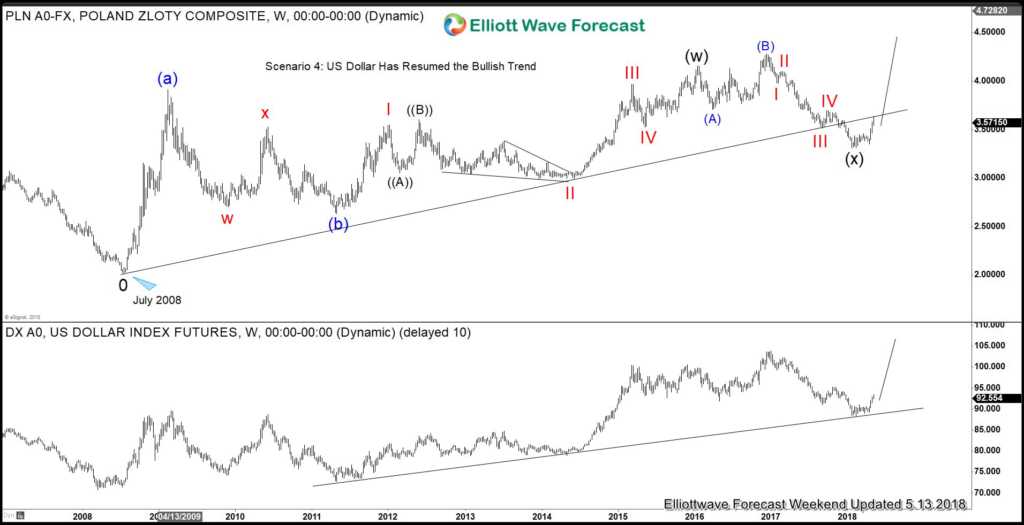
USDPLN broke the 2008 channel support
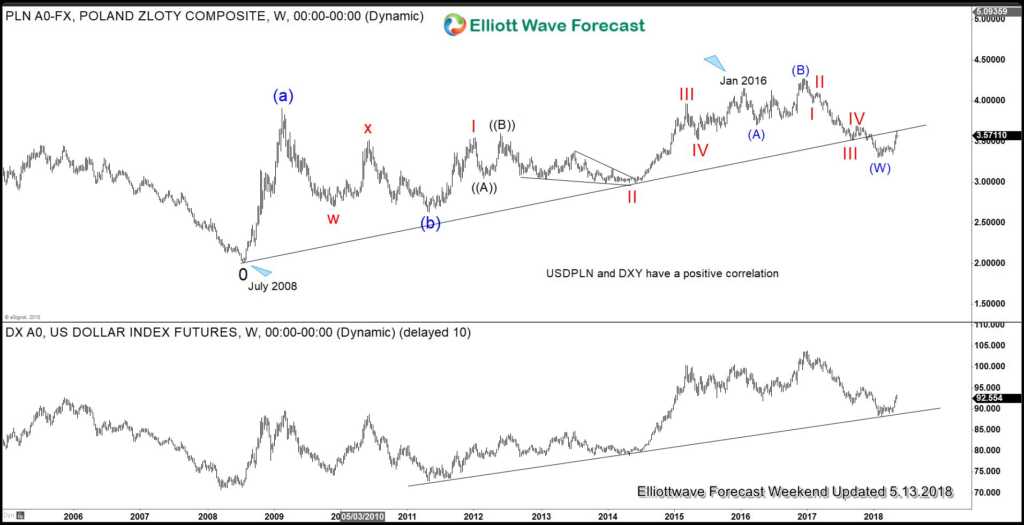
We start our analysis by looking at USDPLN and notice that it’s correlated very well with DXY. We also notice that USDPLN broke below a 10 year channel from July 2008 low. This fact gives a higher probability that USDPLN could see at least another leg lower. It has rallied in the past two months to retest the broken channel and looks to be rejected last week. If USDPLN resumes lower, then we could conclude the DXY should do the same because of the positive correlation. The break below 2008 channel then favors the idea of further downside in USDPLN and DXY.
15 year Dollar Cycle Chart
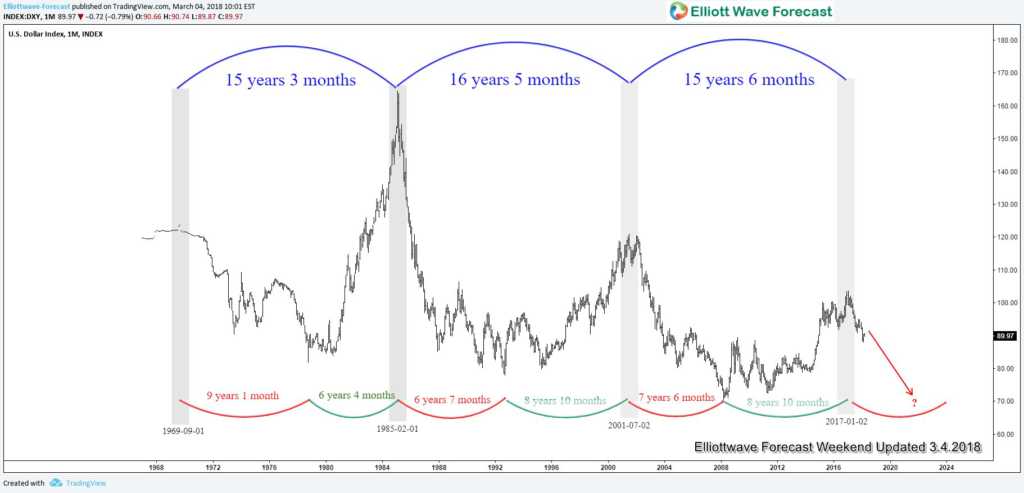
We also look at the 15 year cycle in US Dollar in explaining the likely path in DXY. We wrote about 15 year Dollar cycle in our previous article. US Dollar may have ended the last 15 year peak in year 2017. If this interpretation is correct, this suggests that US Dollar could see a multi-year decline to year 2024 – 2025, thus favoring further downside in US Dollar.
Scenario 1: A double correction before US Dollar Resumes Weakness
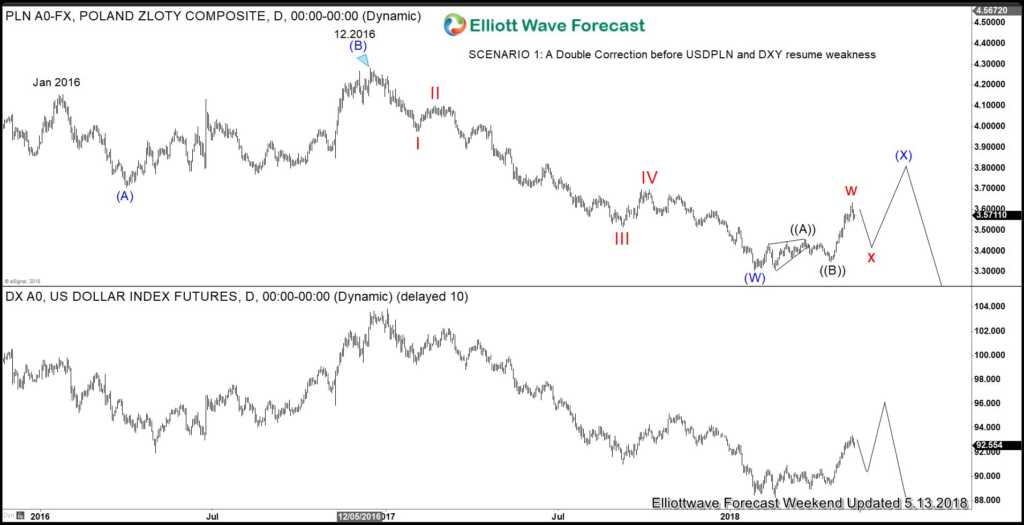
In the first scenario, USDPLN and DXY have ended cycle from 1/26/2018 low as Cycle degree wave “w”. In the next few weeks, we should see a bigger pullback in cycle degree wave “x” in 3, 7, or 11 swing to correct the rally from 1/26/2018 low. Afterwards, they will do another leg higher in Cycle degree wave “y” of (x) before US Dollar weakness resumes.
Scenario 2: US Dollar Correction is Over and It Can Resume Weakness
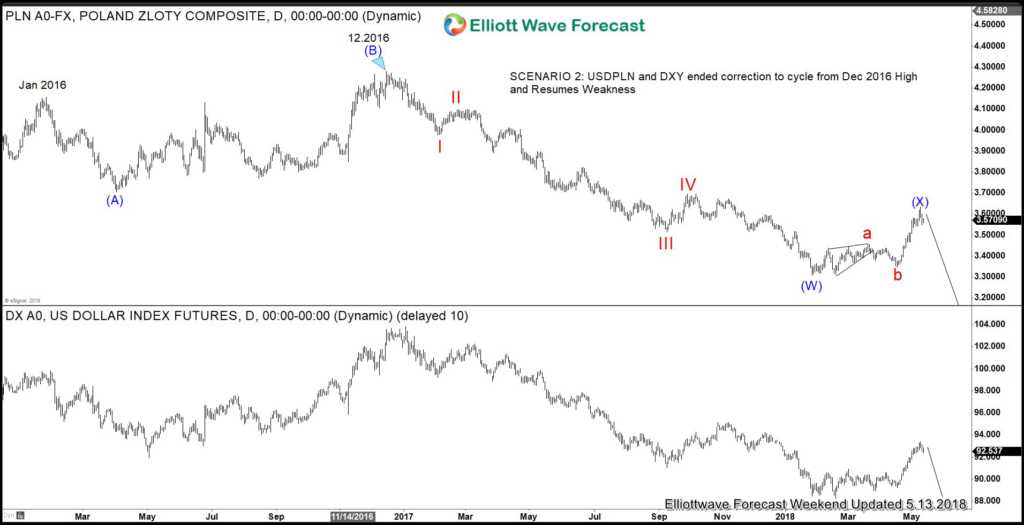
In the second scenario, the rally in past two months ended correction to the cycle from December 2016 high. In this case, USDPLN ended Super Cycle wave (x) bounce at 3.633 on May 9, and will resume weaknesses to new low while bounce stays below there. US Dollar (DXY) should follow along accordingly and resume weakness to new low due to the positive correlation.
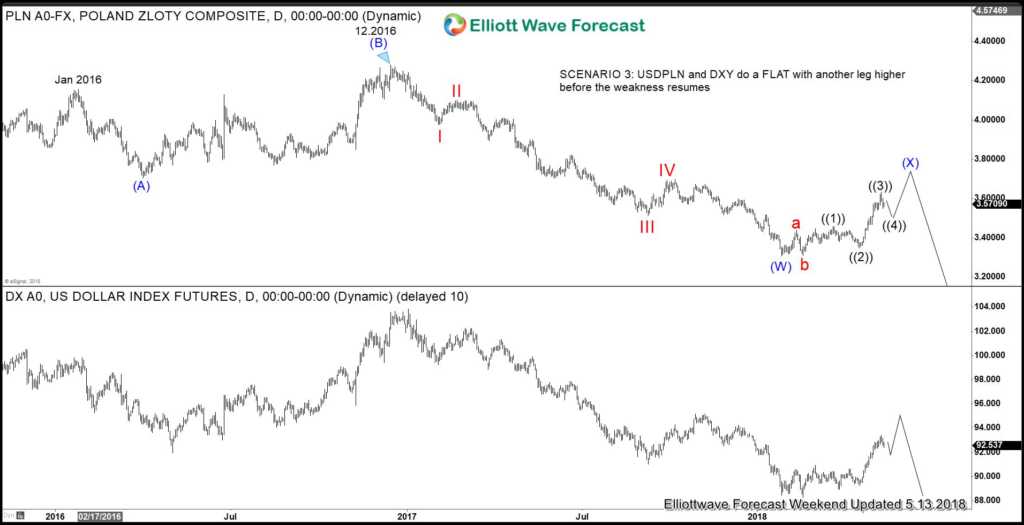
Scenario 3: USDPLN and DXY do a FLAT with Another Leg Higher before Weakness Resumes
In Scenario 3, USDPLN and Dollar Index (DXY) are still correcting cycle from December 2016 high in the form of Flat Elliott Wave structure. In this case, we could see another push higher to end the Flat structure before USDPLN and DXY resume weakness to new low or at least pullback in 3 waves.
Scenario 4: US Dollar Has Resumed the Bullish Trend
We think that scenario 4 is the least likely scenario based on two considerations:
- USDPLN broke below 2008 channel support, favoring further downside
- US Dollar can be ending 15 year cycle peak in year 2017
In Scenario 4, USDPLN and US Dollar (DXY) resume the bullish trend and go to new high.
If you enjoy this analysis, welcome to check our work and join Free 14 days Trial to get access to Elliott Wave Forecast for 78 instrument, Live Trading Room, Live Session, and more.
Back
