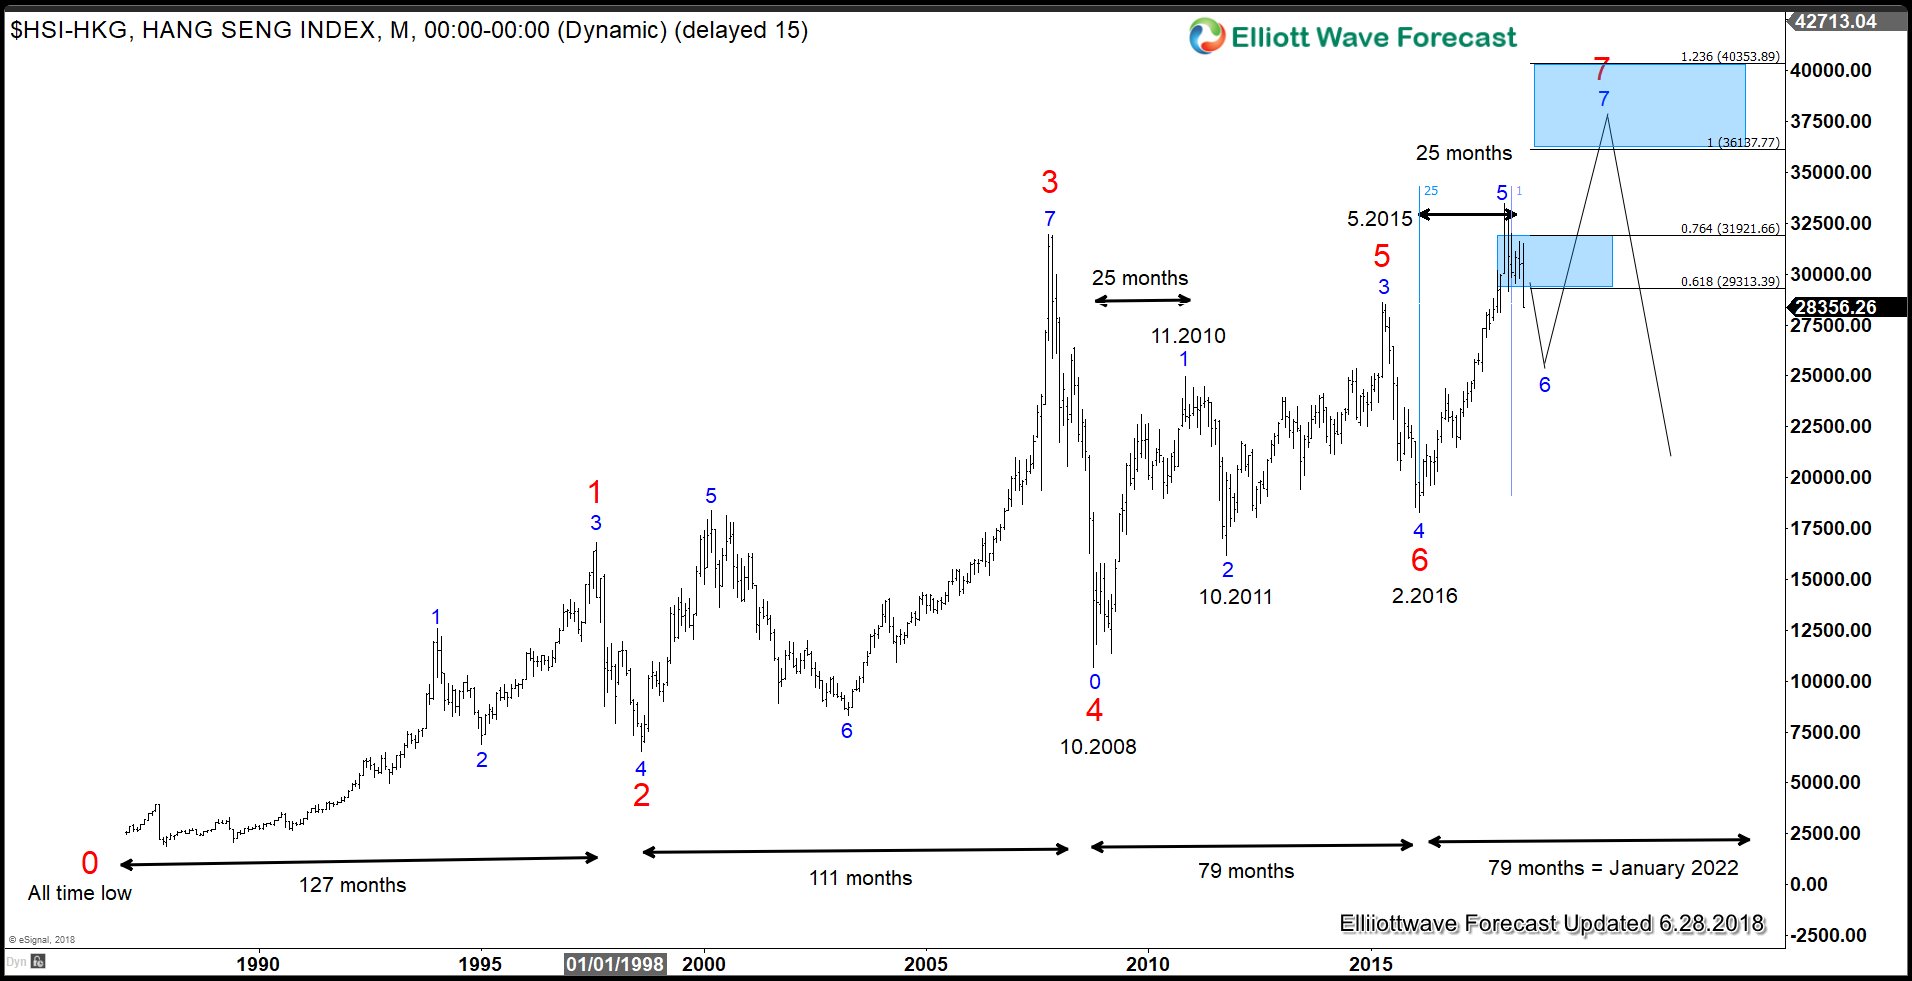
In the video below, we take a look and explain the timing cycle of Hang Seng Index from Hong Kong to figure out whether stock market has put in a major top. Hang Seng Index is one of the clearest structures in the market that we can study to learn about the potential duration and degree of the correction in the world indices. Since Hang Seng Index has a good correlation with other major world indices, it’s helpful to properly understand Hang Seng to establish the current state of world Indices
Hang Seng Cycle Analysis Video
Hang Seng Long Term Cycle Analysis
There are two important cycles and sequences in Hang Seng Index. The first cycle starts from all-time low, denoted in red label, and shows the Index has a 5 swing sequence of higher high. The second cycle starts from 10.2008 low, denoted in blue label, also shows a 5 swing sequence of higher high. A 5 swing sequence is a bullish sequence, suggesting it is incomplete structure within a 7 swing double three (WXY) Elliott Wave structure. Please note this swing count does not refer to a 5 waves impulse Elliott Wave.
Within the cycle from 10.2008 low, we are now in the sixth swing (denoted in blue label) to correct cycle from 2.2016 low. Note that the Index has a nice price and timing symmetry. The move from 0 (10.2008 low) to 1 (11.2010) took 25 months. The same 25 months period happened in the move from 4 (2.2016 low) to 5 (1.2018 high). If the pattern repeats, then the move from 5 to 6 should take the same length of time from 1 to 2 or around 1 year. In other words, the current correction could last until the end of the year or early next year but that’s only if move from 5 to 6 takes the same length of time from 1 to 2 and it doesn’t have to.
If Hang Seng follows this pattern and the correlation to other world Indices remains positive, there’s a possibility that we could see correction in world Indices in the second half of the year. However, looking at the longer term, the sequence remains bullish. World Indices should continue to be supported against 2016 low for more upside.
Market has finally started to move. If you’d like to take advantage of the volatility, join us as a member. Take the 14 days FREE trial and get access to Elliott Wave charts in 4 time frames, live trading room, live session, and more. Click here to start your trial –> 14 days FREE trial
Back


