Gold to Silver ratio looks to have ended cycle from 7/4/2016 low (64.38) and should turn lower at least in 3 waves to correct cycle from 7/4/2016 low. The video below explains what the expected turn lower in the ratio means to Gold and Silver:
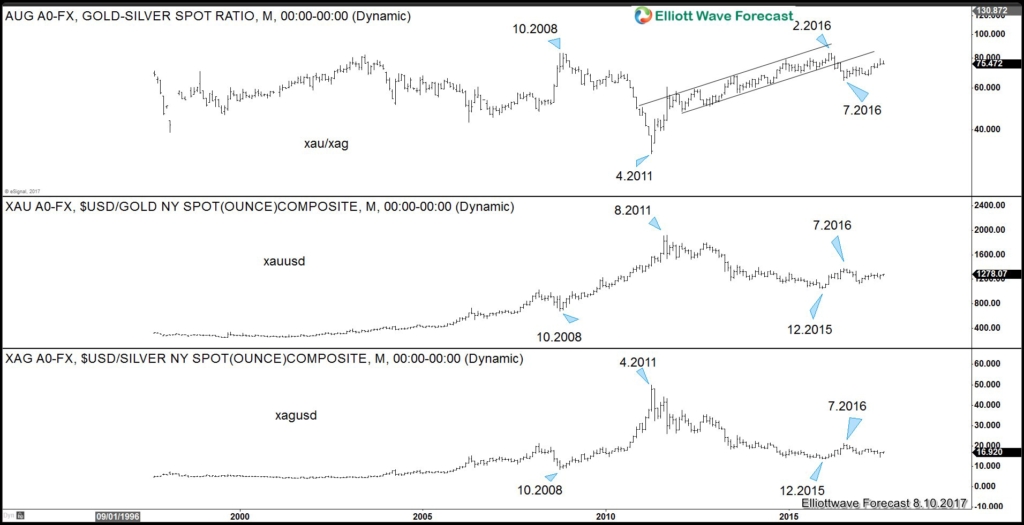
Gold to Silver Ratio Correlation Chart
Overlay of Gold-to-Silver ratio chart together with Gold (XAUUSD) and Silver (XAGUSD) chart above shows an inverse correlation. When the ratio fell down such as in the period between 10.2008 – 4.2011, both Gold and Silver price rallied. Conversely, when the ratio rallied like in the period between 4.2011 – 2.2016, both Gold and Silver price fell down. A case can be made that we could see the ratio falls again after breaking below the ascending channel, and this should support both Gold and Silver in coming months.
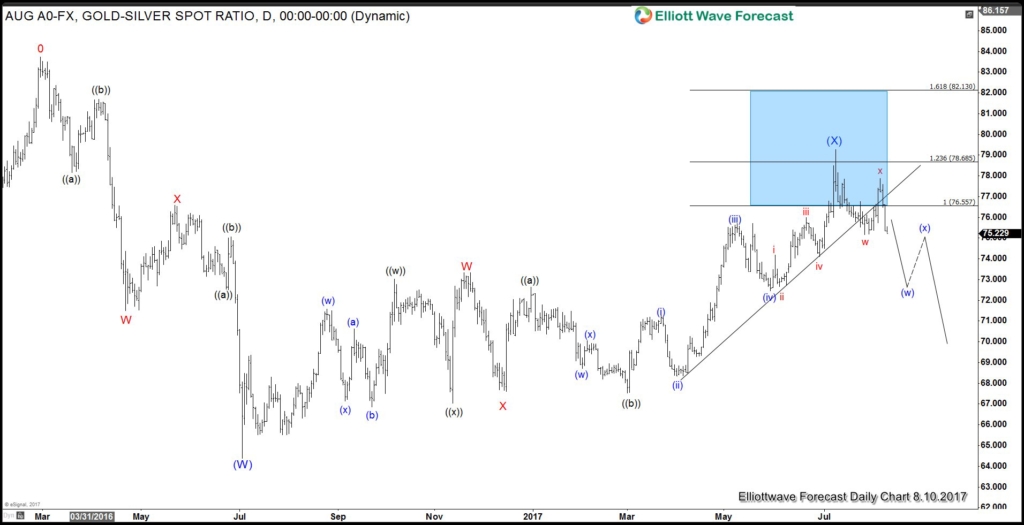
Gold to Silver Ratio Daily Chart
Gold-to-Silver ratio is correcting cycle from 2/29/2016 peak (83.68) and looks to have ended with wave (X) at 79.257. While bounces stay below there, expect the ratio to move lower to at least correct cycle from 2/29/2016 low in larger 3 waves if not resuming the decline from 2/29/2016 peak. Expect both Gold and Silver to be supported in coming months when the ratio finally turns lower.
If you like this analysis, take our 14 days FREE trial by clicking here –> risk free trial and see the next path for XAUUSD, XAGUSD, and other instrument in 4 time frames, live session, live trading room, 24 hour chat room, and much more.
Back


