In the video below, we provide an update of the Elliott Wave view on Gold-to-Silver ratio and show how the ratio is close to turning which can soon result in Gold and Silver getting support and turn higher
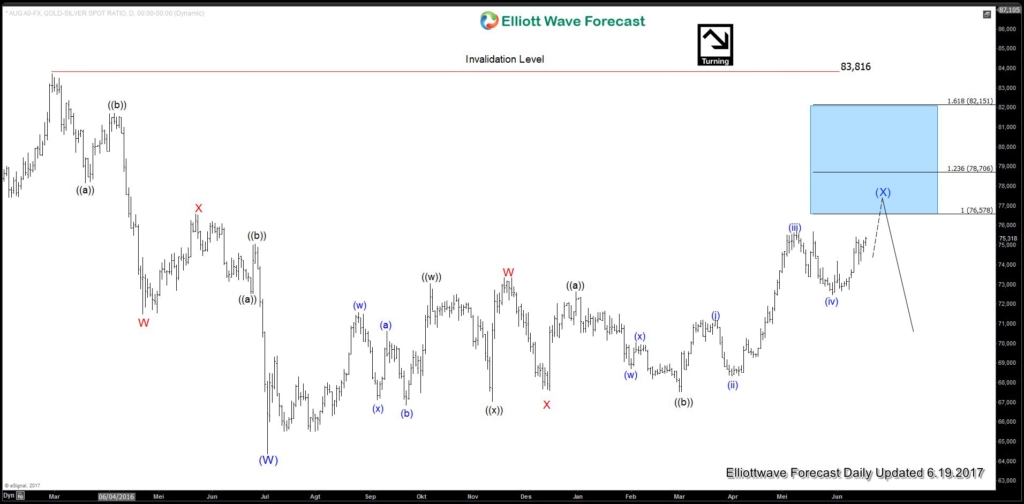
Gold-to-Silver Ratio Daily Chart
Gold-to-Silver ratio is correcting cycle from 2/29/2016 peak (83.68) in 7 swing. While the bounces fail below 83.68 high, the ratio should resume lower or at least pullback in 3 waves. Down from 2/29/2016 peak, Intermediate wave (W) ended at 64.38. Intermediate wave (X) is in progress to correct cycle from 2/29/2016 towards 76.58 – 78.7 area before the Ratio turns lower. Short term, while the Ratio stays above 72.46, it should continue higher towards the target above before 3 waves pullback at least.
With the Ratio hovering near the high end of the range, the next leg in the instrument is likely lower after the bounce ends. The Ratio is inversely correlated with the underlying physical metals. This means when the Ratio hits the target and turns lower, Gold and Silver should be supported. Thus, as the Ratio reaches the target of 76.55 – 78.68 and turns lower, both metals can start rallying also.
If you like this analysis, take our 14 days FREE trial by clicking here –> risk free trial and see the next path for XAUUSD, XAGUSD, and other instrument in 4 time frames, live session, live trading room, 24 hour chat room, and much more.
Back

