Gold-to-Silver Ratio (AUG) is a ratio of the underlying metals (i.e. Gold and Silver). The ratio is simply calculated by dividing Gold price and Silver price, thus the name Gold to Silver ratio. Since the 1970s, after the gold standard was abandoned, the long-run average gold-to-silver ratio is around 65:1. Over the past 50 years, the average has been slightly over 60:1. The current ratio is above 80, which is at the higher end side. Historically, the ratio has hovered around 15:1 during periods when it was fixed by the governments, such as in ancient Rome and medieval Europe.
The ratio can indicate the future direction of the underlying metals. When the ratio is going higher, it indicates the price of Gold and Silver going down and vice versa. In the chart and video below, we will try to see the long term outlook of this ratio.
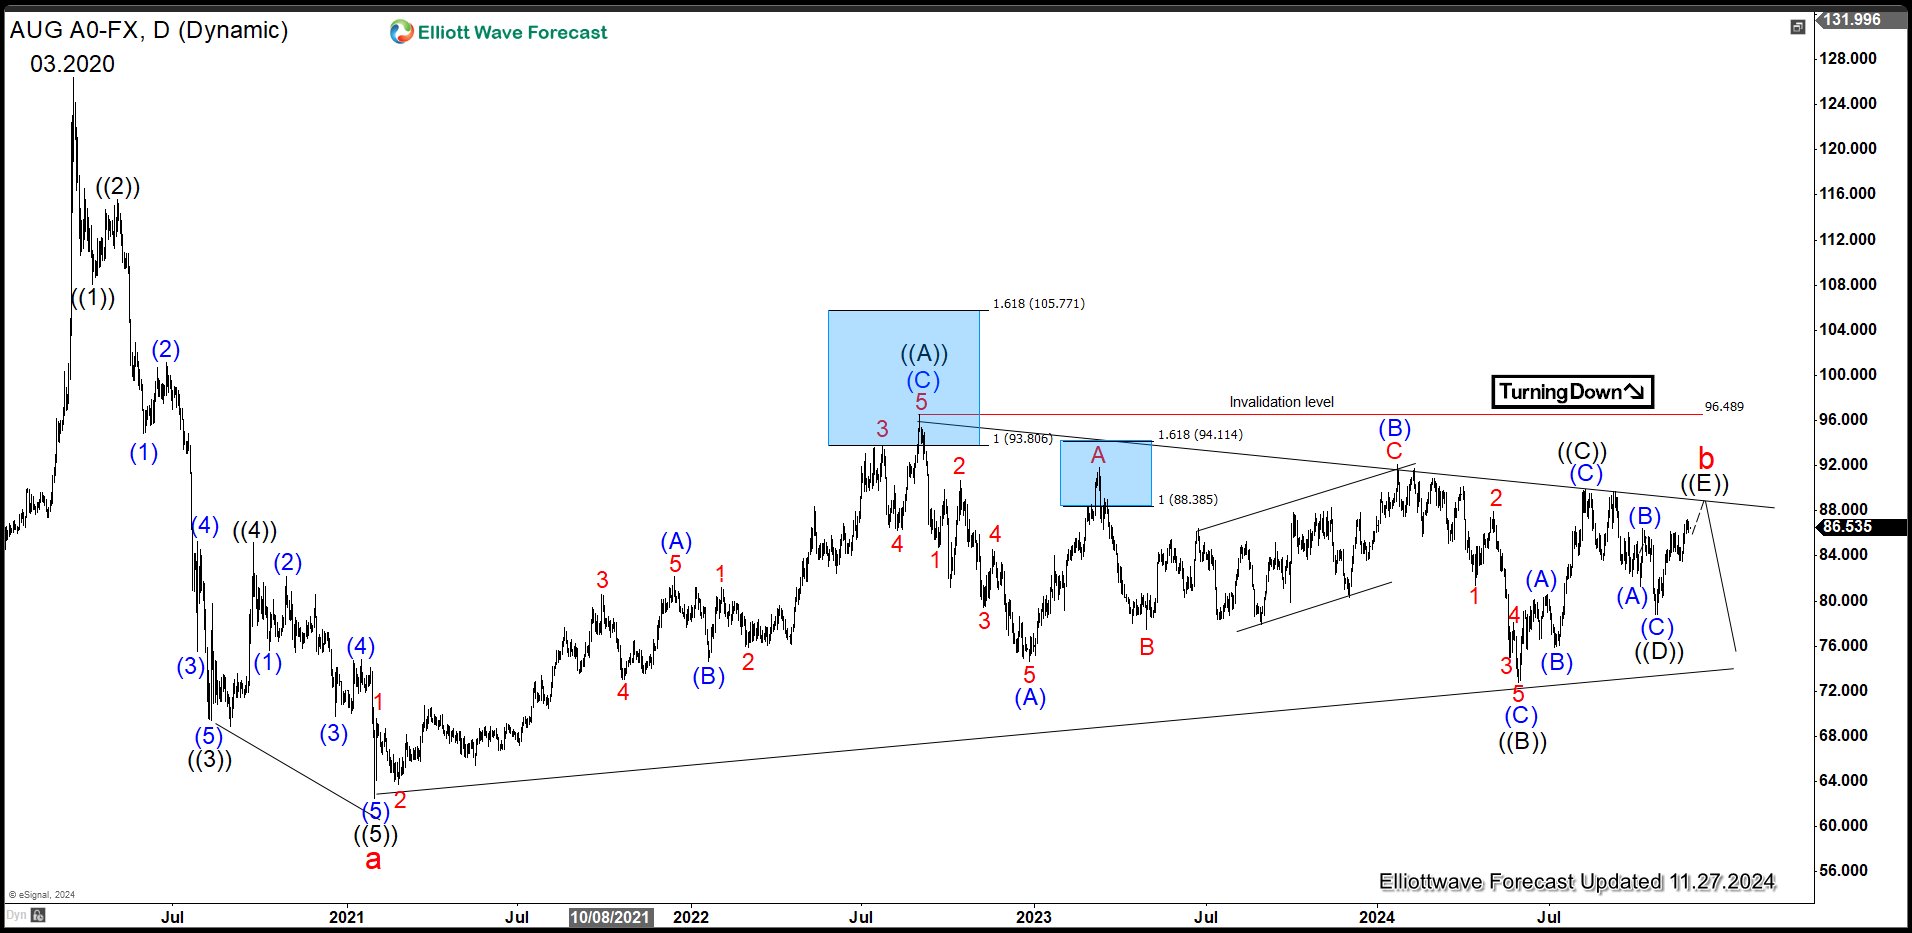
Gold-to-Silver (AUG) Daily Elliott Wave Chart
 Daily Elliott Wave Chart of Gold-to-Silver ratio above seems to suggest a sideways pattern since it formed the low on 2.2.2021 at 62.51. The sideways price action may suggest a symmetrical triangle is in play. Up from 2.2.2021 low, wave ((A)) of the triangle ended at 96.489. Then it moved in sideways to form the ((B)) wave of the triangle on 72.74. Wave ((C)) bounce of the triangle ended at 89.91 while wave ((D)) ended at 78.828. Wave ((E)) is currently in progress to complete wave b before it resumes lower again as far as pivot at 96.49 high stays intact.
Gold-to-Silver (AUG) Video
If you’d like to get a regular update on Gold, Silver, and other commodities, Indices, forex, and stocks, feel free to check our service here –> 14 days Trial
Back
