Gold Miners Junior (ticker: GDXJ) should finish the correction to the cycle from September 2022 low sometimes this year and resumes higher. At this stage, there’s still no strong confirmation whether the correction has ended thus we still can’t rule out another leg lower to end the correction before the ETF finally extends higher. Below we will take a look at the latest Elliott Wave technical outlook
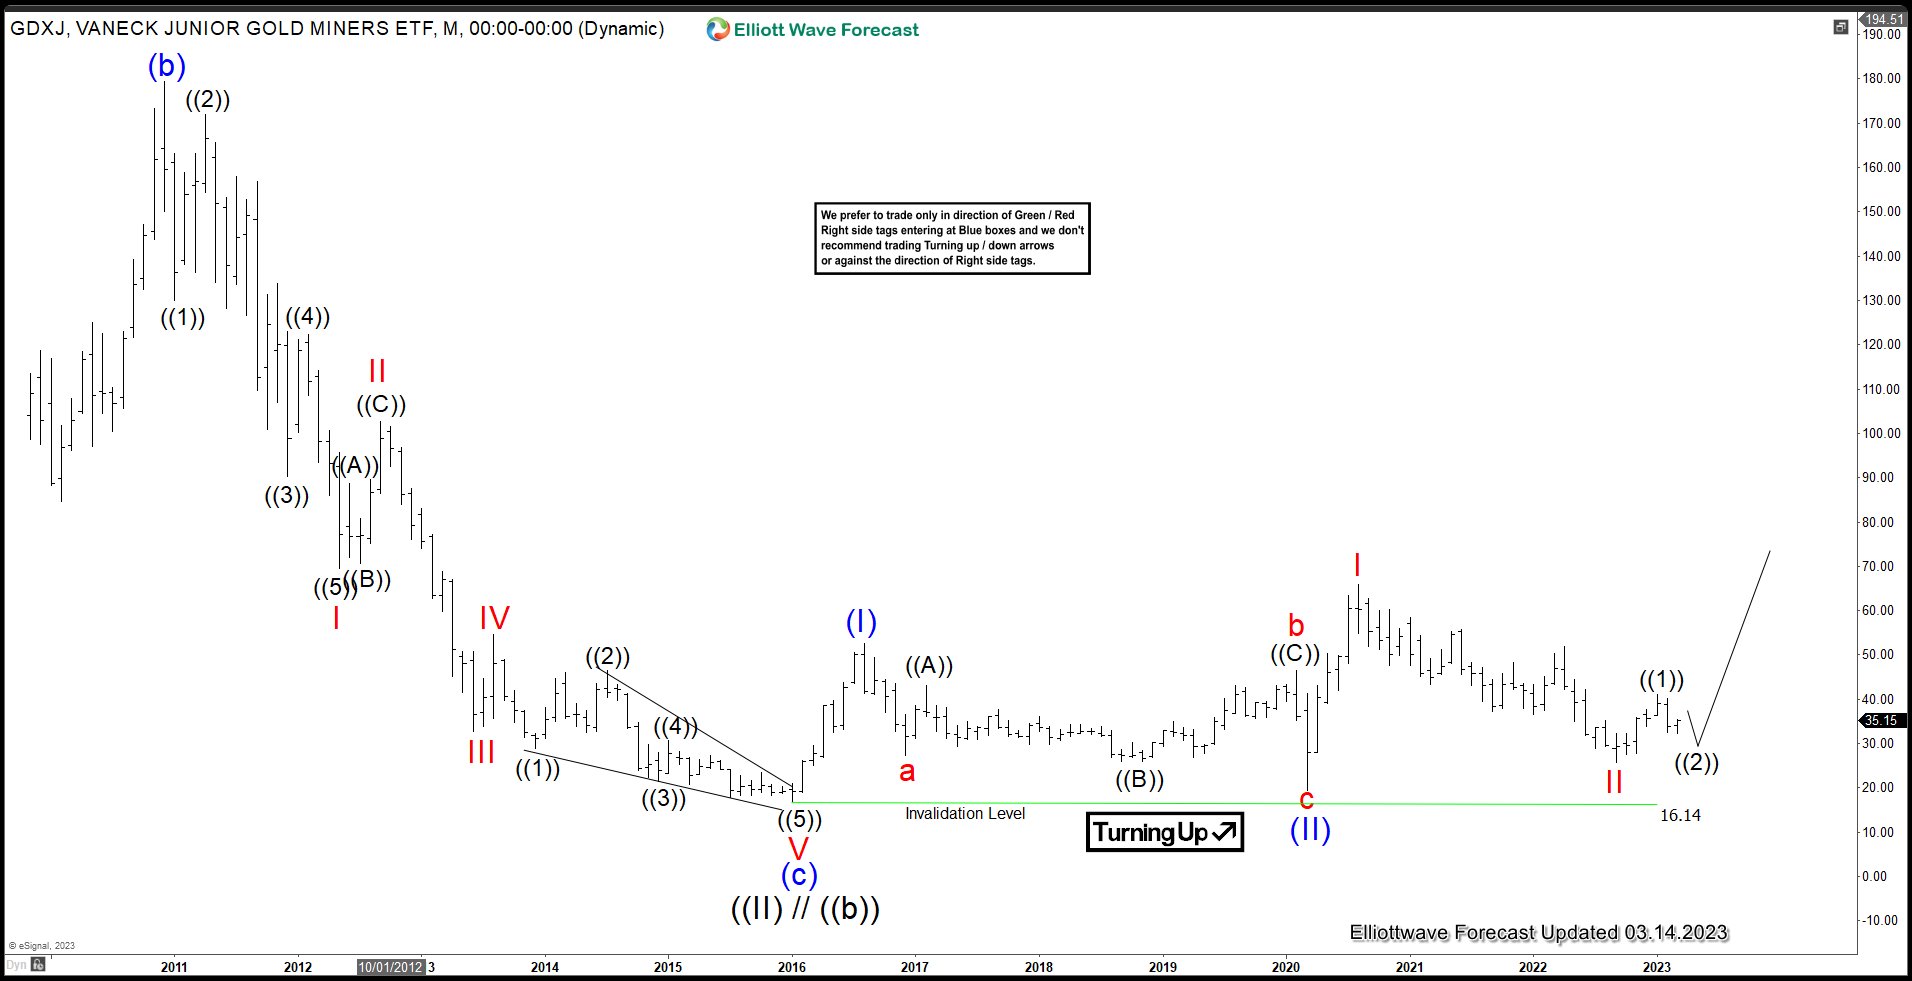
GDXJ Monthly Elliott Wave View
Monthly Elliott Wave Chart above suggests the rally from 2016 low at 16.14 is in progress in the form of a nesting impulse. Up from 16.14, wave (I) ended at 52.50 and pullback in wave (II) ended at 19.52. The ETF has extended higher in wave (III) which subdivides into another 5 waves. Up from wave (II), wave I ended at 65.95 and pullback in wave II ended at 25.80. Expect the ETF to continue higher while above 16.14.
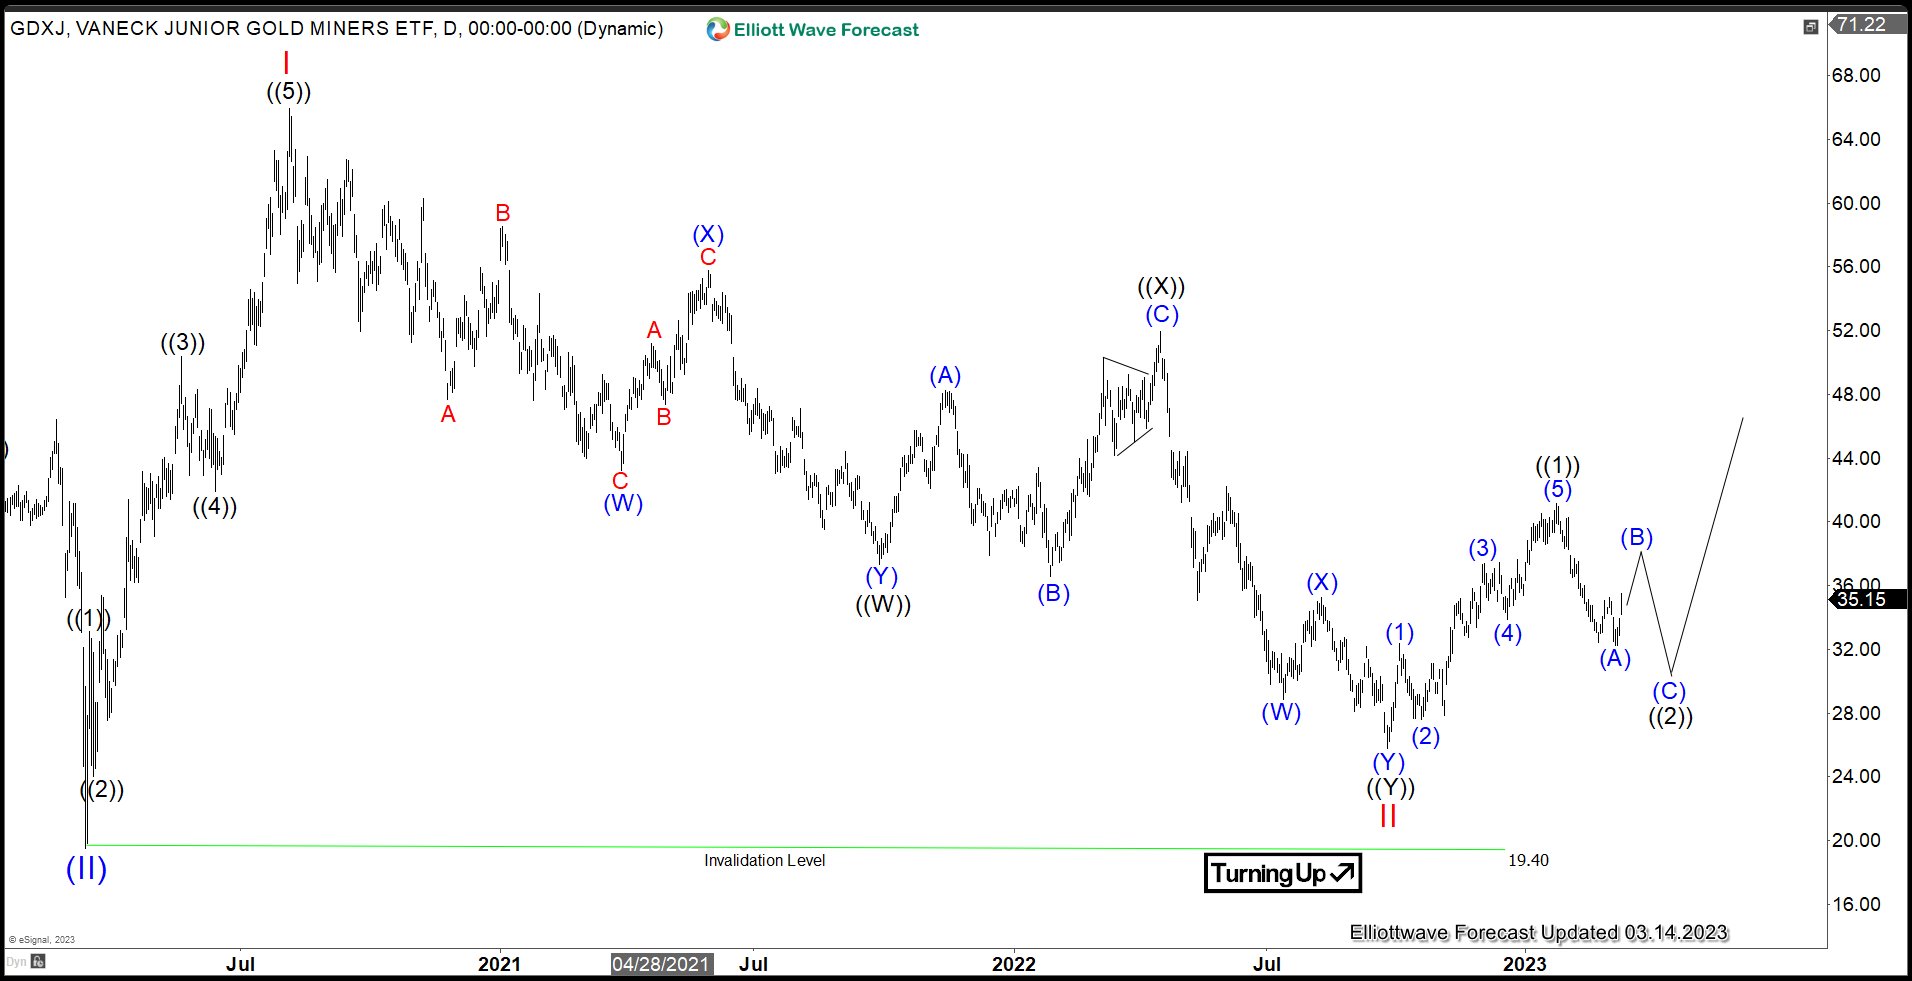
GDXJ Daily Elliott Wave View
Daily Elliott Wave Chart of GDXJ above shows wave III of (III) is currently in progress. Up from wave II low at 25.8, wave ((1)) ended at 41.16. Wave ((2)) pullback is in progress to correct cycle from 9.26.2022 low in 3, 7, or 11 swing before the ETF resumes higher. Down from wave ((1)), wave (A) ended at 32.25. Expect rally in wave (B) to fail below 41.16, and the ETF to extend lower again in wave (C) before ending correction to cycle from 9.26.2022 low in wave ((2)).
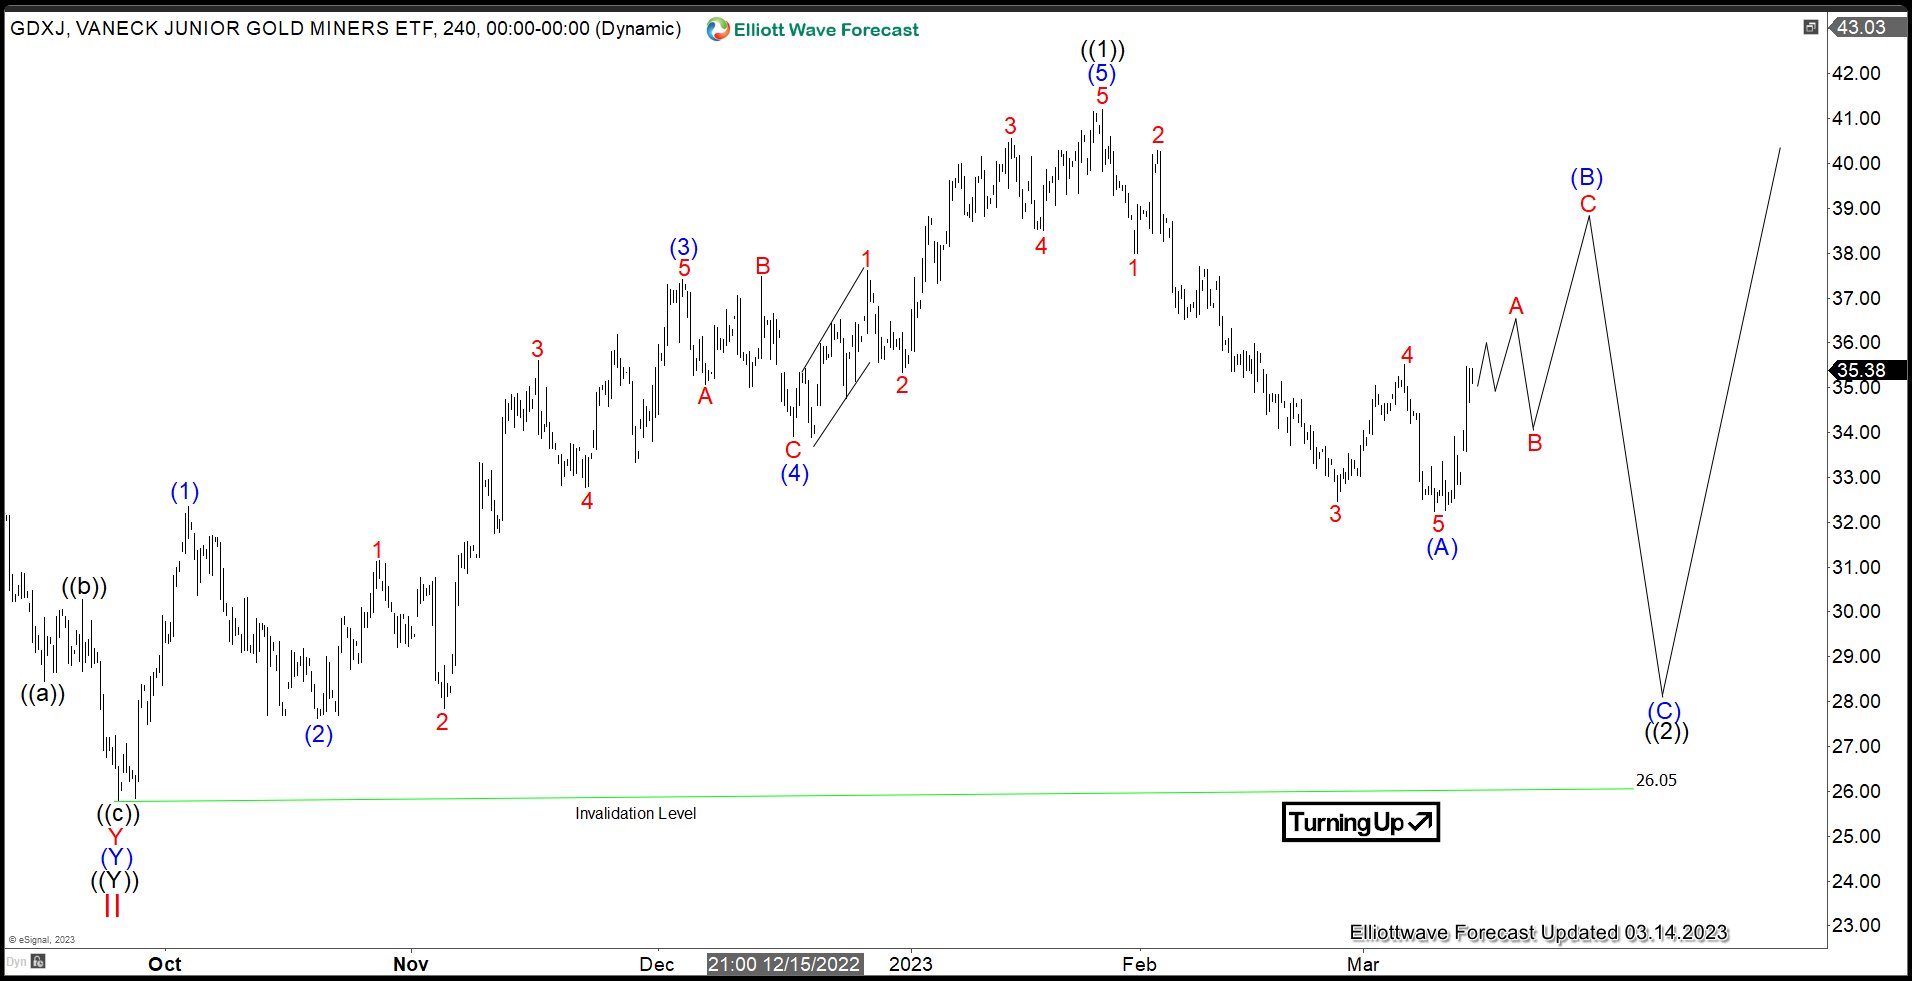
GDXJ 4 Hour Elliott Wave View
 4 Hour Elliott Wave chart of GDXJ above shows the decline from wave ((1)) looks to be in 5 waves impulse and ended wave (A) at 32.25. This suggests that we can’t rule out another leg lower in wave (C) to correct cycle from 9.27.2022 low. Expect however any pullback to find support against 26.05 for further upside. We expect wave ((2)) correction to end sometimes this year and the rally to take place afterwards.
GDXJ Video
We do not cover GDXJ as part of our regular service, but we cover GDX, Gold, and other commodities, stocks, forex, and crypto currencies. If you’d like to check our service, you can take our 14 days trial here –> 14 days Trial
Back


