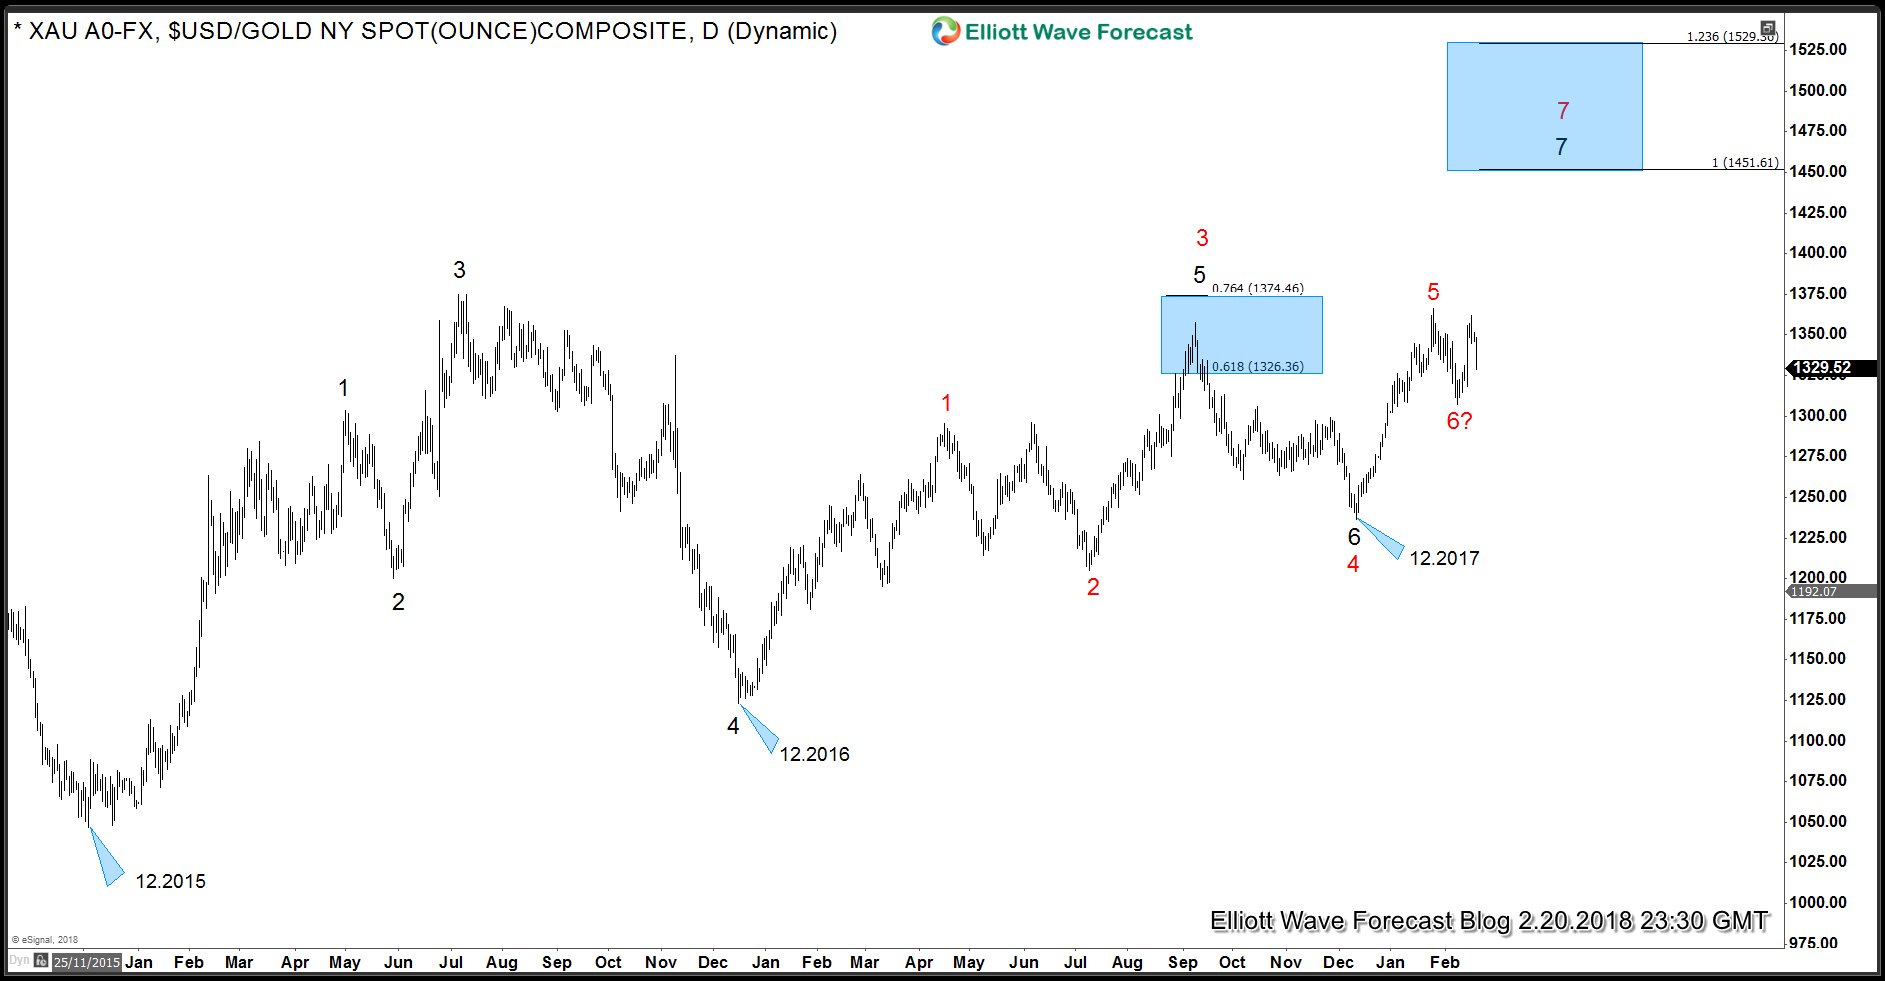
In this video, we take a look at the rally from 12.2015 low in Gold. Rally from 12.2015 is unfolding in a 7 swings sequence (black degree) when we are currently in 7th swing higher from 12.2015 low. Rally from 12.2016 low is also unfolding in 7 swings (red degree). As dips hold above 12.2017 low, Gold should see more upside towards 1451 area to end the cycle from 12.2015 low or at least from 12.2016 low.
Gold Elliott Wave Analysis Video 2.20.2018
Gold Swing Sequence from 12.2015 low
Chart below shows Elliott wave swing sequence up from 12.2015 low in black and red degrees and calls for more upside still. Now, let’s take a look at Elliott wave forecast of the move up from 12.2017 low
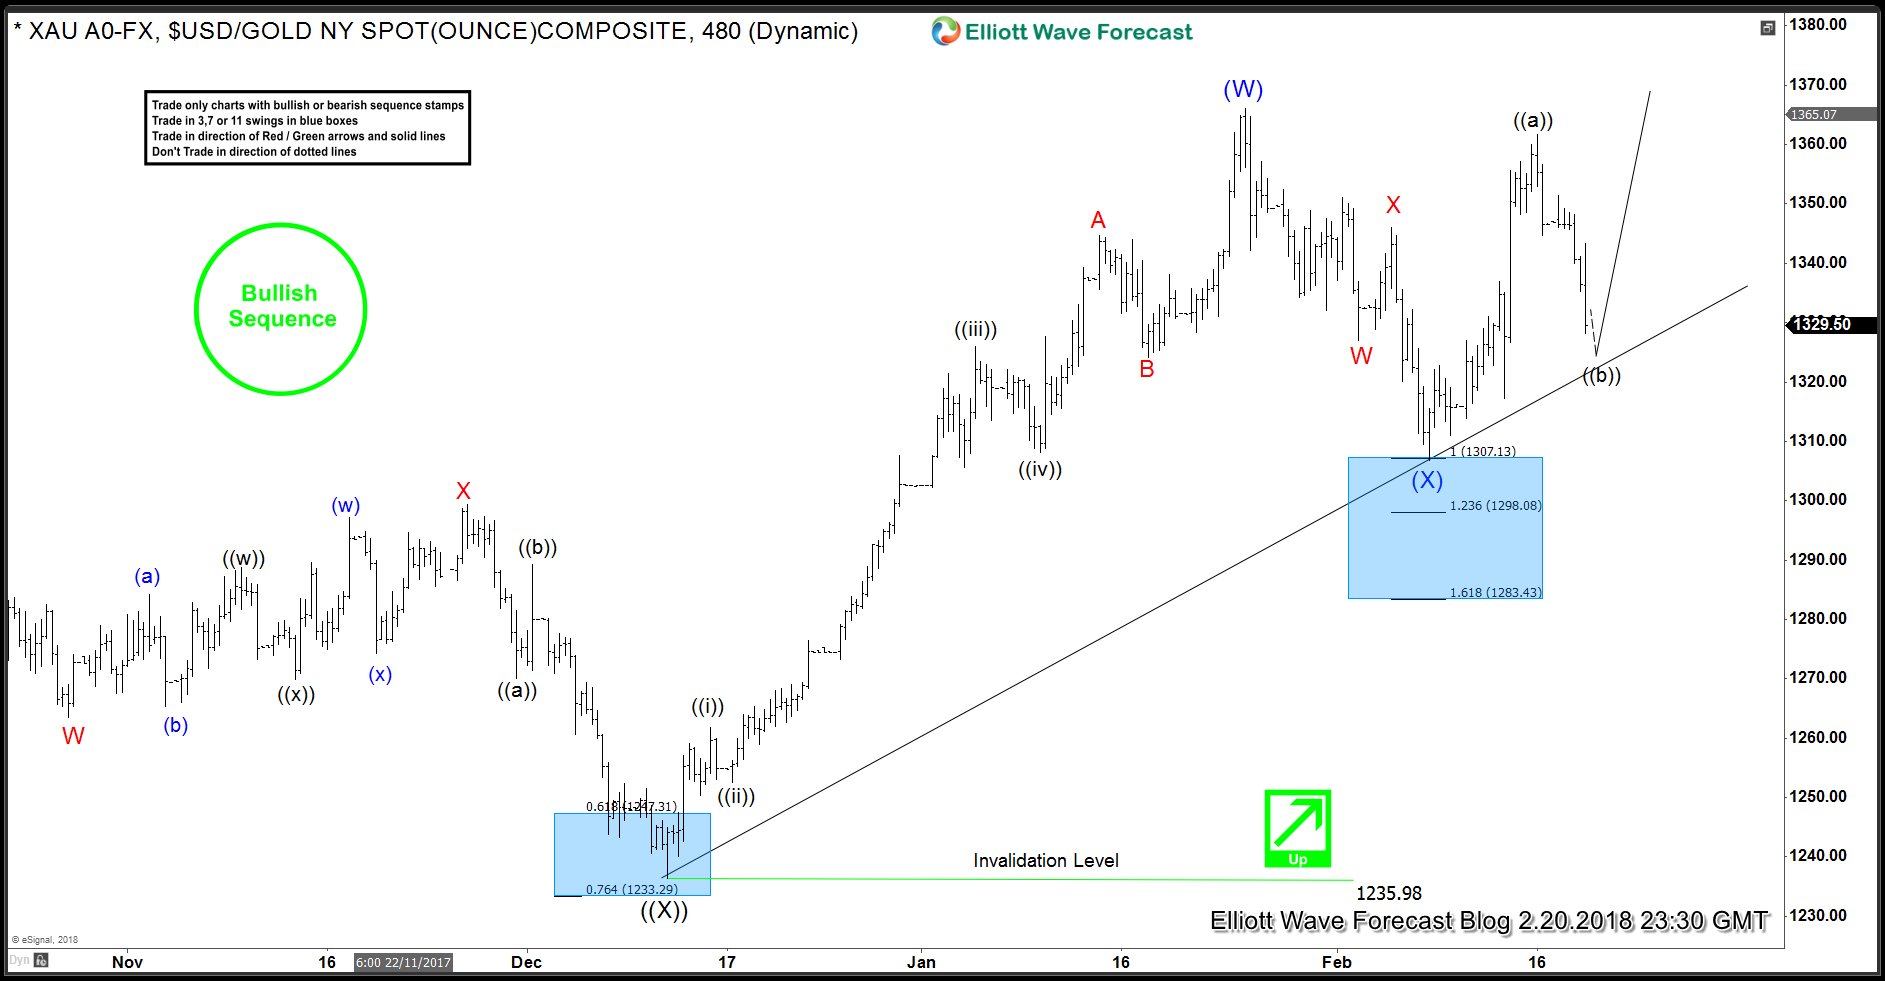
XAUUSD Elliott Wave Analysis – 4 Hour Time Frame
Yellow metal’s rally from 12.2017 black ((X)) low was a zig-zag which completed wave (W) at 1366. This was followed by a pull back which unfolded as W-X-Y and ended at 100% extension of W-X at 1307. 1307 – 1298 was a buying area and longs from there should now be risk free as we have already seen reaction higher from there as expected. We have labelled drop to 1307 as wave (X) and expecting Gold to break to new highs towards 1436 – 1451 area. Rally from 1307 low unfolded in 5 waves i.e. wave ((a)) and wave ((b)) pull back is currently in progress. As it holds above the trend line from 12.2017 through 2.2018 low, Gold should turn higher again to resume the rally.
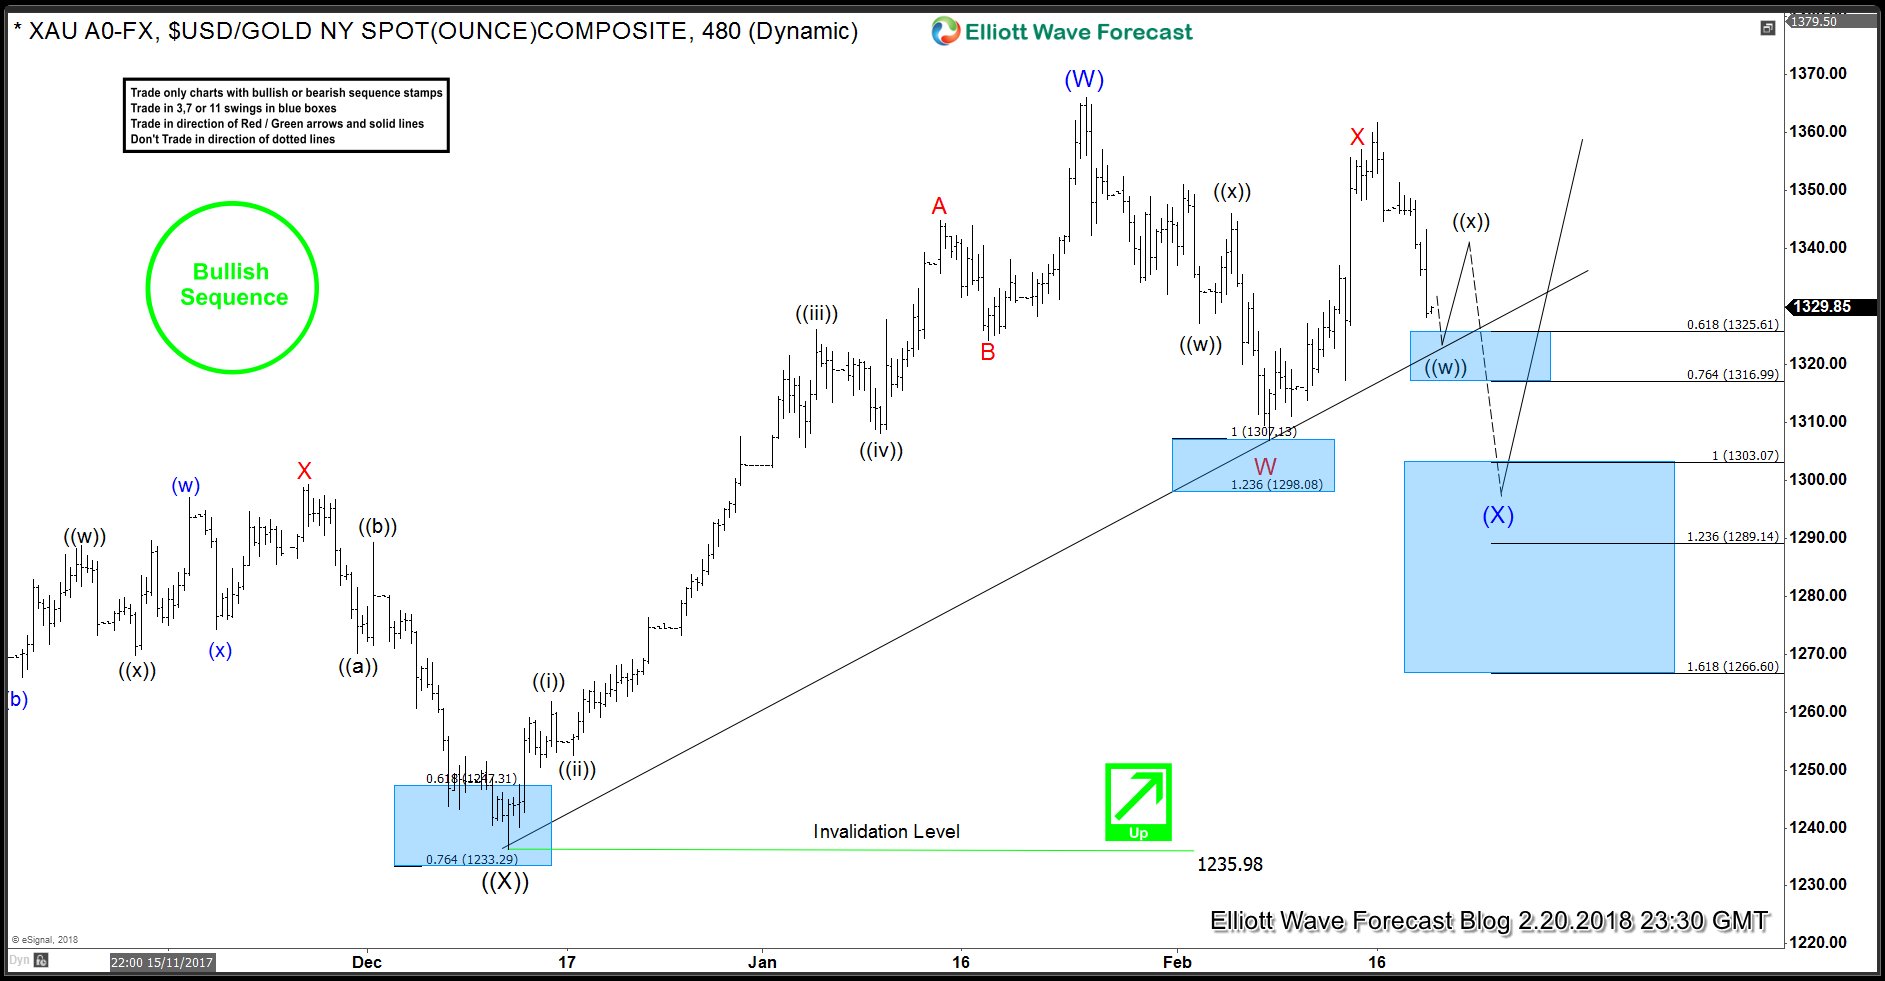
XAUUSD Elliott Wave Analysis – Double Three Wave (X) Possibility
If Gold bounce fails below 1361.72 and it turns lower again or we get a break and hold below the trend line, then Gold should still be in wave (X) as a larger double three structure and could drop to 1303 – 1289 area where buyers should be waiting again for a rally to new highs above 1366 or a larger 3 waves bounce at least. As Gold has got 5 swings up from 12.2016 low, that means right side is the upside and hence why we expect buyers to keep appearing at extreme areas in the sequences of 3-7-11 swings and don’t like the selling.
Back


