GBPUSD Trade Video Clip from July 20th Live Trading Room
Below is a video clip of GBPUSD trade that we took from July 20th Live Trading Room
Below is the trading journal line for the trade
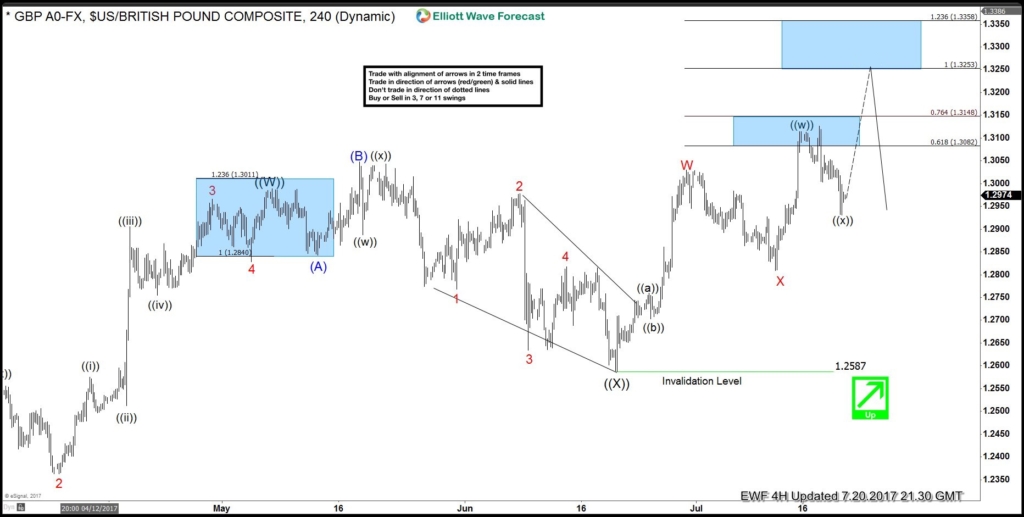
GBPUSD 4 Hour Elliott Wave Chart on July 20th
GBPUSD is showing bullish 5 swing Elliott Wave sequence in the 4 hour chart above from 1.2587 low, favoring further upside towards 1.325 – 1.3358. We looked for a way to join the higher degree trend to the upside in the lower 1 hour time frame and tried to find an entry in the pullback to buy.
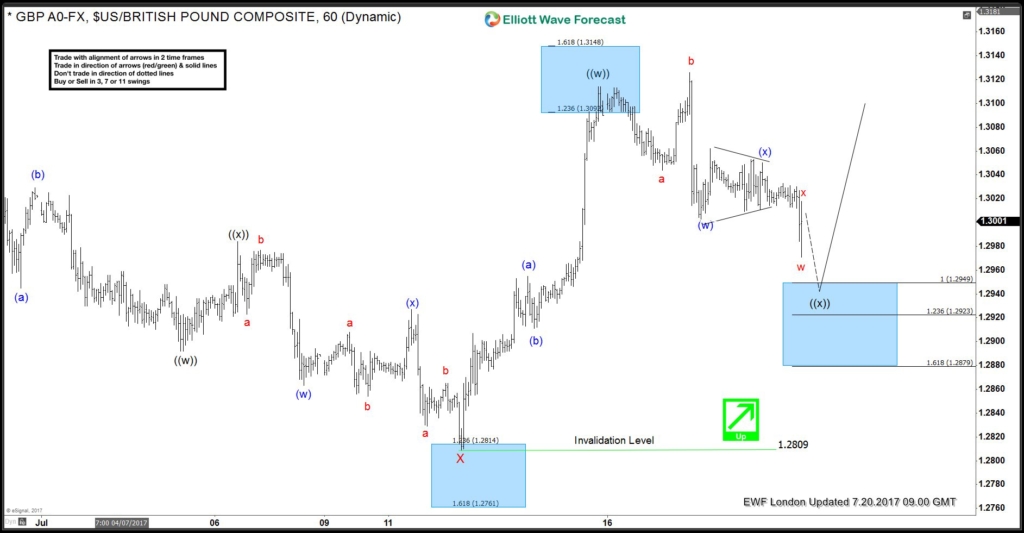
GBPUSD 1 Hour Elliott Wave Chart on July 20th
GBPUSD 1 hour chart on July 20th shows that the pair is correcting cycle from 1.2809 low in 7 swing towards 1.292 – 1.295 area (blue box). From there, we expect pair to resume higher. We bought the pair in Live Trading Room at 1.2945 on July 20th with reward to ratio risk of 3.4 to 1. The pair reaches our target of 1.325 for 305 pips profit on August 3.
We hold Live Trading Room for Group 1 daily at 5.45 AM EST / 9.45 AM GMT and Live Trading Room Group 2 at 6.45 AM EST / 10.45 AM GMT. Join us everyday to get trading idea and learn how to execute trades using our technique of 3, 7, and 11 swing. Members will also receive a trading journal with entry, stop, and limit. Try our service 14 days FREE to get started. You will get access to Live Trading Room, Elliottwave charts for 52 instrument, live sessions, educational videos exclusive to members, 24 hour chat room, and more today.
Back


