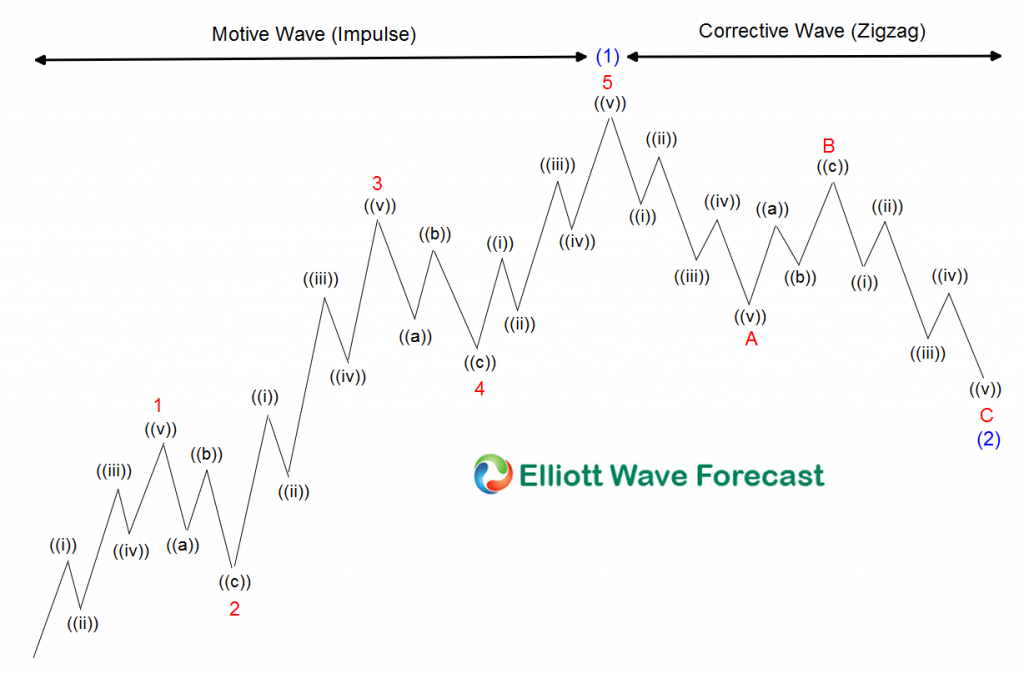
The World Indices including FTSE, Nikkei, SPX, etc are trading within very Interesting areas. Elliott Wave Theory state that after Five waves advance, there is a three waves pullback. If we look at the Indices like $SPX, $SPY, and $ES_F. A five waves advance can be seen clearly within the Grand Supercycle. Many wavers believe the ideas that because of the Five waves, a soon to happen crash across the Market Place is about to happen. On the other hand, we keep tracking, as many Indices and Symbols, as possible to draw our conclusion. The following chart:
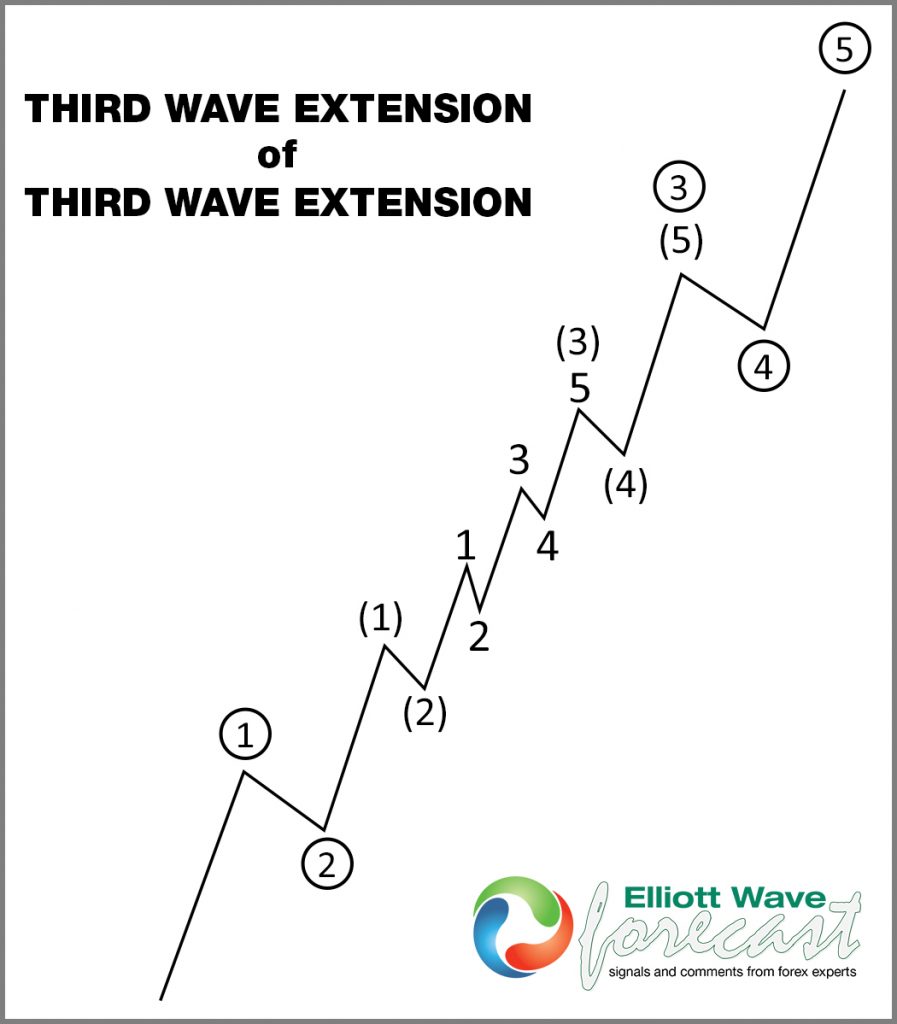
Shows the classic Elliott Wave Patten, representing the five waves advance and three waves pullback. A nest is a concept that many wavers do not consider, and many times five waves become five swings and consequently a nest. Spotting the nest can not be done without checking across the marketplace, and it is something we do daily at elliottwave-forecast.com. The following chart:
Shows a nest into wave (3) and always happens within the extended impulse among the three impulses during a cycle.
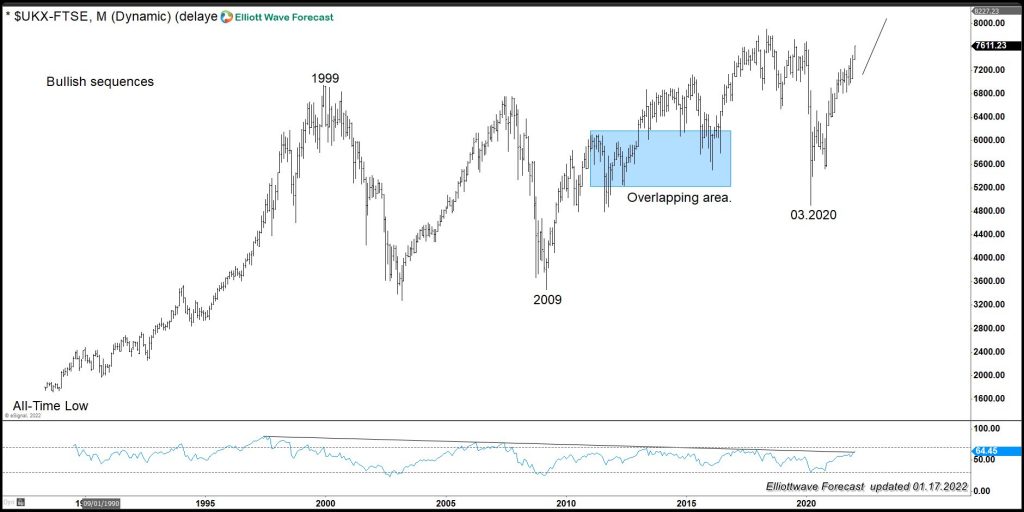
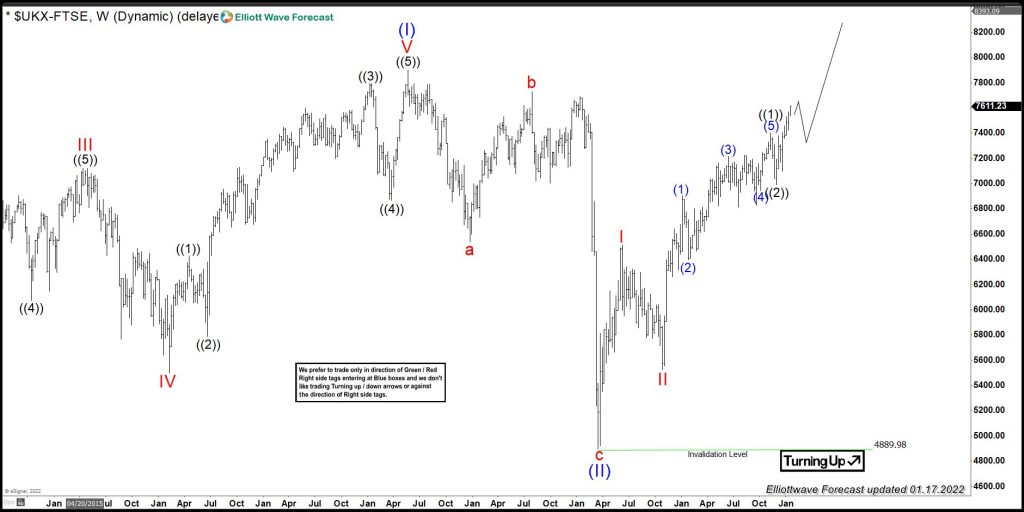
$FTSE is a unique Index because of two particular situations. Firstly because the index broke above the 1999 peak with momentum divergence. The idea that the advance since the 2009 lows is weaker than the previous advance tells us that more upside should be happening. We call the idea bullish sequences and should extend higher until the divergence is erased. Secondly, the advance since the lows in 2009 comes with an overlap. And one of the Elliott wave rules states that it shouldn’t be overlapping within wave 3 of 3. Hence, the violation presented in the Index makes the advance a Leading Diagonal. This makes the case part of a nest with momentum divergence & overlapping price action in the following chart below:
FTSE Monthly Elliott Wave Chart
FTSE Weekly Elliott Wave Chart
The following video explains the view and provides an indication of what is should happen ahead.


