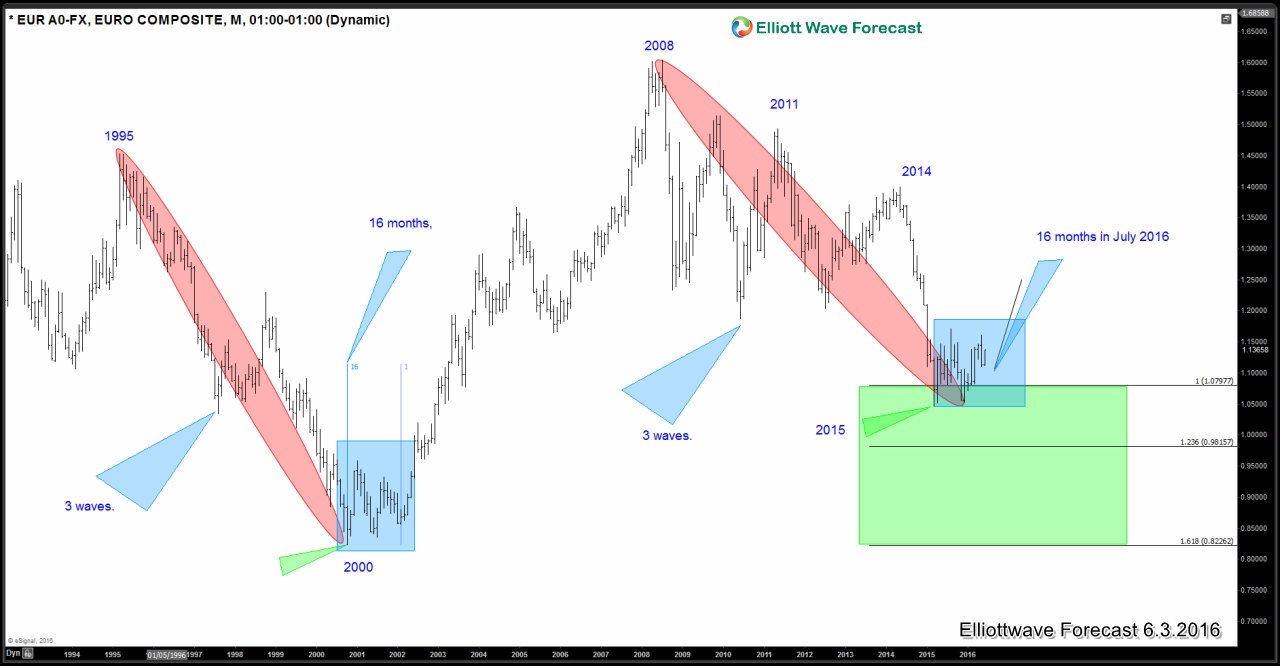
In this blog we are going to take a look at the monthly chart of $EURUSD and highlight some similarities between the price action that we saw in the year 2000 and that we have seen since March 2015. Decline from 1995 high – 2000 low was a 3 wave drop to 100% Fibonacci extension and stopped in 61.8 – 76.4 Fibonacci retracement zone of the rally from 1985 low – 1995 high. Similarly we can see the decline from 2008 high – 2015 low was a 3 wave drop to 100% Fibonacci extension and stopped in 61.8 – 76.4 Fibonacci retracement zone of the rally from 2000 low – 2008 high.
Secondly, after forming a low in 2000, EURUSD consolidated for 16 months before starting a powerful rally to the upside. In July 2016, 16 months would have passed since the low in March 2015 was seen. Could the history be repeating itself? That remains to be seen but we do know that the monthly swing sequence in $EURUSD is bullish and even if it makes another low below March 2015 low, the sequence would remain bullish. We have highlighted and explained these similarities in the video form as well that you can watch below.
We hope you enjoyed this blog. If you would like to see our preferred Elliott wave path from here and also like help in navigating the shorter cycles to look for trading opportunities, sign up for your Free 14 day Trial here.
Watch Eric Morera’s interview about EURUSD conducted by Dale Pinkert in May 2015 here.


