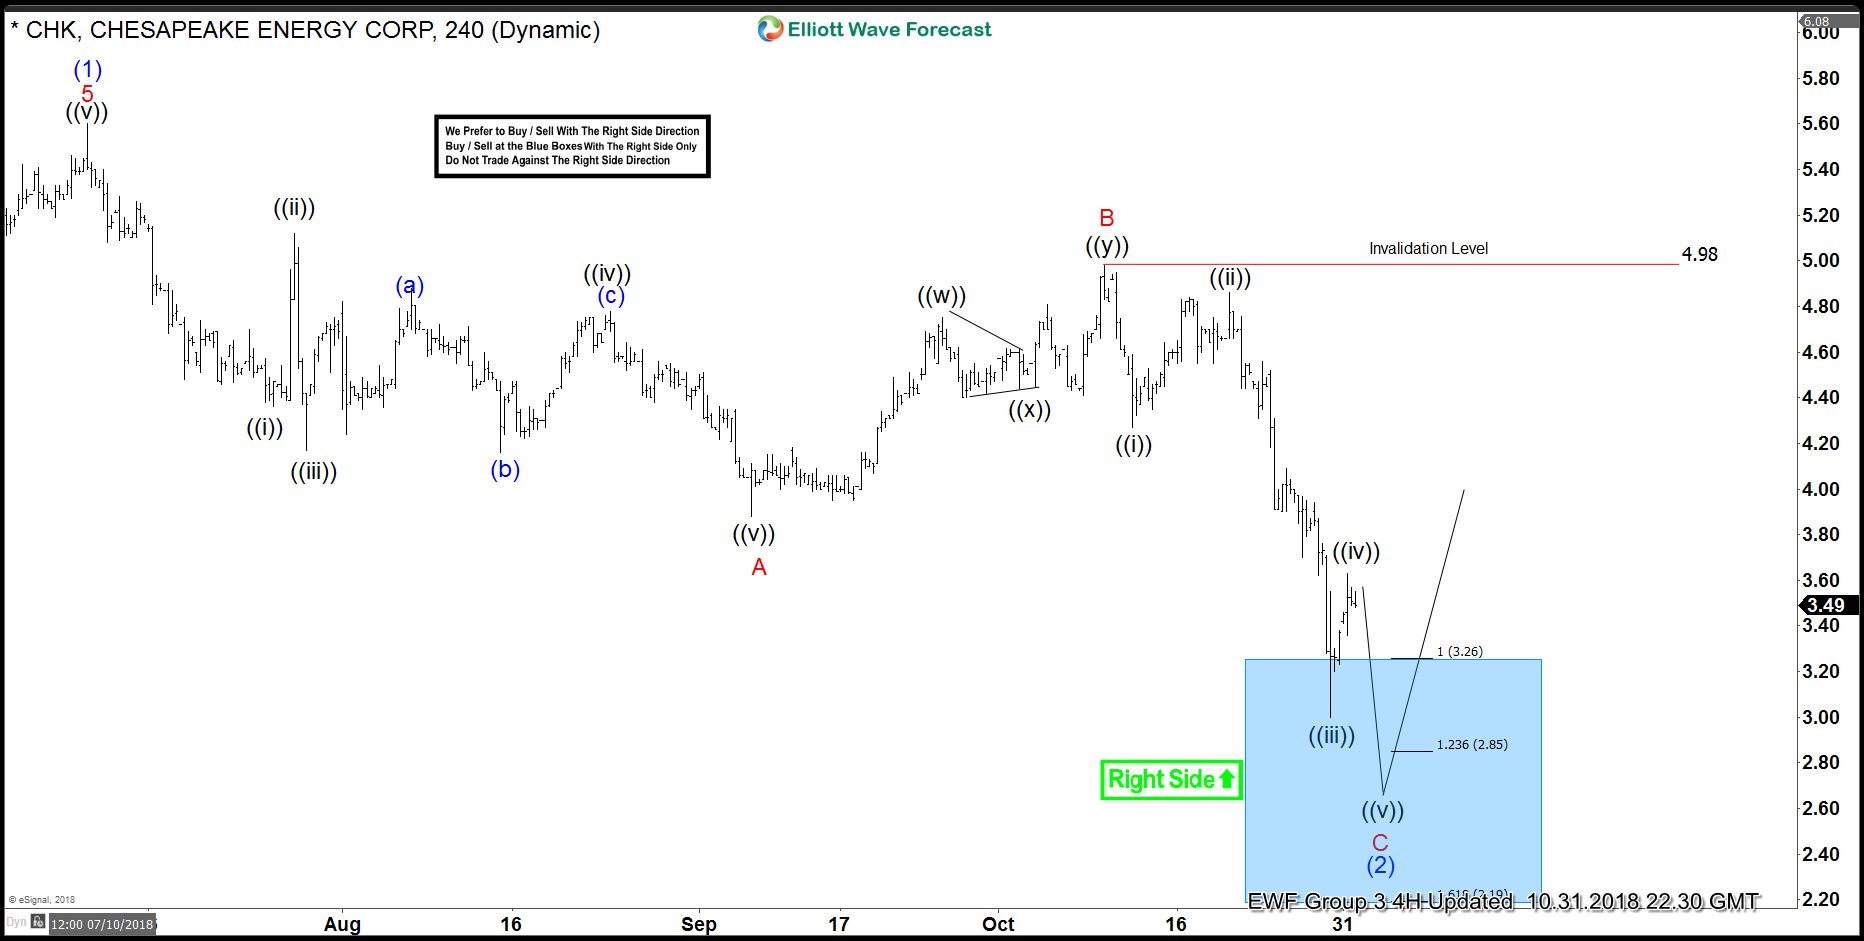
After just getting stopped out in CHK for no loss, why are we buying again?
I am of the firm belief that if you only traded based on the media drive-by observations of any particular stock you would be hard pressed to know what to do most of the time. For example, how many times have you seen a company’s earnings release beat the consensus eps estimates only to see the stock crater over some seemingly meaningless word or sentence in the earnings release? This has happened for most of this year’s Q3 earnings season and we’ll look at the move around CHK and its earnings release below. Most traders and analysts are always looking for some fundamental “why” behind these reactionary price movements. I’m not here to delve into a deep discussion of the whims of fundamental trading because I do believe there are merits to macro level fundamental analysis even though here at EWF we focus a very niche form of technical analysis. What I do want to share with you is a bit of our process and how we go about selecting the best trade setups.
The CHK Long.
One of our more recent trades has been going long Chesapeake Energy Corporation (CHK). As I write this CHK sits at about $3.50/share having just bounced off $3.16 on 10/30/2018 which is a price level we haven’t seen since May of 2018. One question I always ask myself is why or why not a particular financial instrument rebounded or was rejected at a particular price level? If I could figure out the why then I could figure out how to use that information to make better informed trading decisions with a higher degree of confidence when deciding to capital at risk in one direction of the other.
Buying and Selling at the Extremes.
Subscribers of our service know we look for extremes in price before we would issue recommendation or signals to buy or sell any particular financial instrument. These extremes are measured via charting tools based upon geometric fractal analysis coupled with a proprietary sequencing analysis conveyed through the language of the Elliott Wave Principle. Below you will see a relatively recent chart of CHK on a 4 hour time frame which simply means each black bar represents a particular 4 hour time span. What you will see is a rectangular shaped blue box with various numbers and letters scattered throughout the chart picture. At the top of the blue box you will not a number 1 with (3.26) to the right of the 1. This number 1 actually represents 100% for the particular tool we use to measure extremes. You will also hear the terms “Measured Move” and “Equal Legs” by our analysts which both represent this 100% extreme
High Probability of a Reaction at the Extremes.
In our years of observing these “measured moves” we find that the majority of the time (>80%) there is a strong reaction at these extreme levels which gives confidence to a trader when adding this analytical tool to a rule based trading method of entering and exiting the market without using emotion or headline reactions. And so that’s just one of the reasons we started buying CHK here again even in the midst of a sharp sell off from the price point “B” in red just above the “invalidation level”. This “B” is also the price that has become our “connector” between 2 extremes labeled as “A” and “C”. Where the 100% measured move comes into play is this relationship in terms of price action range of the down move labeled “A” extended from the top of the “B” to produce an “equal leg” target for the bottom of the expected price range for “C” where we would expect a reaction hence the initiation of longs at that extreme level highlighted by the blue box area. In simpler terms the “equal legs” in this example is where the length of “A” projected from the top of “B” equals where “C” should react and that’s exactly what we are seeing right now in CHK. To learn more about this CHK trade’s setup, stops, progression and target along with more valuable trading tools for maximum potential be sure to take a free 14 day trial of our service.
Trade Safe!
James
Back

