RSI and Trendlines – SPY
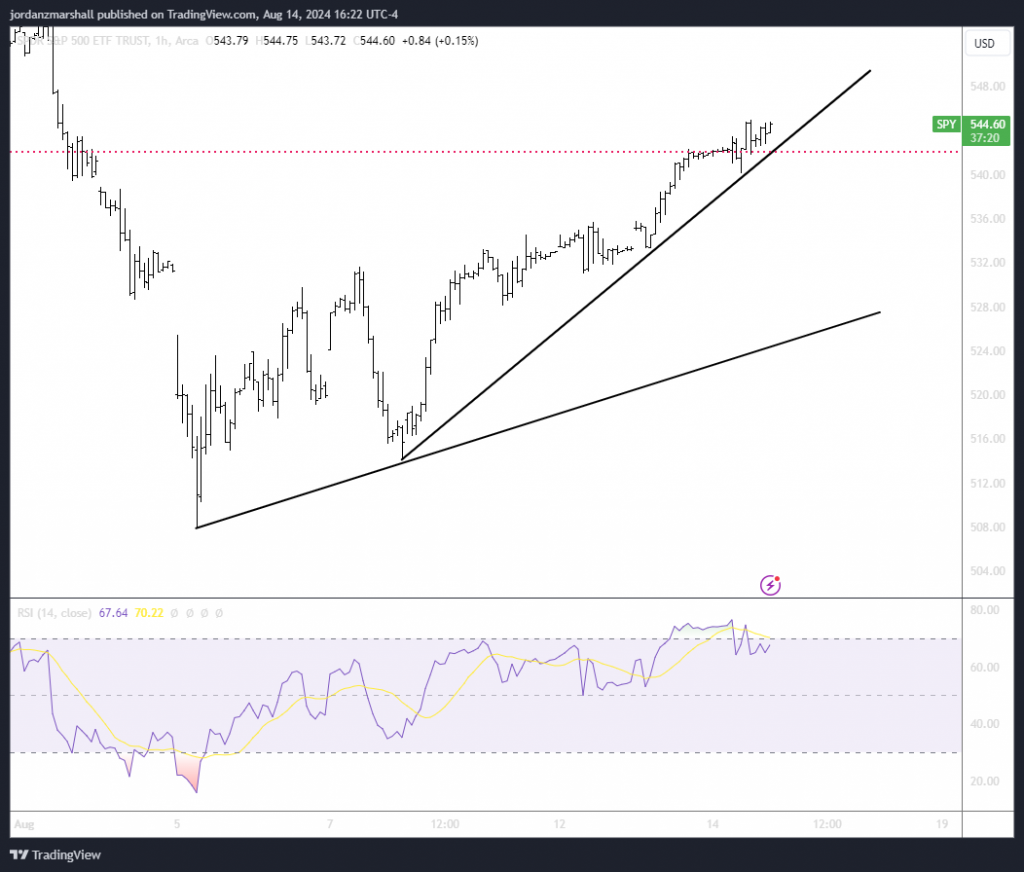
S&P500 shifted to new highs today, but how long will the trend last? As we can see, with price making new highs, RSI has made lower-highs. A possible sign of a impending short-term top. On this chart as well, I’ve drawn two trend lines to capture the recent upward movement from August 07, 2024 close to now. Price breaking below 526-527 downward could lead to a short-term pullback. To find the price prediction, now lets look at the Elliott Wave count:
The Wave Count
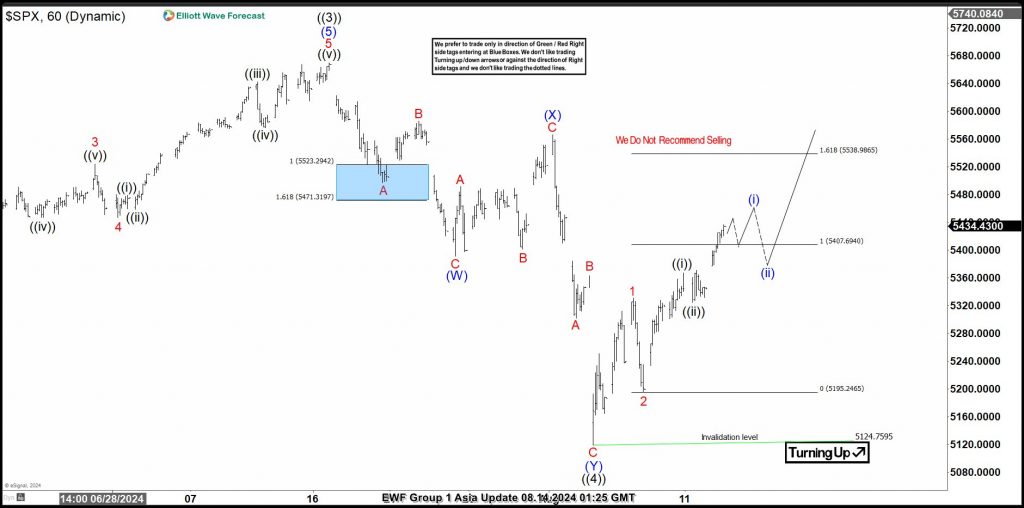
Similarly to the RSI divergence, our wave count is expecting wave ((i)) to be complete soon, and a pullback for wave ((ii)). This is an upward move within red wave 3, and is very bullish. The fact that Elliott counts and RSI agree with short-term upward movement with a pullback coming soon is a good indication of what’s to come and adds some probability to this outlook.
Elliott Wave theory attempts to fit a frequency to the price movements, with major moves measured in five, nine, and thirteen (adding four from there). Corrective waves are measured in three, seven, and eleven, adding four from there. Upon completing one set of waves we expect a correction the other way with the opposing characteristics. With the case built now for limited price action tomorrow with a pullback thereafter. Let’s see how it plays out!
About Elliott Wave Forecast
www.elliottwave-forecast.com Updates one-hour charts 4 times a day and 4-hour charts once a day for all our 78 instruments. We do a daily live session where we guide our clients on the right side of the market. In addition, we have a chat room where our moderators will help you with any questions you have about what is happening in the market.
Moreover, experience our service with a 14-day Trial for only $0.99. Cancel anytime by contacting us at support@elliottwave-forecast.com.
Back


