Hello fellow traders. In this technical blog we’re going to take a quick look at the past Elliott Wave charts of Nasdaq index published in members area of www.elliottwave-forecast.com. We’re going to take a look at the price structures of the index and get through Elliott Wave forecast.
As our members know , we were pointing out that Nasdaq is trading within larger bullish trend in the cycle from the 3863 low. Due to correlation with other American indexes that are having incomplete bullish sequences we knew that Nasdaq should remain trading higher. We advised our members to avoid selling it, as the mentioned cycle from the 3863 low is still alive. We favored the long side, expecting buyers to appear in every pull back in 3,7,11 swings.
Now let’s take a look at the previous short term Elliott Wave forecasts.
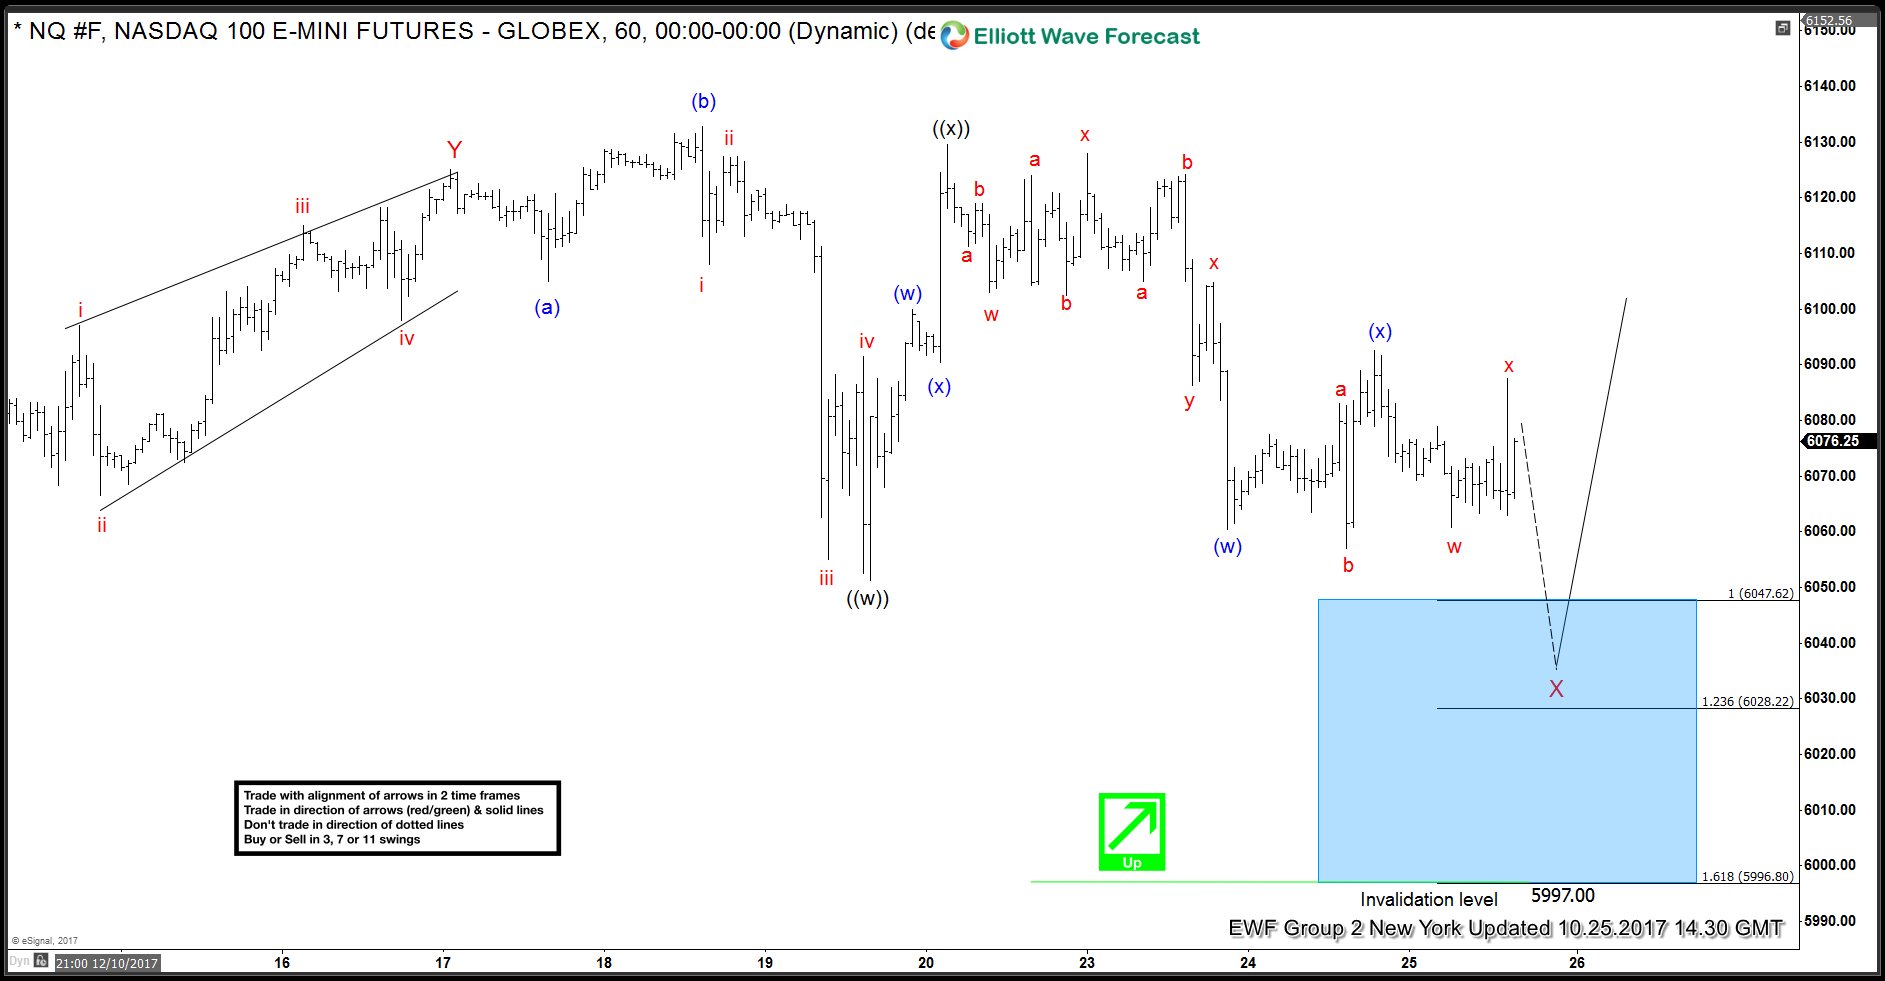
NASDAQ 1 hour New York update 10.25.2017
As we can see on the charts bellow wave X red pull back is in progress. It has Double Three structure ((w))((x))((y)) , when first leg ((w)) is irregular flat pattern . We expect another push down toward equal legs -1.236 Fibo extension of ((w))-((x)) 6074.6-6028.2 to complete proposed pull back. Invalidation level comes at 5996.8 and as far as the price stays above it, we’re favoring the long side, expecting further rally ideally or 3 wave bounce at least.
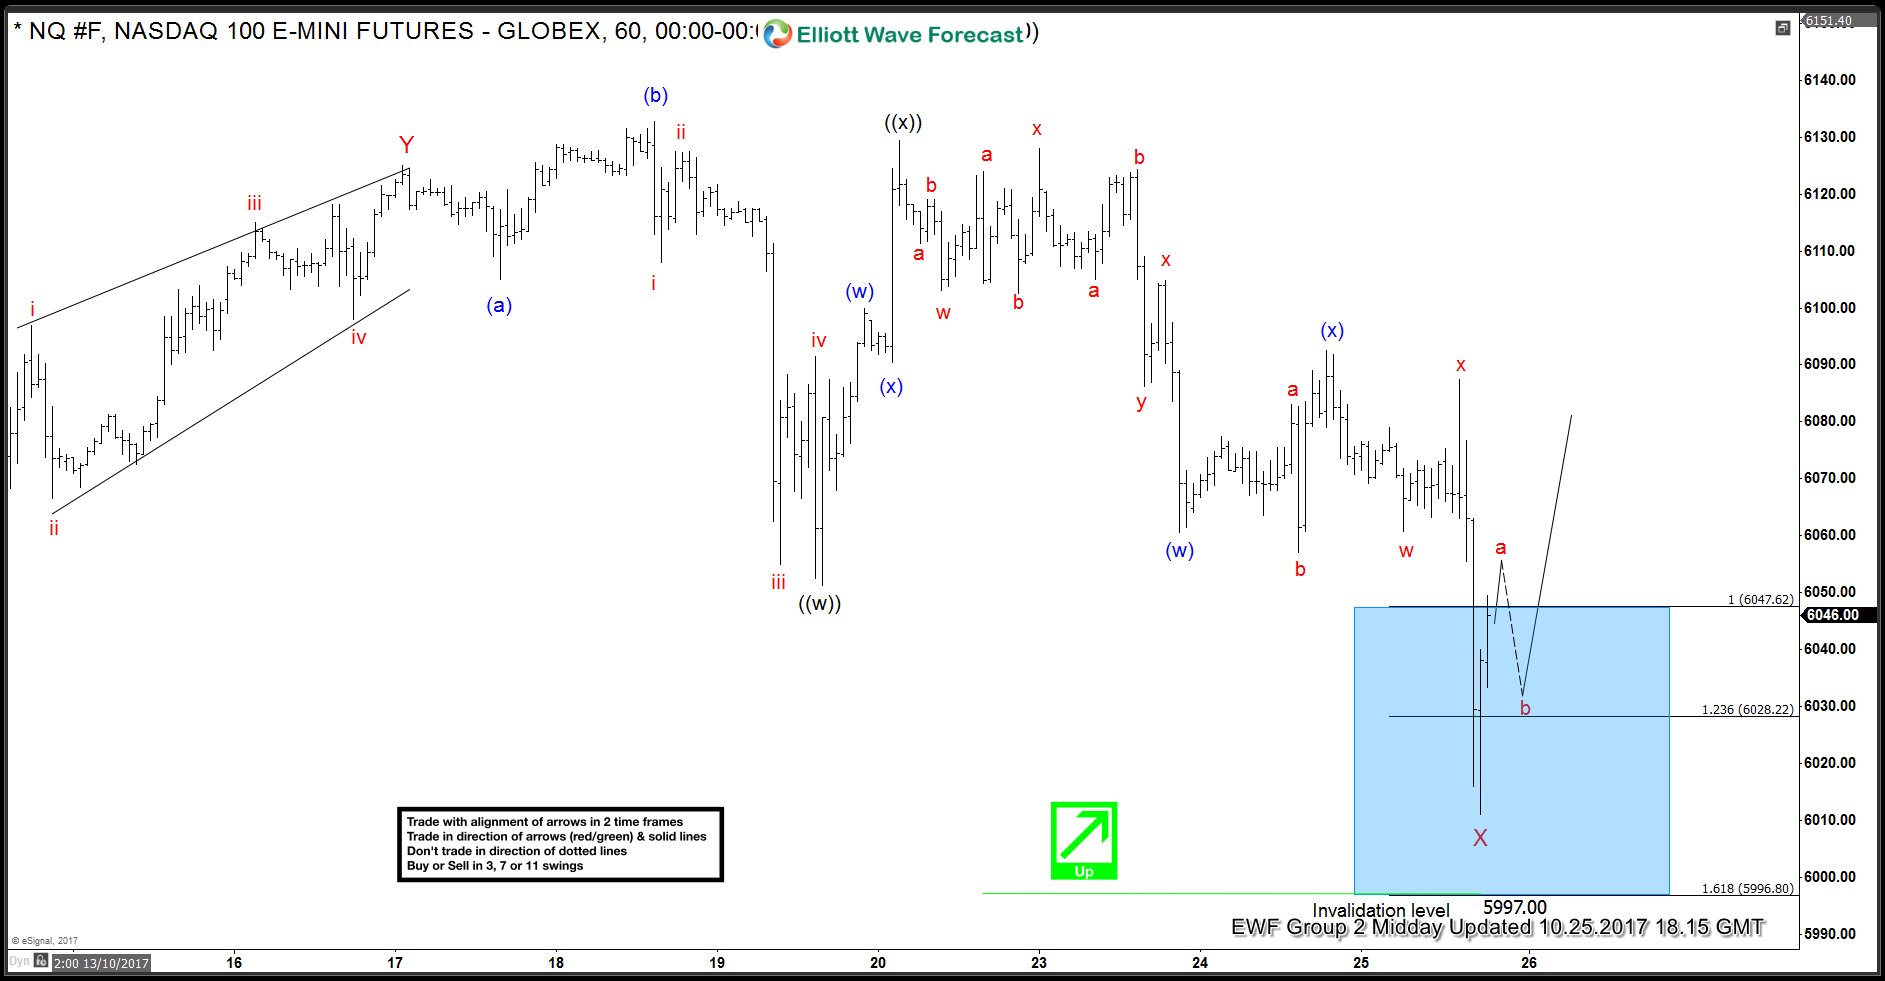
NASDAQ 1 hour Midday update 10.25.2017
Shortly after we got sharp decline toward proposed technical area. Short term sellers broke 1.236 fibo extension level: 6028.22 , however buyers appeared shortly after and we’re getting nice reaction. Invalidation level at 5996.8 is holding well so far. We’re calling X red pull back completed at 6011.7 ,expecting further rally toward new highs.
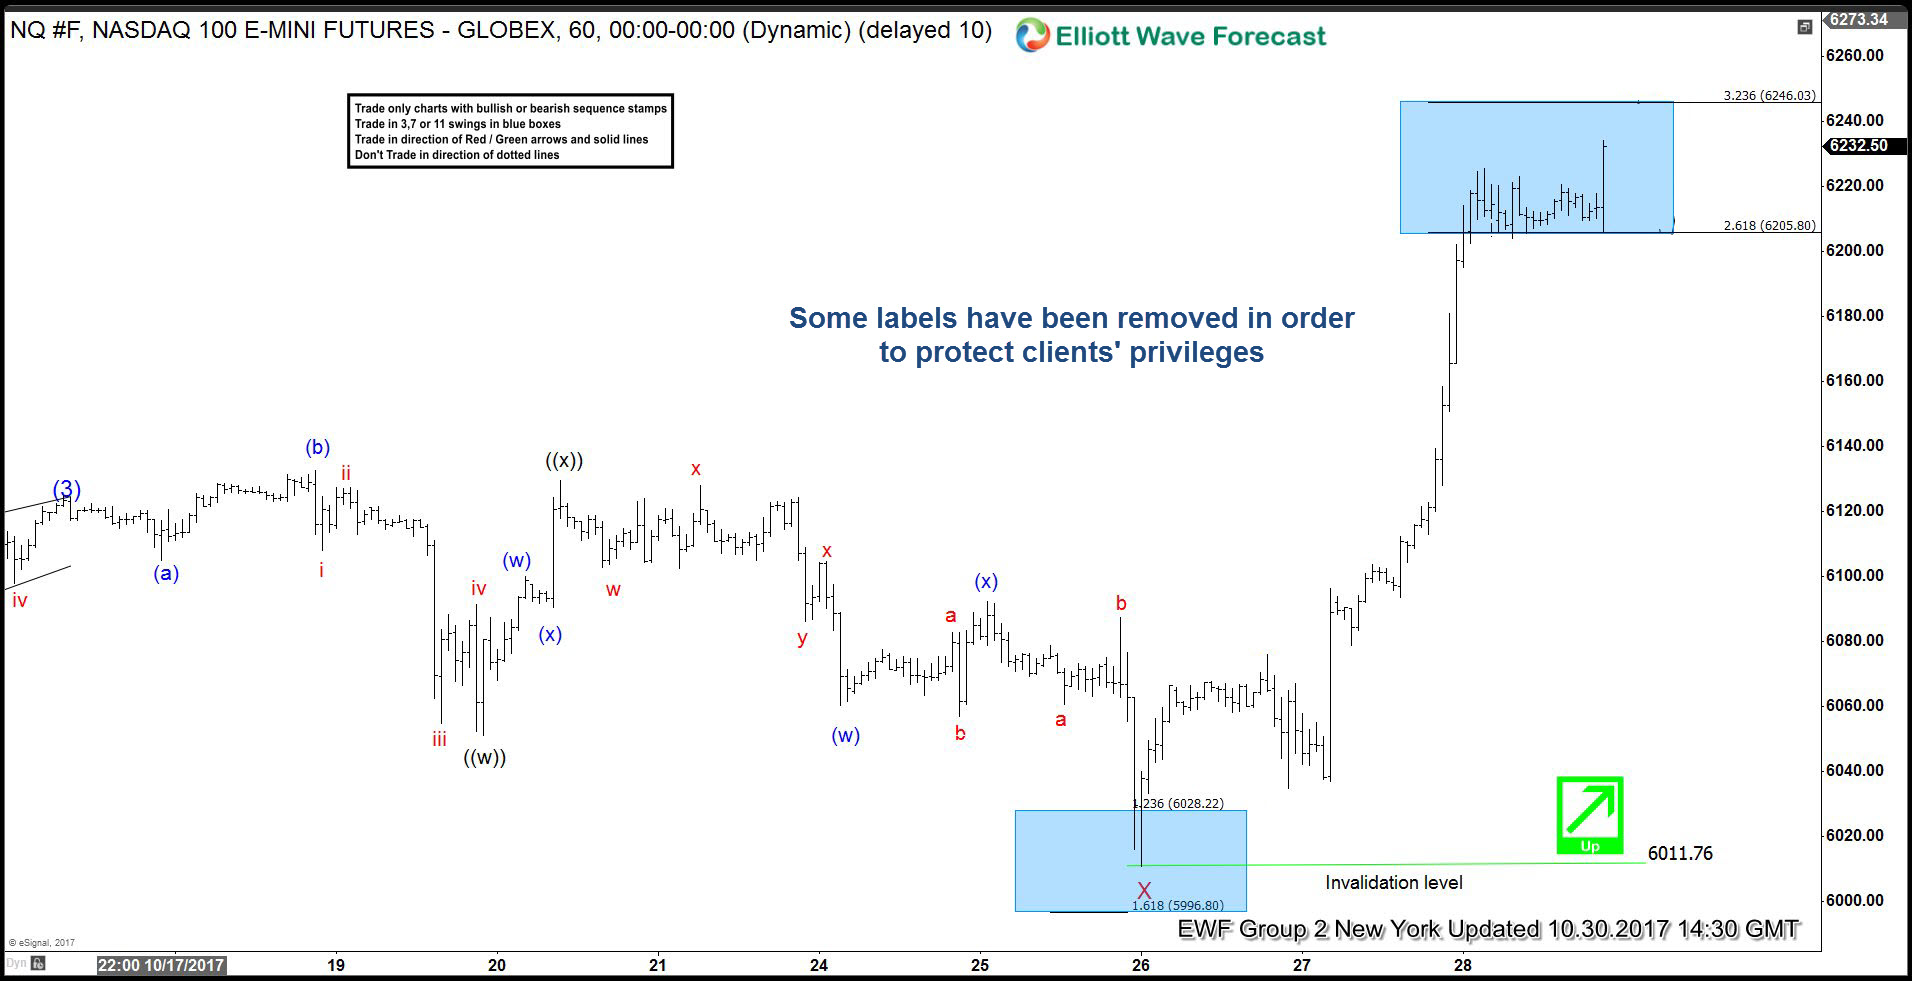
NASDAQ 1 hour New York update 10.30.2017
6011.76 low held nicely during short term pull back and we got further rally. Buyers were strong enough to break the price above previous peak. We have removed some lables on the chart below, in order to protect clients’ privileges. If you’re interested in new Elliott Wave forecasts of Nasdaq you can find them in the membership area of EWF.
Elliott Wave Forecast
We cover 78 instruments in total, but not every chart is trading recommendation. We present Official Trading Recommendations in Live Trading Room. If not a member yet, Sign Up for Free 14 days Trial now and get access to new trading opportunities.
Through time we have developed a very respectable trading strategy which defines Entry, Stop Loss and Take Profit levels with high accuracy and allows you to make position Risk Free, shortly after taking it. If you want to learn all about it and become a professional Trader, join us now.
Welcome to ElliottWave-Forecast.com !
Back


